

Summary
Branched chain amino acids (BCAA) are strongly associated with dysregulated glucose and lipid metabolism, but the underlying mechanisms are poorly understood. We report that inhibition of the kinase (BDK) or overexpression of the phosphatase (PPM1K) that regulate branched-chain ketoacid dehydrogenase (BCKDH), the committed step of BCAA catabolism, lowers circulating BCAA, reduces hepatic steatosis and improves glucose tolerance in the absence of weight loss in Zucker fatty rats. Phosphoproteomics analysis identified ATP-citrate lyase (ACL) as an alternate substrate of BDK and PPM1K. Hepatic overexpression of BDK increased ACL phosphorylation and activated de novo lipogenesis. BDK and PPM1K transcript levels were increased and repressed, respectively, in response to fructose feeding or expression of the ChREBP-β transcription factor. These studies identify BDK and PPM1K as a ChREBP-regulated node that integrates BCAA and lipid metabolism. Moreover, manipulation of the BDK:PPM1K ratio relieves key metabolic disease phenotypes in a genetic model of severe obesity.
eTOC Blurb
Branched-chain amino acids (BCAA) are strongly associated with metabolic diseases. White et al. demonstrate that the kinase (BDK) and phosphatase (PPM1K) that regulate a rate-limiting BCAA metabolic enzyme, BCKDH, also regulate ATP-citrate lyase, a key lipogenic enzyme, thus identifying a new regulatory node that integrates BCAA and lipid metabolism.
Introduction
An association of elevated branched-chain amino acids (BCAA—Leu, Val, Ile) with obesity and insulin resistance was first reported nearly 50 years ago (Felig et al., 1969). With the advent of metabolomics technologies, it has since become apparent that the association of BCAA and related metabolites (glutamate/glutamine, phenylalanine, tyrosine, C3 and C5 acylcarnitines) with metabolic diseases is among the strongest reported for any biomarker (Newgard, 2017; Newgard et al., 2009; Wang et al., 2011). BCAA and their metabolites are also prognostic at baseline for incident type 2 diabetes (T2D) and obesity intervention outcomes (Palmer et al., 2015; Shah et al., 2012; Wang et al., 2011). Moreover, in meta-analysis of 16,596 individuals, BCAA levels were strongly associated with a SNP near the PPM1K (also referred to as PP2Cm) gene, which encodes the phosphatase that dephosphorylates and activates the branched-chain ketoacid dehydrogenase (BCKDH) complex, the first committed step in BCAA catabolism (Lotta et al., 2016). Further analysis revealed that a change of one standard deviation in Ile, Leu, or Val levels was associated with significant increases in odds ratios for T2D. Together, these findings demonstrate strong genetic and biochemical associations of perturbed BCAA metabolism with human metabolic diseases and conditions.
In parallel, evidence has mounted that elevated BCAA levels in obesity result at least in part from lower rates of catabolism in liver and adipose tissue (Herman et al., 2010; Hsiao et al., 2011; Lian et al., 2015; Pietiläinen et al., 2008; She et al., 2007; White et al., 2016). Coordinated downregulation of multiple BCAA metabolizing enzymes appears to account for reduced BCAA catabolism in adipose tissue in obese rodents and humans (Herman et al., 2010; Hsiao et al., 2011; Pietiläinen et al., 2008; She et al., 2007). In contrast, in liver, where BCKDH activity is substantially higher than other tissues, obesity is associated with hyper-phosphorylation of the regulatory serine 293 of the e1a subunit (also designated as E1α) of BCKDH to suppress its activity (Lian et al., 2015; She et al., 2007; White et al., 2016). The large, multi-subunit BCKDH enzyme complex consists of three components (e1, e2, and e3) that carry out different phases of a reaction in which branched-chain keto acids (BCKA) are converted to branched-chain acyl CoAs. The BCKDH kinase (BDK) and the PPM1K phosphatase are tightly associated with the e2 component, and carry out phosphorylation and dephosphorylation, respectively, of serine 293 of the adjoining e1a subunit. Increased phosphorylation of BCKDH on serine 293 in liver of rodent models of obesity occurs secondary to elevated expression of BDK, and lower expression of PPM1K (Lian et al., 2015; She et al., 2007). The balance of BDK and PPM1K expression in liver is influenced by adiponectin (Lian et al., 2015) and may also be partly controlled through a brain-liver axis (Shin et al., 2014). However, while these studies and others involving transgenic knockout of BDK or PPM1K in mice (Joshi et al., 2006; Lu et al., 2009) show that modulation of BDK and PPM1K expression can affect circulating BCAA levels, mechanisms by which BDK or PPM1K might regulate glucose and lipid homeostasis have not been established in animal models or humans.
The goal of the current study was to gain deeper understanding of the relationship(s) between perturbations in the ratio of BDK:PPM1K activities and regulation of other macronutrient metabolic pathways.
Results
Inhibition of BDK lowers hepatic TG levels and improves glucose tolerance
We investigated the potential therapeutic impact of manipulation of the BCKDH complex and its regulatory kinase, BDK, and phosphatase, PPM1K. We first treated obese and insulin resistant Zucker fatty rats (ZFR) with 3,6-dichlorobrenzo(b)thiophene-2-carboxylic acid (BT2), a small molecule inhibitor of BDK (Tso et al., 2014). Daily treatment of ZFR with BT2 (20mg.kg−1 i.p.) for one week increased BCKDH enzyme activity in liver, heart, and skeletal muscle (Figure 1A). The increase in BCKDH activity in BT2-treated rats was accompanied by lower levels of BCKDH phosphorylation on serine 293 of the e1a subunit in liver and heart, whereas the small increment in skeletal muscle BCKDH activity was not associated with a detectable change in BCKDH phosphorylation (Figure 1B). Systemic activation of BCKDH with BT2 lowered circulating BCAA levels, coupled with more dramatic lowering of all three branched-chain α-ketoacids (BCKA), the immediate substrates of BCKDH (Figure 1C–D). Thus, systemic activation of BCKDH with BT2 is an effective means of lowering circulating BCAA and their α-ketoacids in genetically obese ZFR.
Figure 1. Metabolic effects of BT2 treatment or PPM1K expression in Zucker fatty rats.

(A) BCKDH activity in liver, heart and skeletal muscle (Skm) tissue of BT2 (20mg/kg i.p.) or vehicle (Veh)-treated Zucker fatty rats (ZFR). (B) Representative immunoblots of total and phospho-ser 293 of BCKDH e1a. Effects of BT2 on circulating branched chain amino acids (BCAA) (C) and branched chain keto acids (BCKA) (D). Body (E) and tissue (F) weights measured at the end of the study period. (G) Liver triacylglyceride content in BT2- and Veh-treated ZFR. Glucose (H) and insulin (I) excursions during a 1g/kg IP glucose tolerance test. Data in panels A–I are expressed as the mean ± SEM, n=8–10 animals per group. * P<0.05, ** P<0.01, *** P<0.001. Recombinant adenoviruses expressing human PPM1K (Ad-CMV-PPM1K) or GFP (Ad-CMV-GFP) were administered to 14 week-old Zucker fatty rats (ZFR) via tail vein. (J) Expression of human and endogenous (rat) PPM1K mRNA in liver. (K) Effect of each adenovirus on BCKDH activity in liver and heart tissue. (L) Representative immunoblots of total and phospho-ser 293 of BCKDH e1a, PPM1K, and GFP in liver. Effects of each adenovirus on circulating BCAA (M) and BCKA (N). Body (O) and tissue (P) weights measured at the end of the study period. (Q) Liver triacylglyceride content. Glucose (R) and insulin (S) excursions during a 1g/kg i.p. glucose tolerance test. Data in panels J–S are expressed as the mean ± SEM, n=6–10 animals per group. * P<0.05, ** P<0.01, *** P<0.001. See Supplemental Figures 1 and 2 for related information.
Lowering of BCAA and BCKA via BT2 administration for one week did not affect body, liver, adipose or skeletal muscle weight (Figure 1E–F). However, BT2-treated ZFR had significantly lower hepatic TG levels (Figure 1G). Glucose and insulin excursions were also significantly smaller during an intraperitoneal glucose tolerance test (ipGTT) in ZFR treated with BT2 compared to vehicle-treated controls (Figure 1H–I). Lower glucose excursions accompanied by lower insulin levels reflect improvement in insulin sensitivity in ZFR after a single week of BT2 administration. Thus, inhibition of BDK is an effective approach for correction of abnormalities in glucose, lipid, and amino acid homeostasis in obese animals, even in the absence of weight loss.
We also measured energy balance via indirect calorimetry. We observed that treatment of ZFR with BT2 had no impact on O2 consumption or heat production, whereas it lowered the respiratory exchange ratio (RER) in the hours following administration, likely reflecting a shift in substrate preference from glucose to fatty acids (Supplementary Figure 1A). Consistent with this interpretation, BT2 treatment resulted in lower levels of lactate in circulation (Supplementary Figure 1B). Whereas there were no effects of BT2 treatment on circulating TG, cholesterol, glycerol, non-esterified fatty acids (NEFA), or ketones (Supplementary Figure 1D), BT2-treated ZFR exhibited increases in a broad array of even chain acyl-carnitines in liver (Supplementary Figure 1C), but not in skeletal muscle. The constellation of elevated even chain acylcarnitines, lower RER, and reduced TG content suggests that inhibition of BDK with BT2 suppresses fat storage and activates fatty acid oxidation in liver.
PPM1K overexpression mirrors the metabolic effects of BDK inhibition
We next used recombinant adenovirus to overexpress human PPM1K as an independent molecular approach for activating BCKDH activity in liver of ZFR. One week after tail-vein administration of recombinant adenoviruses, we observed clear expression of human PPM1K mRNA in liver of Ad-CMV-PPM1K but not Ad-CMV-GFP-treated ZFR (Figure 1J). Adenovirus-mediated PPM1K overexpression increased hepatic PPM1K protein levels (Figure 1I), and hepatic but not cardiac BCKDH enzymatic activity (Figure 1K). As observed with BT2, higher hepatic BCKDH activity in Ad-CMV-PPM1K-treated rats was associated with lower levels of BCKDH phosphorylation on serine 293 compared to Ad-CMV-GFP-treated ZFR (Figure 1L). Ad-CMV-PPM1K administration also tended to lower valine and significantly lowered leucine/isoleucine levels (Figure 1M) in concert with a robust and significant lowering of all three BCKA (Figure 1N).
Similar to BT2, Ad-CMV-PPM1K administration had no effect on body, liver, adipose, or skeletal muscle weight over the 7-day study period (Figure 1O–P), yet significantly lowered hepatic TG content compared to Ad-CMV-GFP-treated ZFR (Figure 1Q). Like BT2 treatment, administration of Ad-CMV-PPM1K also decreased the glucose excursion during an ipGTT while also tending to lower the insulin excursion (Figure 1R–S). Again, these effects were accompanied by lower circulating lactate levels (Supplemental Figure 2A) and higher levels of even chain acyl-carnitines in liver (Supplemental Figure 2B). Also similar to BT2, Ad-CMV-PPM1K treatment had no effects on circulating TG, cholesterol, glycerol, non-esterified fatty acids (NEFA), or ketones (Supplementary Figure 2C).
Phospho-proteomics screen reveals substrates in addition to BCKDH for BDK and PPM1K
The broad effects of BT2 and PPM1K overexpression on glucose and lipid metabolism in addition to amino acid metabolism could suggest that BDK and PPM1K have biological substrates in addition to BCKDH. To investigate this idea further, we employed unbiased mass spectrometry-based phospho-proteomics to broadly measure site-specific phosphorylation changes in liver samples from both the BT2 study (comparing BT2-treated to vehicle-treated ZFR), and the PPM1K study (comparing Ad-CMV-PPM1K to Ad-CMV-GFP-treated ZFR). A schematic summary of our quantitative phosphoproteomics workflow using peptide labeling with isobaric tags (TMT) and Orbitrap mass spectrometry is shown in Figure 2A.
Figure 2. Phospho-proteomics reveals additional targets of BDK and PPM1K in liver.

(A) Study workflow. Panels (B) and (C) show flanking amino acid sequences of all phosphosites downregulated by BT2 or Ad-CMV-PPM1K treatments, respectively. Thresholds of ≥ −0.585 Log2 fold change in phosphorylation and statistical significance of P < 0.05 were used (n=3 samples per group). The modulated serine in each phosphoprotein is highlighted in red. Consensus phosphosite motif sequences generated for BT2 (D) and Ad-CMV-PPM1K (E) modulated phosphosites. (F) Representative immunoblot for phospho-ser454 and total ATP citrate lyase (ACL), BDK, and GAPDH proteins in liver tissues from BT2- or Veh-treated Zucker fatty rats (ZFR). (G) Representative immunoblot for phospho-ser454 and total ATP citrate lyase (ACL), PPM1K, and GAPDH in liver tissues from Ad-CMV-PPM1K- or Ad-CMV-GFP-treated ZFR. Representative immunoblots in panels F and G are shown alongside densitometric analyses of pACL/total ACL. Data are expressed as mean ± SEM from n=5 animals per group. ** P<0.01. See Supplemental Table 1 for additional details.
We quantified 5169 phosphopeptides in livers from the BT2 study and 4350 phosphopeptides in livers from the PPM1K study. Of these, only 11 phosphopeptides encompassing 12 phosphosites from 9 proteins were classified as significantly downregulated in the BT2 study using a threshold of Log2 fold change ≥ −0.585 with P<0.05, whereas 7 phosphopeptides encompassing 6 phosphosites from 4 proteins were classified as significantly downregulated in the PPM1K study (Figure 2B–C). Serine 454 (serine 455 in humans) of ATP-citrate lyase (ACL) was the only phosphosite found to be significantly downregulated in both studies (Figure 2B–C). The function of ACL is to cleave citrate to form acetyl CoA and oxaloacetate. Acetyl CoA can then form malonyl CoA, which serves as both the immediate substrate for de novo lipogenesis and an allosteric inhibitor of CPT1 and fatty acid oxidation. The other product of the ACL reaction, oxaloacetate, can be utilized for gluconeogenesis (Des Rosiers et al., 1995) and other metabolic pathways. Phosphorylation of ACL on serine 454 activates ACL (Potapova et al., 2000) and knockout of ACL in genetically obese mice markedly improves glucose tolerance and hepatic steatosis (Wang et al., 2009). Thus, a decrease in phosphorylation of ACL in response to BT2 treatment or PPM1K overexpression could contribute to the effects of these interventions on glucose and lipid metabolism described in Figure 1 and Supplementary Figures 1 and 2.
Serine 293 of BCKDH e1a, identified as serine 333 in proteomics data because of inclusion of the N-terminal mitochondrial targeting sequence, was not observed to be modulated in either the BT2 or PPM1K study, although there was a trend for decreased phosphorylation in the BT2 study (Log2 fold change of −0.68, p = 0.054). Nevertheless, the immunoblot data presented in Figure 1 clearly demonstrate the expected decrease in phosphorylation of the BCKDH e1a subunit in response to BT2 and Ad-CMV-PPM1K treatment of ZFR. This apparent discrepancy is likely due to a combination of methodological limitations including the tendency of phosphorylation sites immediately after a basic residue to promote missed cleavages by trypsin, complications in detecting multi-site hierarchical phosphorylation within a given peptide, and quantitative interference from peptide co-isolation (Rauniyar and Yates, 2014; Winter et al., 2009).
We next performed a motif scan to query the sequence similarity around phosphorylated amino acids identified in our proteomics study. Based on the immunoblot data shown in Figure 1, we included serine 293 of the BCKDH e1a subunit in this analysis. We hypothesized that BDK and PPM1K substrates would possess common sequence motifs around the phosphosites. Previous work on BCKDH described the sequence “SxxE/D” as required for phosphorylation of BCKDH e1a on ser293 (ser333) and ser303 (ser343) by BDK (Pinna and Ruzzene, 1996). To our knowledge there is no known consensus motif for PPM1K. The flanking sequences for all phosphosites for which phosphorylation was reduced by BT2 treatment or PPM1K overexpression are shown in Figures 2B and 2C. We found that 8/13 input sequences from the BT2 study, including ACL ser454, contained the canonical BDK motif, “SxxE/D” (Figure 2D). Phosphosite scans of the seven identified phosphosites regulated by PPM1K overexpression revealed two common motifs. All PPM1K-regulated phosphosites contained either an “SxS” (5/7) or an “RxxS” (5/7) motif with three of the seven phosphosites, including ser454 of ACL, possessing both i.e. “RxxSxS” (Figure 2E). Together these data suggest that PPM1K and BDK likely recognize distinct motifs. Notably, ser293 of BCKDH e1a and ser454 of ACL are surrounded by both the known BDK consensus sequence “SxxD/E” and one or both of the PPM1K motifs (“SxS” or “RxxS”) identified here.
Immunoblot confirmation of regulation of ACL by BDK and PPM1K
We next used immunoblot analysis to generate direct evidence that BDK inhibition and PPM1K overexpression regulate ACL phosphorylation on ser454. Consistent with our phospho-proteomics data, liver lysates from ZFR treated with BT2 or Ad-CMV-PPM1K displayed markedly less ACL phosphorylation, measured with an antibody recognizing phosphorylated ser454 of ACL, compared to samples from ZFR treated with vehicle or Ad-CMV-GFP, respectively (Figure 2F–G). We also observed that lower phosphorylation of ACL was associated with a trend for lower abundance of total ACL protein in the BT2 study. Nevertheless, scanning of the immunoblots demonstrated that the reduction in phosphorylation on ser454 remained significant in both the BT2 and PPM1K studies after correction for total ACL abundance (P<0.01). Since acetylation has been reported to stabilize ACL by preventing ubiquitination and subsequent proteasomal degradation (Lin et al., 2013), the modest reduction in ACL abundance in the BT2 study may be related to reduced acetyl CoA formation by the dephosphorylated and less active ACL enzyme.
Mitochondrial and cytosolic pools of BDK and PPM1K facilitate regulation of mitochondrial BCKDH and cytosolic ACL
Our data suggest that BDK and PPM1K influence the phosphorylation states of ACL and BCKDH, despite the fact that the two target enzymes are known to reside in the cytosolic and mitochondrial subcellular compartments, respectively. In an attempt to resolve this apparent paradox, we performed subcellular fractionation studies of liver extracts taken from lean healthy 8-week old Wistar rats in both fasted and fed states. We prepared cytosolic and mitochondrial fractions from these samples, and confirmed their purity by blotting for the established mitochondrial markers ETFA and COXIV, and the cytosolic protein GAPDH. We further confirmed the absence of mitochondrial contamination in cytosolic fractions by assaying citrate synthase activity. Importantly, ETFA or COXIV protein (Figure 3A) and citrate synthase activity (not shown) were undetectable in the cytosolic fractions, whereas GAPDH was not detected in the mitochondrial fraction (Figure 3A). ACL was detected exclusively in the cytosolic fractions, as expected. PPM1K was preferentially found in the mitochondrial fraction, but also clearly detected in the cytosol (Figure 3A). Surprisingly, BDK was preferentially localized in the cytosolic fraction, but also detected in the mitochondrial fraction. The slightly slower gel migration of cytosolic BDK than its mitochondrial counterpart is consistent with the presence of a previously reported 30-amino acid residue mitochondrial targeting sequence in cytosolic BDK that is cleaved as the enzyme enters the mitochondria (Popov et al., 1992). Interestingly, PPM1K protein levels in the cytosol were markedly reduced in the fed compared to fasted states (Figure 3A). In contrast, cytosolic BDK levels were unaffected by the transition from fasting to feeding (Figure 3A).
Figure 3. Subcellular localization of ACL, BDK and PPM1K and effect of BDK overexpression on ACL phosphorylation in vitro.

(A) Representative immunoblots of ACL, BDK, PPM1K, the mitochondrial markers ETFA and COXIV, and the cytosolic marker GAPDH in cytosolic and mitochondrial fractions of liver from lean Wistar rats sacrificed in the ad-libitum fed or overnight fasted states. (B–C) Volcano plots showing the subcellular location of proteins containing phosphopeptides found to be downregulated by BT2 or Ad-CMV-PPM1K treatments, respectively. (D) Effect of Ad-CMV-BDK overexpression in Fao cells on ACL phosphorylation on ser454, total ACL, BCKDH e1a phosphorylation on ser293, total e1a, and BDK protein abundance. Densitometric analysis of pACL/ACL ratio is shown below the representative blot. Data are mean ± SEM representing n=3 independent experiments. ** P<0.01. (E) Confocal images of Hek293 cells transfected with plasmid encoding a GFP tagged BDK lacking the mitochondrial targeting sequence, under control of a CMV promoter (CMV-ΔMTS-BDK-GFP) or CMV-GFP control constructs co-stained with MitoTracker (red) and Hoechst (blue). (F) Effect of Ad-CMV-ΔMTS-BDK overexpression in Fao cells on ACL phosphorylation on ser454, total ACL, BCKDH e1a phosphorylation on ser293, total e1a, and BDK protein abundance. Densitometric analysis of pACL/ACL ratio is shown below the representative blot, as mean ± SEM of 3 independent experiments. ** P<0.01. (G) Studies with purified ACL, protein kinase A (PKA), and BCKDH subunit proteins. The lower panel demonstrates direct phosphorylation of ACL and the e1a subunit of BCKDH by both BDK and protein kinase A (PKA). The Coomassie stain of the same gel is shown in the upper panel. See Supplemental Figure 3 for related experiments.
We also screened the other 11 phosphopeptides identified in our BT2 study, and the 7 phosphopeptides from our PPM1K study against the annotated subcellular localization data for their parent proteins from the Gene Ontology database. Remarkably, we found that 45% (5 of 11) and 57% (4 of 7) of the modified phosphopeptides from the BT2 and PPM1K studies, respectively, are in proteins annotated as extra-mitochondrial (Figures 3B–C). Taken together, these studies demonstrate localization of BDK and PPM1K in both the cytosolic and mitochondrial compartments, consistent with their proposed interactions with both the cytosolic ACL enzyme and the mitochondrial BCKDH complex.
Direct phosphorylation of ACL by BDK in an AKT-independent manner
Since AKT and protein kinase A (PKA) were reported to phosphorylate ACL on ser454 (Potapova et al., 2000; Berwick et al., 2002), and both of these enzymes are well known to respond to hormonal and humoral factors in vivo that may have been influenced by BT2 or Ad-CMV-PPM1K interventions in ZFR, we next prepared a recombinant adenovirus containing the cDNA encoding BDK (Ad-CMV-BDK) and used it to express BDK in FAO hepatoma cells in vitro. Treatment of these cells with Ad-CMV-BDK for seventy-two hours increased phosphorylation of ACL on ser454 and the e1a subunit of BCKDH on ser293 (Figure 3D). These data demonstrate that BDK regulates ACL phosphorylation in a cell autonomous manner independent of hormonal or humoral factors that could have contributed in the in vivo setting.
We next evaluated whether phosphorylation of ACL on ser454 is mediated by AKT. We treated FAO cells with Ad-CMV-BDK or Ad-CMV–βGAL adenoviruses for seventy-two hours, and then incubated the cells in the presence or absence of the pan-AKT inhibitor A6730 (10μM) for 1 hour (Li et al., 2010). Whereas A6730 had the expected effect to reduce phosphorylation of ser473 on AKT, causing inactivation of the enzyme, the effect of Ad-CMV-BDK to increase ACL phosphorylation on ser454 was readily apparent in the presence of the AKT inhibitor (Supplementary Figure 3A). We also observed no change in levels of phospho-ser473 AKT in Fao cells treated with Ad-CMV-BDK compared to Ad-CMV–βgal (Supplementary Figure 3A), or in the livers of rats treated with BT2 or Ad-CMV-PPM1K compared to their respective controls (Supplementary Figure 3B). These findings support the conclusion that BDK-induces phosphorylation of ACL on ser454 independent of AKT activity.
To test if BDK phosphorylates ACL in the cytosolic compartment of living cells in a BCDKH-independent manner, we prepared a recombinant adenovirus expressing a form of BDK that lacks its mitochondrial targeting sequence (Ad-CMV-ΔMTS-BDK). We show using confocal microscopy that a GFP tagged ΔMTS-BDK construct is effectively restricted to the cytosolic compartment, and is absent from mitochondria (Figure 3E). Importantly, as observed with overexpression of wild type BDK, transfection of FAO cells with Ad-CMV-ΔMTS-BDK for seventy-two hours resulted in increased phosphorylation of ACL on ser454 (Figure 3F). This occurred absent any change in BCKDH phosphorylation. These studies demonstrate that cytosolic BDK functions to increase ACL phosphorylation in a manner that is independent from its effect on its canonical mitochondrial target BCKDH.
To determine if BDK can phosphorylate ACL directly, we expressed and purified a maltose-binding protein (MBP)-tagged version of mature BDK that lacks the mitochondrial-targeting pre-sequence (MBP-BDK) (Davie et al., 1995) and mixed it with purified ACL in the presence of [32P] ATP. Given reports of ACL phosphorylation by protein kinase A (PKA) (Potapova et al., 2000), we did the same experiment with purified ACL and purified PKA. The e2 component of the BCKDH complex, which facilitates phosphorylation of BCKDH by BDK, was also included in the reaction mixture for experiments involving BDK, as BCKDH e2 binding to BDK augments kinase activity and stability (Tso et al., 2014). In contrast, the catalytic subunit of PKA neither interacts with nor is activated by BDKDH e2; therefore, BCKDH e2 was not included in lanes where PKA activity was studied. As previously reported, PKA caused a clear increase in 32P labeling of ACL. Importantly, MBP-BDK also caused phosphorylation of ACL, albeit to a lesser extent than PKA (Figure 3G). MBP-BDK also caused a robust increase in phosphorylation of the purified e1a subunit of BCKDH. Intriguingly, PKA caused a lesser, but still clear increase in BCKDH phosphorylation (Figure 3G). In a parallel experiment, we mixed purified V5-tagged BDK and ACL proteins and measured ACL phosphorylation by immunoblot analysis. This study confirmed that BDK specifically phosphorylates ser455 of the V5-tagged human ACL (corresponding to ser454 in rats; Supplementary Figure 3C).
BDK stimulates ACL phosphorylation and de novo lipogenesis in vivo
In line with a physiologically relevant role for ACL phosphorylation, we observed that phosphorylation on ser454 is higher in liver samples from ad-lib fed compared to fasted rats (Figure 4A), a state where glucose is abundant and flux through ACL is increased to provide malonyl CoA for lipogenesis and to curtail fatty acid oxidation. Notably, the increase in ACL phosphorylation on ser454 in the fed state corresponds to the decrease in PPM1K protein abundance observed in the cytosolic fraction of livers from fed rats (Figure 3A).
Figure 4. BDK phosphorylates ACL and activates de novo lipogenesis in vivo.

(A) Representative immunoblot of phospho-454 and total ATP citrate lyase (ACL) in unfractionated liver samples from the same fasted or fed Wistar rats used for the fractionation study shown in Figure 3A. (B) ACL phosphorylation on ser454, total ACL, and BDK protein abundance in liver of Ad-CMV-BDK or Ad-CMV-βGAL-treated Wistar rats. (C) Densitometric analysis of pACL/ACL ratio. (D) Effect of Ad-CMV-BDK on rates of de novo lipogenesis (DNL) measured as incorporation of D2O into newly synthesized palmitate in liver. (E) D2O enrichment in plasma of Ad-CMV-BDK and Ad-CMV-βGAL-treated rats at sacrifice. (F) Body weights in Ad-CMV-BDK and Ad-CMV-βGAL-injected rats. Data in panels C–F are expressed as mean ± SEM, n=4–6 rats per group. ** P<0.01. (G) Dual localization of BDK and PPM1K in the cytosolic and mitochondrial subcellular compartments enables these enzymes to simultaneously modify the phosphorylation states of ACL and BCKDH, resulting in coordinated regulation of lipid and BCAA metabolism.
To test the direct effects of modulation of the BDK:PPM1K ratio in vivo, we injected the Ad-CMV-BDK adenovirus, which encodes full-length BDK inclusive of its MTS, or the Ad-CMV-βGAL control virus into lean healthy ad-lib fed Wistar rats via tail-vein injection. To measure de novo lipogenesis, we delivered a bolus of 2H2O and then provided 2H2O in the drinking water for two days prior to sacrifice. At sacrifice, animals treated with Ad-CMV-BDK had clear increases in liver BDK protein levels compared to Ad-CMV-βGAL-treated controls (Figure 4B). Overexpression of BDK increased the levels of ACL phosphorylation on ser454 (Figures 4B and 4C) and this occurred concomitant with a 2.4-fold increase in deuterium labeling of palmitate in liver of Ad-CMV-BDK compared to Ad-CMV-βGal-treated rats (Figure 4D; p < 0.001). Importantly, the Ad-CMV-BDK and Ad-CMV-βGAL-treated groups had the same level of steady-state 2H2O enrichment in plasma and identical body weights (Figures 4E and 4F). Thus hepatic expression of BDK, a kinase previously known only as a regulator of BCKDH and BCAA metabolism, is sufficient to increase phosphorylation of a critical lipogenic enzyme and activate de novo lipogenesis (Figure 4G).
ChREBP Regulates Hepatic BDK and PPM1K Expression as a Component of a Lipogenic Transcriptional Program
The transcription factor Carbohydrate-Response Element Binding Protein (ChREBP, also known as Mlxipl) responds to cellular hexose phosphate levels to coordinate expression of multiple glycolytic and lipogenic genes, including acetyl CoA carboxylase (ACC), fatty acid synthase (Fasn), the liver isoform of pyruvate kinase (Pklr) and ACL (Iizuka et al., 2004). Given the role that we have ascribed to BDK and PPM1K in regulation of ACL phosphorylation and lipogenesis, we investigated the possibility that these genes are regulated by ChREBP as part of a “lipogenic gene cluster”. Consistent with this idea, a recent ChIP-seq analysis identified a ChREBP binding site 2.5 kb upstream of the BDK transcriptional start site (Jeong et al., 2011). We searched genomic sequences across a broad array of species and found that an enhancer upstream of the BDK gene containing this regulatory motif is conserved in humans, non-human primates, and a wide range of mammals including rats, but is surprisingly absent in mice (Figure 5A). We previously demonstrated that expression of the ChREBP-β isoform is an excellent marker of cellular ChREBP activity (Herman et al., 2012; Kim et al., 2016). In liver biopsy samples from 86 overnight fasted human subjects with non-alcoholic fatty liver disease (NAFLD) (49 male, 37 female, age range 18–83; median age 52), expression of ChREBP-β correlates with expression of Pklr and Fasn (Kim et al., 2016). We evaluated the association of ChREBP-β and BDK transcript levels in these same human samples and found a similar correlation as observed for the classical ChREBP target genes (R2 = 0.34, p < 0.001; Figure 5B). We then fasted lean rats and refed them with either standard chow or a high-fructose diet to activate hepatic ChREBP-β (Kim et al., 2016). ChREBP-β mRNA levels increased 40-fold in response to high-fructose and was accompanied by marked increases in Fasn, Pklr, and ACL, as well as BDK transcript levels (Figure 5C). In contrast, PPM1K mRNA levels were suppressed by 35% in response to high-fructose refeeding.
Figure 5. Transcriptional regulation of BDK and PPM1K by ChREBP.

(A) Conservation across mammalian species of an enhancer containing a ChREBP binding site proximal to the human BDK gene. The red arrow locates the ChREBP binding site at a multicolored H3K27Ac “peak” which is indicative of an active regulatory element. Vertical black hatch marks to the right of each mammal indicates conserved sequence relative to the human genome. Note the absence of the element in mice, and its retention in rats. (B) ChREBP-β mRNA expression is positively correlated with BDK mRNA expression in liver biopsies taken from 86 overnight fasted human subjects with non-alcoholic fatty liver disease (NAFLD). (C) Effects of 4 hours of refeeding of high fructose (60% fructose) or standard chow diets to overnight fasted Wistar rats on hepatic transcript levels of known ChREBP response genes, as well as BDK and PPM1K. Data are mean ± SEM, n=5 rats per group. ** P <0.01, *** P<0.001, **** P<0.0001, ***** P<0.00001, ****** P<0.000001. (D) Mouse (m) ChREBP-β and rat (r) Bckdk (BDK), and PPM1K mRNA expression in liver of Ad-CMV-mChREBP-β or Ad-CMV-GFP-treated Wistar rats. Data are mean ± SEM, n=6–8 rats per group. ** P <0.01, *** P<0.001. (E) Schematic summary showing that fructose feeding activates ChREBP-β to drive transcription of the lipogenic program (component genes shown in burgundy), now including BDK as a post-translational activator of the pathway. ChREBP-β induction also leads to repression of PPM1K expression.
To specifically assess the role of ChREBP, we constructed a recombinant adenovirus containing the cDNA encoding mouse ChREBP-β (Ad-CMV-mChREBP-β) and injected it or an Ad-CMV-GFP control virus into 10 week-old Wistar rats by tail vein injection. Seven days after adenovirus administration, rats that received Ad-CMV-mChREBP-β exhibited increased hepatic expression of mChREBP-β compared to Ad-CMV-GFP-treated rats (P<0.01, Figure 5D). Overexpression of ChREBP-β mimicked the effect of fructose refeeding by increasing BDK and reducing PPM1K transcript levels compared to Ad-CMV-GFP control rats (P<0.01, Figure 5D).
Discussion
In the current study, we demonstrate that BDK and PPM1K, the kinase and phosphatase pair that control BCKDH activity and BCAA levels, also modulate hepatic lipid metabolism by regulating reversible phosphorylation of ATP citrate lyase (ACL) on ser454 (Figure 4G). ACL is an important enzyme in de novo lipogenesis and regulation of fatty acid oxidation due to its contributions to production of cytosolic acetyl CoA and malonyl CoA from citrate. In contrast to phosphorylation of BCKDH e1a on ser293, which results in inhibition of enzyme activity, phosphorylation of ACL on ser454 is activating, leading to increased generation of acetyl-CoA and malonyl CoA, the latter serving as the immediate substrate for lipogenesis (Potapova et al., 2000). Increased malonyl CoA levels also inhibit fatty acid oxidation via allosteric inhibition of carnitine palmitoyltransferase-1 (McGarry, 2002). Consistent with this construct, we demonstrate that modulation of the ratio of BDK:PPM1K activities in favor of PPM1K by two distinct experimental approaches not only activates BCKDH to lower BCAA and BCKA levels, but also results in marked reduction in hepatic steatosis, lowering of RER, and increased hepatic even-chain acylcarnitines, all consistent with reduced lipogenesis and increased fatty acid oxidation in the liver. We also observed improved glucose tolerance in response to those maneuvers, possibly secondary to the marked lowering of hepatic TG content (Samuel and Shulman, 2017). These improvements in metabolic health mirror those observed in response to ACL knockout in genetically obese mice (Wang et al., 2009), and suggest that the BDK:PPM1K axis serves as a metabolic regulatory node that integrates BCAA, glucose, and lipid metabolism via two distinct phosphoprotein targets.
These unanticipated findings left us with several important questions: 1) How can BCKDH e1a and ACL be BDK and PPM1K substrates, when one of the target enzymes (BCKDH) resides in the mitochondrial matrix, whereas the other (ACL) clearly has a cytosolic localization? 2) Are PPM1K, BDK, and phosphorylation of ACL coordinately regulated in response to fasting and refeeding? One would expect that ACL phosphorylation and activity should be increased in the fed state to facilitate activation of lipogenesis and suppression of fatty acid oxidation; 3) Is BDK capable of direct phosphorylation of ACL?
With regard to the first question, subcellular fractionation studies revealed that BDK and PPM1K are clearly detectable in both the mitochondrial and cytosolic subcellular fractions, thus making it possible for these enzymes to interact with both the BCKDH and ACL substrates. The preferential presence of BDK in the cytosol is consistent with the rather low copy number of BDK bound to the 24-mer transacylase (E2) core of mitochondrial BCKDH from rat liver (Shimomura et al., 1990). We also show that a BDK variant lacking its mitochondrial targeting sequence is expressed in the cytosol, where it phosphorylates ACL in a BCKDH-independent manner. As to the second question, phosphorylation of ser454 on ACL is clearly increased in the fasted to fed transition. Interestingly, this increase is accompanied by a decline in the level of PPM1K protein in the cytosolic, but not the mitochondrial compartment. Concerning the third question, analysis of the amino acid sequence of ACL and comparison to other peptides identified in our phosphoproteomics screen suggests that it could be directly regulated by both BDK and PPM1K due to the presence of a dual BDK-PPM1K motif surrounding the regulatory phosphosite. Moreover, studies summarized in Figure 3 with purified proteins demonstrate direct phosphorylation of ACL on ser454 by BDK. Collectively, these data provide support for a previously unappreciated role for BDK and PPM1K in the regulation of hepatic lipid metabolism.
The literature concerning ACL regulation is scattered over the past twenty years, and in many ways does not present a coherent picture. There is evidence that the enzyme becomes phosphorylated in response to catabolic signaling effectors (e.g. isoproterenol and PKA) as well as anabolic mediators (insulin and Akt) (Berwick et al., 2002; Potapova et al., 2000). However, these studies have been performed in different tissues, and the physiologic significance (or lack thereof) of multiple mechanisms for regulation of ACL has never been fully explored. For example, it is very unlikely that PKA, an enzyme activated by glucagon and other catabolic effectors associated with the fasted state, would play a physiologic role in increasing hepatic ACL phosphorylation and activity in anabolic, fed conditions. On the other hand, the increase in ACL phosphorylation that occurs in the transition from the fasted to the fed state could reasonably be mediated by insulin signaling through the Akt pathway. Our current findings demonstrate that modulation of the BDK/PPM1K ratio affects ACL phosphorylation in an Akt-independent fashion, both in isolated cells, and in liver of living animals. Importantly, just as Akt can be activated by insulin in the anabolic state, here we show that levels of cytosolic PPM1K protein decrease in response to feeding, consistent with a physiological role of this new mechanism.
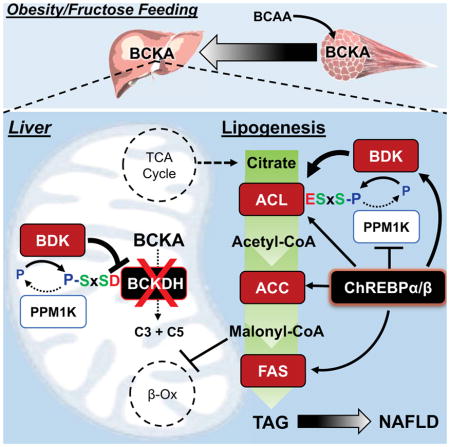
Obesity is a setting in which “selective insulin resistance” appears, a scenario where insulin fails to suppress hepatic glucose output, but continues to promote lipogenesis (Titchenell et al., 2016). Increases in the hepatic BDK:PPM1K ratio, as documented in rodent models of obesity (She, et al., 2007, Lian et al., 2015), and here in response to fructose refeeding, may cause ACL to be constitutively phosphorylated, such that it no longer responds to fasting in the manner demonstrated in lean rats (Figure 4A). This model also aligns with our findings linking the global metabolic transcription factor ChREBP with expression of BDK and PPM1K. The ChREBP-β isoform is a particularly potent activator of lipogenesis in liver that is induced by excess consumption of sucrose as found in soft drinks and other sugar-containing foods common in western diets (Herman et al., 2012; Kim et al., 2016). These findings lead us to propose a disease pathogenesis model in which overnutrition, particularly when involving diets high in fructose, leads to activation of ChREBP in the liver, which drives increased expression of genes encoding classical enzymes of de novo lipogenesis (DNL), including PKLR, ACL, ACC, and FAS. We further posit that upregulation of BDK and downregulation of PPM1K by ChREBP stimulates the DNL pathway by phosphorylation and activation of ACL, thus adding BDK and PPM1K to the panel of genes regulated by ChREBP to enhance fatty acid synthesis and development of dyslipidemia (Figure 5E). Simultaneously, the increased BDK:PPM1K ratio leads to increased phosphorylation and inhibition of BCKDH, contributing to the obesity-linked rise in circulating BCAA and BCKA. These findings suggest that BDK and PPM1K represent a previously unidentified class of ChREBP-β–regulated, lipogenesis-activating genes that perform their function via post-translational modulation of a key enzyme activity (ACL) rather than by playing a direct catalytic role in the metabolic conversion of glucose to lipids.
In addition to drawing attention to serine 454 of ACL as a phosphosite that is regulated by both BDK and PPM1K, our phospho-proteomics screen identified several additional sites in other proteins. For example, serine 25, serine 29, and serine79 of the lipogenic enzyme acetyl-coA carboxylase 1 (ACC1) were found to be less phosphorylated in BT2-treated compared to vehicle-treated ZFR. Serine 25 and 29 are known to be phosphorylated in response to insulin, when ACC1 activity is high (Haystead and Hardie, 1988; Haystead et al., 1988) whereas serine 79 is the highly studied 5′ AMP-activated protein kinase (AMPK) regulatory site that inhibits ACC1 activity (Munday et al., 1988). Thus, while these data suggest that BT2 might mediate some of its effects through regulation of ACC1 phosphorylation and activity, the net effect of these multiple changes in phosphorylation on enzyme activity remains to be determined for ACC1, as well as the other candidate phosphoproteins listed in Figures 2B and 2C.
In conclusion, our findings shed new light on mechanisms underlying the strong relationship between elevated BCAA and cardiometabolic diseases (Newgard, Cell Metabolism, 2017), by showing that the BDK/PPM1K kinase/phosphatase pair regulate both BCAA and lipid metabolism. What remains unclear is if BCAA represent a causal factor, a biomarker, or both. Our current interpretation is that BCAA are both a biomarker of dysregulated lipid metabolism (due in part to mechanisms defined in the current paper), and also a causal agent for metabolic diseases, at least in some contexts. Our own work has shown that supplementation of BCAA into high fat diets fed to normal rats exacerbates insulin resistance (Newgard, et al. Cell Metabolism, 2009), whereas conversely, our group and another have shown that BCAA restriction in ZFR or normal mice improves insulin sensitivity (Fontana et al., 2016; White et al., 2016). Very recent human genetics studies add complexity to the story. Thus, on the one hand, these studies show that genetic variants that cause insulin resistance and dyslipidemia in human populations are strongly associated with increased circulating BCAA, but variants that directly raise BCAA do not exhibit “reverse causality” with insulin resistance (Lotta et al., 2016; Mahendran et al., 2017; Wang et al., 2017). However, two of the studies also show that variants that increase BCAA, including in the PPM1K locus, strongly increase risk for T2D. Thus, we view the human genetic studies as consistent with a causal role for BCAA in development of T2D, if not insulin resistance. The potential translational significance of the present work is further highlighted by our finding that manipulation of the BDK:PPM1K ratio to favor PPM1K via BT2 treatment or PPM1K overexpression lowers liver TG levels and blood glucose excursions in highly obese and insulin resistant ZFR. Thus, our study introduces regulation of ACL by BDK and PPM1K as part of a regulatory node, that when modulated, contributes to simultaneous improvements in lipid, glucose and amino acid metabolism, even in the absence of weight loss.
Limitations of Study
Our studies on the impact of alteration of BDK:PPM1K ratio by pharmacologic (BT2 treatment) or molecular (PPM1K overexpression) methods on obesity-related phenotypes were restricted to a single obesity model, the Zucker-fatty rat (ZFR). It remains to be determined if the salutary effects reported in ZFR on glucose and lipid homeostasis are reproduced in diet-induced or other genetic preclinical models of obesity, or more importantly, in studies of obese humans with metabolic diseases. In addition, our studies of intervention with BT2 treatment or PPM1K overexpression in ZFR were limited to a single time point (1 week). Better understanding of the potential clinical relevance of targeting the BDK/PPM1K axis will require additional studies of longer duration.
STAR Methods
Contact for reagent and resource sharing
Further information and requests for resources and reagents should be directed to and will be fulfilled by the lead contact, Christopher B. Newgard (chris.newgard@duke.edu).
Experimental model and subject details
Animal Studies
All animal procedures were approved by and carried out in accordance with the policies of the Duke University Institutional Animal Care and Use Committee. Rats were housed in a 12 hour light: dark cycle and given ad-libitum access to food and water for the duration of the study unless stated otherwise. All rats were euthanized by cardiac puncture after being anesthetized with Nembutal (80mg/kg) administered by intraperitoneal (i.p.) injection. Tissues and plasma were rapidly harvested and snap frozen in liquid nitrogen for biochemical analyses.
Individually housed, male 12 week-old Zucker fatty rats (ZFR, Charles River Laboratories) maintained on a custom control low fat (LF) diet (A11072001, Research Diets) were used for the BDK inhibition and PPM1K overexpression studies. For the BDK inhibition study, ZFR were administered the small molecule BDK inhibitor (Tso et al., 2014) 3,6- dichlorobenzo[b]thiophene-2-carboxylic acid (BT2, Sigma) daily at a dose of 20mg/kg dissolved in 200ul of sterile dimethylsulfoxide by i.p. injection for 7 days. The control group was administered an equal volume of vehicle each day. On day 6, following an overnight fast, ZFR were subjected to a 1g/kg i.p. glucose tolerance test (GTT) precisely 1hr after administration of BT2 (20mg/kg i.p.) or vehicle. The glucose tolerance test was performed as described (White, et al., 2016). Following the GTT, rats were returned to their normal cages and provided free access to food and water. Indirect calorimetry was performed in a second cohort of BT2 treated rats on day 6 of BT2 administration. Here ad-libitum fed rats were injected with BT2 (20mg/kg i.p.) or vehicle immediately prior to being placed in an eight-chamber Oxymax system (Columbus Instruments) for seven hours. During their time in the metabolic cages all rats had free access to food and water. The next morning, rats were euthanized in the fed state precisely 1hr following a final dose of BT2 (20mg/kg i.p.) or vehicle.
For the PPM1K overexpression study, male 12 week-old ZFR were administered two doses of cyclosporine (15mg/kg i.p., Novartis) prior to adenovirus administration. The first dose of cyclosporine was given 24 hours prior and the second dose was administered immediately prior to tail vein injection of Ad-CMV-PPM1K or Ad-CMV-GFP adenovirus (2 × 10¹² viral particles per kg). Both viruses use the CMV promoter to drive transgene expression. As for the BT2 study described above, ZFR were subjected to a 1g/kg i.p. GTT on the 6th day following administration of adenovirus and euthanized the next morning in the ad-libitum fed state.
Dual housed, 8-week old male Wistar rats (Charles River Laboratories) maintained on a standard chow diet (TD.7001, Harlan Teklad) were used for the BDK and ChREBP overexpression, fructose refeeding, and subcellular fractionation studies. To achieve BDK overexpression, rats were transfected with recombinant adenoviruses encoding a V5 tagged BDK (Ad-CMV-BDK) or βgal (Ad-CMV-βGAL), driven by the CMV promoter as described for the PPM1K study above. Five days after virus administration rats were injected with a bolus of sterile 2H2O (10μl/g, Sigma) containing 0.09% NaCl (w/v) and maintained on drinking water containing 4% 2H2O for the remainder of the study. Rats were euthanized 2 days later in the ad-lib fed state and liver was snap frozen in liquid nitrogen. For ChREBP overexpression studies, rats were treated with recombinant adenoviruses containing the mouse (m) ChREBP-β (Ad-CMV-ChREBP-β) or GFP (Ad-CMV-GFP) cDNAs, driven by the CMV promoter. Seven days after virus administration, rats were sacrificed as described for the BDK study. To study the effect of fructose refeeding a separate cohort of untreated rats were fasted overnight and then refed with either standard chow or a high fructose diet (TD.89247, Harlan Teklad) containing 60% fructose. Four hours later rats were euthanized. For fractionation studies, rats were euthanized following a 20 hour fast or in the ad-libitum fed state and a 1cm3 portion of the right lobe of the liver was placed in KMEM buffer on ice for subsequent fractionation. The rest of the lobe was snap frozen in liquid nitrogen for subsequent analysis of ACL phosphorylation.
Human samples
We obtained cDNA to measure BDK and PPM1K expression in human liver samples from a previously described study (Kim et al., 2016). These human liver samples were derived from a subgroup of patients enrolled in an NAFLD registry at Beth Israel Deaconess Medical Center (BIDMC) beginning in 2009, which is a prospective study that enrolls subjects with biopsy-proven NAFLD. Human liver samples used for qPCR analysis as shown in Figure 5B were from a subgroup of 86 patients (49 male, 37 female, age range 18–83 years; median age 52 years). Use of human liver samples was approved by the BIDMC institutional research board and the study was conducted in accordance with the Helsinki declaration of 1975, as revised in 1993. All participants consented to the study upon enrollment.
Cell culture studies
Fao hepatoma cells (Sigma) were cultured in RPMI-1640 (Gibco) containing 10% FBS (Sigma). 24 hours after plating, cells were incubated for 18 hours with individual adenoviruses at approximately 8×10⁸ viral particles per mL, and samples were harvested 72 hours later for immunoblot analyses. Human embryonic kidney (HEK) 293 cells were used to visualize localization of CMV-ΔMTS-BDK-GFP and control CMV-GFP constructs by confocal microscopy. Cells were plated and transfected in a 96 well glass bottom plate that had been pre-coated with poly-D lysine solution for 1-hour at room temperature. For transfection, cells were incubated in Opti-mem containing 1.5μl of Mirus, TransIT-293 transfection reagent and 1μg DNA per well. After 24 hours, mitochondrial and nuclear staining was performed in live cells using Image-IT Live Mito and nuclear labeling Kit (Cell permeant MitoTracker Red CMXRos (579/599nm) and Hoechst 33342 (350/461nm) ThermoFisher). Confocal images were captured using a Zeiss LSM 510 inverted confocal microscope using a 405 diode for Hoechst, Argon for GFP, and HeNe 561 for MitoTracker. Images were captured in one plane using a 63x oil objective. Each wavelength was acquired separately and then consolidated after acquisition.
Method details
Adenoviral reagents
Recombinant Ad-CMV-PPM1K and Ad-CMV-GFP adenoviral stocks were purchased from Vector Biolabs. pAd/CMV/V5-DEST containing βgal cDNA was purchased from Thermo Life. Gateway pDONR223 plasmids containing cDNAs encoding BDK (BCKDK, HsCD00511364; includes the N-terminal mitochondrial targeting pre-sequence) and ACL (ACLY, HsCD00399238) were purchased from DNASU (Seiler et al., 2014) and recombined into pAd/CMV/V5-DEST per the manufacturer’s protocol. Recombined adenovirus plasmids were linearized with PacI (NEB) and transfected into HEK293 cells to generate adenoviral stocks. Murine 3x-Flag-ChREBP-beta was cloned into the pShuttle-IRES-hrGFP-1 vector (Agilent) and adenovirus was generated with both the empty and ChREBP vectors using the AdEasy Adenoviral Vector System (Agilent). Adenoviruses and expression vectors for Δ-MTS-BDK were generated using a new modular cloning platform, pMVP, developed in our lab that will be described elsewhere (J. Haldeman, unpublished). In brief, cDNA for BDK devoid of the MTS was amplified from HsCD00511364 (DNASU) without a stop codon by PCR (Forward primer: GGGGACAACTTTTCTATACAAAGTTGCCATGGCTTCGACGTCGGCCACCGA; Rev. primer: GGGGACAACTTTATTATACAAAGTTGTGATCCGGAAGCTTTCCTCC), and subsequently recombined into pDONR221 P4r-P3r (Invitrogen) using BP Clonase II per the manufacturer’s protocol (Invitrogen) to form a Gateway entry plasmid, pENTR R4-R3/cBDK. The expression vector Δ-MTS-BDK-GFP was made by recombination of pENTR R4-R3/cBDK with custom Multisite Gateway Pro entry plasmids containing elements encoding the (1) the CMV promoter and (2) GFP followed by the SV40 polyadenylation signal, into a custom Gateway destination plasmid, pMVPBS-DEST, mediated by LR Clonase II plus (Invitrogen). The GFP control plasmid was generated by LR Clonase II plus-mediated recombination of GFP into pEF-DEST51 (Invitrogen) per the manufacturer’s instructions. The adenoviral vectors Ad-CMV-GFP and Ad-CMV-Δ-MTS-BDK were created by recombination of pENTR R4-R3/cBDK or pENTR R4-R3/GFP with custom Multisite Gateway Pro plasmids encoding (1) the CMV promoter and (2) a 3x-HA epitope tag followed by the bGH polyadenylation signal, into the pAd/PL-DEST adenovirus vector (Invitrogen). Recombinant adenoviral plasmids were linearized with PacI, and propagated in HEK293 cells. All recombinant adenoviruses were amplified in HEK293 cells and purified using CsCl2 gradients, titered by A260, and determined to be E1A deficient using a qRT-PCR screen (Jensen et al., 2013; Lavine et al., 2010).
BCKDH activity assay
Tissue BCKDH activity was measured as previously described (White et al., 2016). Briefly, frozen tissue samples were pulverized in liquid nitrogen, then homogenized using a QIAGEN TissueLyser II in 250 μl of ice cold buffer I (30 mM KPi pH 7.5, 3 mM EDTA, 5 mM DTT, 1 mM α-ketoisovalerate, 3% FBS, 5% Triton X-100, 1 μM Leupeptin). Samples were then centrifuged for 10 min at 10,000 ×g and 50 μL of supernatant was added to 300 μL of buffer II (50 mM HEPES pH 7.5, 30 mM KPi pH 7.5, 0.4 mM CoA, 3 mM NAD+, 5% FBS, 2 mM Thiamine Pyrophosphate, 2 mM MgCl2, 7.8 μM α-keto [1-14C] isovalerate) in a polystyrene test tube containing a raised 1 M NaOH CO2 trap. Tubes were capped and placed in a shaking water bath at 37 °C for 30 min. The reaction mixture was acidified by injection of 70% perchloric acid followed by shaking on an orbital shaker for 1 h. The 14CO2 contained in the trap was counted in a Beckman Coulter LS6500 liquid scintillation counter.
Metabolite profiling
Amino acids were measured in plasma and liver samples, and acylcarnitines in liver samples. Methods of sample handling and extraction have been described previously (Ferrara et al., 2008; Ronnebaum et al., 2006). Amino acid and acylcarnitine profiling was performed by tandem mass spectrometry (MS/MS) (Ferrara et al., 2008; Newgard et al., 2009). All MS analyses employed stable-isotope-dilution with internal standards from Isotec, Cambridge Isotopes Laboratories, and CDN Isotopes. A list of all internal standards used in these studies has been published previously (Ferrara et al., 2008; Newgard et al., 2009).
Plasma concentrations of the alpha-keto acids of leucine (α-keto-isocaproate, KIC), isoleucine (α-keto-β-methylvalerate, KMV) and valine (α-keto-isovalerate, KIV) were measured by LC-MS as previously described (Glynn et al., 2015; White et al., 2016). Other plasma analytes were measured on a Beckman DxC600 autoanalyzer, using reagents for lactate, total cholesterol, and triglycerides from Beckman, and non-esterified fatty acids (NEFA) and ketones (total and 3-hydroxybutyrate) from Wako (Richmond, VA). Glycerol was measured using reagents from TG-B by Roche Diagnostics (Indianapolis, IN). Liver triglycerides were quantified using the triglyceride quantification kit from Abcam. Plasma insulin concentrations were measured with a Millipore EMD Rat insulin ELISA kit.
Phosphoproteomics
Large-scale measurements of phosphorylation changes in response to BT2 and PPM1K were performed based on previously described methods (Grimsrud et al., 2012). Briefly, protein from livers of ZFR treated with BT2 or DMSO in one study, or with Ad-CMV-PPM1K or Ad-CMV-GFP in a second study, were solubilized, digested with LysC and trypsin, labeled with TMT-6plex reagents, and mixed in batches of six to enable two direct comparisons: 1) BT2 vs. DMSO (n=3), 2) PPM1K vs. GFP (n=3). Phosphopeptides were enriched from the majority of each mixture using immobilized metal affinity chromatography (IMAC), and a small portion of the input material was retained for assessment of relative protein abundance. Both phosphopeptide and input fractions were subjected to nanoLC-MS/MS using a nano-Acquity UPLC system (Waters) coupled to a Q Exactive Plus Hybrid Quadrupole-Orbitrap mass spectrometer (Thermo Fischer Scientific). Raw LC-MS/MS data were processed in Proteome Discoverer v2.1 (PD2.1, Thermo Fisher Scientific) and subsequent statistical analysis was performed in Microsoft EXCEL. The precise localisation of the phosphosites found to be significantly altered by each intervention was validated in Proteome Discoverer v2.2. (PD2.2, Thermo Fisher Scientific). Phosphosite motif analysis and logo generation was performed in PhosphoSitePlus® by submitting pre-aligned 15 amino acid sequences for all modulated phosphopeptides from each study into the motif and logo analysis tools (Hornbeck et al., 2015).
Tissue lysis and protein digestion for proteomics
Approximately 50 mg of pulverized liver tissue power from each rat (3 BT2- and 3 DMSO-treated animals; 3 PPM1K- and 3 GFP-overexpressing animals) was re-suspended in 400 μL of ice-cold 8M Urea Lysis Buffer (8 M urea in 50 mM Tris, pH 8.0, 40 mM NaCl, 2 mM MgCl2, 1 mM Na3VO4, 10 mM Na4P2O7, 50 mM NaF, supplemented with protease inhibitor (1x cOmplete mini EDTA-free) and phosphatase inhibitor (1x PhosStop) tablets). Samples were lysed with a TissueLyzer for 30 seconds at 30 Hertz twice and the tissue was further disrupted by sonication with a probe sonicator in three 5 second bursts (power setting of 3), incubating on ice in-between each burst. Samples were centrifuged at 10,000 x g for 10 min at 4 °C and the supernatant was retained. Protein concentration was determined by BCA, and equal amounts of protein (500 μg, adjusted to 2.5 mg/mL with Urea Lysis Buffer) from each sample was reduced with 5 mM DTT at 37°C for 30 min, cooled to RT, alk ylated with 15 mM iodoacetamide for 30 min in the dark and unreacted iodoacetamide quenched by the addition of DTT up to 15 mM. Each sample was digested with 5 μg LysC (100:1 w/w, protein to enzyme) at 37°C for 4 hours. Following dilution to 1.5 M urea with 50 mM Tris (pH 8.0), 5 mM CaCl2, the samples were digested with trypsin (50:1 w/w, protein:enzyme) overnight at 37°C. The samples were acidified to 0.5% TFA and centrifuged at 4000 x g for 10 min at 4 °C to pellet insoluble material. The supernatant containing soluble peptides was desalted by solid phase extraction (SPE) with a Waters 50 mg tC18 SEP-PAK SPE column and eluted once with 500 μL 25% acetonitrile/0.1% TFA and twice with 500 μl 50% acetonitrile/0.1% TFA. The 1.5 ml eluate was frozen and dried in a speed vac.
Peptide labeling and PTM enrichment
Each peptide sample was re-suspended in 100 μL of 200 mM triethylammonium bicarbonate (TEAB), mixed with a unique 6-plex Tandem Mass Tag (TMT) reagent (0.8 mg re-suspended in 50 μL100% acetonitrile), using one TMT kit (reagents 126–131) for the BT2vDMSO comparison (n=3) and a separate TMT kit for the PPM1KvGFP comparison (n=3). Samples were shaken for 4 hours at room temperature and subsequently quenched with 0.8 μL 50% hydroxylamine and shaken for 15 additional minutes at room temperature. For both experiments (BT2vDMSO, PPM1KvGFP), 2.5 uL of each of the six samples was mixed for QC analysis. After subjecting the QC samples to the LC-MS/MS workflow described below, the data was searched as described below, but with TMT labeling as a variable modification on the peptide N-terminus to assess TMT labeling efficiency—which was determined to be 94.6% (BT2vDMSO) and 91.3% (PPM1KvGFP)—and total peptide ratios. For each study, the remainder of all six samples were combined with slight adjustments for any deviation from 1:1:1:1:1:1 ratios, frozen, and dried in a speed vac. The TMT-labeled peptide mixtures for each experiment (BT2vDMSO, PPM1KvGFP) were re-suspended in 1 mL 0.5% TFA and subjected to SPE again with a Waters 100 mg tC18 SEP-PAK SPE column as described above. For both experiments, the eluate was vortexed and split into one aliquot containing ~ 5% of the total peptide mixture (150 μg) and a second aliquot containing ~ 95% (2.85 mg). Both aliquots were frozen and dried in a speed vac. The 150 μg aliquot of the “input” material was saved at −80°C for quantification of unmodified peptides. The 2.85 mg aliquot was subjected to phosphopeptide enrichment via immobilized metal affinity chromatography (IMAC) using Ni-NTA Magnetic Agarose Beads, as decribed previously (51) with slight modifications. Briefly, the beads were washed three times with water, incubated in 40 mM EDTA, pH 8.0 for 30 minutes while shaking, and subsequently washed with water three times. The beads were then incubated with 100 mM FeCl3 for 30 minutes while shaking, and were washed four times with 80% acetonitrile/0.15% TFA. Samples were re-suspended in 1 ml 80% acetonitrile/0.15% TFA, added to the beads, and incubated for 30 minutes at room temperature while shaking. Samples were subsequently washed three times with 1 ml 80% acetonitrile/0.15% TFA and eluted for 1 minute by vortexing in 100 μl of 50% acetonitrile, 0.7% NH4OH. Eluted phosphopeptides were acidified immediately with 50 μl 4% formic acid, frozen and dried in a speed vac.
Nano-LC-MS/MS for TMT proteomic experiment
All samples were submitted to the Duke University School of Medicine Proteomics Core facility for analysis by nanoLC-MS/MS analysis using a nano-Acquity UPLC system (Waters) coupled to a Q Exactive Plus Hybrid Quadrupole-Orbitrap mass spectrometer (Thermo Fischer Scientific) via a nanoelectrospray ionization source. Prior to injection, the phosphopeptide samples were re-suspended in 12 μL 0.1% formic acid supplemented with 10 mM citrate. Each phosphopeptide sample was analyzed by 1D LC-MS/MS with technical replicate analysis with 1 μL of sample injected (~2 hr runs) and by a single 2D LC-MS/MS (5 high pH reversed phase fractions, subjected to ~2 hr runs) with the remainder of the sample injected. For each experiment (BT2vDMSO, PPM1KvGFP), the input material described above (5% of the large-scale mixture, ~ 150 μg of TMT-labeled peptides) was subjected to high pH reversed phase pre-fractionation for 2D LC-MS/MS twice, once using 5 fractions (subjected to ~45 min LC-MS/MS runs each) and once using 9 fractions (subjected to ~3 hr runs each). For each injection, the sample was first trapped on a Symmetry C18 20 mm × 180 μm trapping column (5 μl/min at 99.9/0.1 v/v water/acetonitrile), after which the analytical separation was performed over a 90 minute gradient (flow rate of 400 nanoliters/minute) of 3 to 30% acetonitrile using a 1.7 μm Acquity BEH130 C18 75 μm × 250 mm column (Waters Corp.), with a column temperature of 55°C. MS1 (precursor ions) was performed at 70,000 resolution, with an AGC target of 1×10⁶ ions and a maximum injection time of 60 ms. MS2 spectra (product ions) were collected by data-dependent acquisition (DDA) of the top 20 most abundant precursor ions with a charge greater than 1 per MS1 scan, with dynamic exclusion enabled for a window of 30 seconds. Precursor ions were filtered with a 1.2 m/z isolation window and fragmented with a normalized collision energy of 30. MS2 scans were performed at 17,500 resolution, with an AGC target of 1×10⁵ ions and a maximum injection time of 60 ms.
Data processing for TMT proteomic experiment
Raw LC-MS/MS data were processed in Proteome discoverer v2.1 (PD2.1, Thermo Fisher Scientific), using both the Sequest HT and MS Amanda search engines. Data were searched against the UniProt rat complete proteome database of reviewed (Swiss-Prot) and unreviewed (TrEMBL) proteins, which consisted of 29,885 sequences on the date of download (12/29/2015). Default search parameters included oxidation (15.995 Da on M) as a variable modification and carbamidomethyl (57.021 Da on C) and TMTplex (229.163 Da on peptide N-term and K). Phospho runs added phosphorylation (79.966 Da on S,T,Y) as a variable modification. Data were searched with a 10 ppm precursor mass and 0.02 Da product ion tolerance. The maximum number of missed cleavages was set to 2 and enzyme specificity was trypsin (full). Considering each data type (phospho, input) separately, peptide spectral matches (PSMs) from each search algorithm were filtered to a 1% false discovery rate (FDR) using the Percolator node of PD2.1. For phospho data, site localization probabilities were determined for all modifications using the ptmRS algorithm. PSMs were grouped to unique peptides while maintaining a 1% FDR at the peptide level and using a 95% site localization threshold for phosphorylation. Peptides from all samples (phosho, input) were grouped to proteins together using the rules of strict parsimony and proteins were filtered to 1% FDR using the Protein FDR Validator node of PD2.1. Reporter ion intensities for all PSMs having co-isolation interference below 0.25 (25% of the ion current in the isolation window) and average reporter S/N>10 for all reporter ions were summed together at the peptide group and protein level, but keeping quantification for each data type (phosho, input) and experiment (BT2vvehicle, PPM1KvGFP) separate. Peptides shared between protein groups were excluded from protein quantitation calculations. See Table S1 for large-scale phosphopeptide and protein abundance measurements.
Statistical analysis for TMT proteomic experiment
Protein and peptide groups tabs in the PD2.1 results were exported as tab delimited.txt. files, opened in Microsoft EXCEL, and analyzed. First, peptide group reporter intensities for each peptide group in the input material were summed together for each TMT channel, each channel’s sum was divided by the average of all channels’ sums, resulting in channel-specific loading control normalization factors to correct for any deviation from equal protein/peptide input into the six sample comparison. Reporter intensities for peptide groups from the phospho fractions and for proteins from the input fraction were divided by the loading control normalization factors for each respective TMT channel. Analyzing the phosphopeptide and protein datasets separately, all loading control-normalized TMT reporter intensities were converted to log2 space, and the average value from the six samples was subtracted from each sample-specific measurement to normalize the relative measurements to the mean. For the BT2 vs. vehicle and the PPM1K vs. GFP comparisons (n=3), condition average, standard deviation, p-value (p, two-tailed student’s t-test, assuming equal variance), and adjustped p-value (Padjusted, Benjamini Hochberg FDR correction) were calculated. For protein-level quantification, only Master Proteins—or the most statistically significant protein representing a group of parsimonious proteins containing common peptides identified at 1% FDR—were used for quantitative comparison.
Fractionation
Mitochondrial and cytosolic fractions were isolated from liver samples by differential centrifugation as described, with modifications (DeBalsi et al., 2014). Tissues were homogenized in KMEM buffer (100 mM KCl, 50 mM MOPS, 1 mM EGTA, 5 mM MgSO4, 0.2% BSA) with a Teflon pestle and centrifuged at 500 × g to remove cell debris. The supernatants were then centrifuged at 9000 x g to pellet mitochondria. The supernatant containing cytosolic proteins was then transferred to a new tube and subjected to an additional three rounds of centrifugation at 9000 x g to ensure full removal of mitochondria from the fraction. The mitochondrial pellet was also resuspended and subjected to centrifugation at 9000 × g an additional two times. The pellet was then resuspended in 500 μl of KMEM and protein concentration of both fractions was assayed using a BCA kit.
Immunoblotting
Tissue lysates used for immunoblotting were prepared in Cell Lysis Buffer (Cell Signaling Technologies) containing protease inhibitor tablets (Roche), phosphatase inhibitor cocktails 2 and 3 (Sigma), and 10 mM PMSF. 50μg of protein was loaded onto a 4–12% Bis-Tris gel (Novex), subjected to SDS-PAGE, and then transferred onto PVDF membranes. Membranes were blocked and then probed with the appropriate antibodies. All primary antibodies were used at a concentration of 1:1000. Secondary antibodies were diluted 1:10000. All antibodies used are listed in the key resources table. Immunoblots were developed using a Li-Cor Odyssey CLx and quantified using the Li-Cor software.
Key resources table.
| REAGENT or RESOURCE | SOURCE | IDENTIFIER |
|---|---|---|
| Antibodies | ||
| pACL ser454/455 | Cell signaling technologies | CS43315 |
| ACL | Thermo Fisher | PA5-29495 |
| pAKT ser473 | Cell signaling technologies | 9271 |
| AKT | Cell signaling technologies | 9272 |
| PPM1K | Abcam | Ab135286 |
| GFP | Clontech | 632375 |
| BDK | Santa Cruz | sc374425 |
| V5 | Genetex | GTX-42525 |
| p-e1a BCKDH ser293 | Abcam | ab200577 |
| e1a BCKDH | Santa Cruz | sc-67200 |
| GAPDH | Sigma | G8795 |
| B-tubulin | Sigma | T5326 |
| ETFA | Abcam | ab110316 |
| COXIV | Li-Cor | 926-42214 |
| Bacterial and Virus Strains | ||
| Ad-CMV-BDK | In house | N/A |
| Ad-CMV-Bgal | In house | N/A |
| Ad-CMV-GFP | Vector Biolabs | 1060 |
| Ad-CMV-PPM1K | Vector Biolabs | ADV-219587 |
| Ad-CMV-ChREBP | In house | N/A |
| Ad-CMV-GFP (control for ChREBP) | In house | N/A |
| Ad-CMV-ΔMTS-BDK | In house | N/A |
| CMV-ΔMTS-BDK-GFP | In house | N/A |
| Chemicals, Peptides, and Recombinant Proteins | ||
| BT2, 3,6-Dichlorobenzo[β]thiophene-2-carboxylic acid | Sigma | Discontinued we have recently validated BT2 from Chem-Impex Int. INC Cat# 25643 |
| GST-tagged human ACL | Sigma | SRP0288 |
| 40 KDa subunit of bovine PKA | Promega | V5161 |
| Critical Commercial Assays | ||
| Rat Insulin ELISA | EMD Millipore | EZRMI-13K |
| V5-tagged protein purification Kit | MBL | 3317 |
| TransIT-293 Transfection Reagent | Mirus | MIR2700 |
| Image-IT Live Mito and Nuclear Labeling Kit | ThermoFisher | I34154 |
| Triglyceride | Abcam | Ab65336 |
| 6-plex Tandem Mass Tag Kit | ThermoFisher | 90061 |
| iScript cDNA synthesis kit | BioRad | 1708890 |
| TRI reagent | MRC | Tr118 |
| Deposited Data | ||
| Raw LC-MS/MS data | ProteomeXchange Consortium via Pride partner repository | PXD009122 |
| Experimental Models: Cell Lines | ||
| Fao hepatoma cells | Sigma | 85061112 |
| Hek293 cells | ATCC | CRL-1573 |
| Experimental Models: Organisms/Strains | ||
| Wistar rats | Charles River Laboratories | Strain:003 |
| Zucker Fatty Rats | Charles River Laboratories | Zuc-FA/Fa Strain:185 |
| Oligonucleotides | ||
| See Supplemental Table 2 | ||
| Recombinant DNA | ||
| Gateway pDONR223 BDK plasmid | DNASU | HsCd00511364 |
| Gateway pDONR223 ACL plasmid | DNASU | HsCd00399238 |
| pAd/CMV/V5-DEST Bgal plasmid | Thermolife | 49320 |
| Software and Algorithms | ||
| Proteome Discoverer v2.1 | ThermoFisher | |
| PhosphoSitePlus® | www.phosphosite.org | |
| PRIDE partner repository accession number | ProteomeXchange | PXD009122 |
Assays for incorporation of [γ-32P]-phosphoryl group into ACL
The phosphorylation reaction mixture in a total volume of 16 μl contained 20 mM Tris-Cl (pH 7.5), 100 mM KCl, 5 mM MgCl2, 2 mM DTT, 0.02% (v/v) Tween-20, and 0.1 mg/ml bovine serum albumin. To the reaction mixture, the following various combinations of recombinant proteins were added: 1 μg 147 kDa GST-tagged human ACL (Sigma), 2.6 μg BCKD E1 (an α2β2 heterotetramer), 1.5 μg BCKD E2, 0.3 μg 40 kDa catalytic subunit of bovine PKA (Promega) and 0.3 μg MBP-BDK (mature sequence only: amino acid residue 31-382) (Davie et al., 1995). Reaction mixtures without either kinase served as controls. [γ32P] ATP (200–300 cpm/pmol) was added to a final 300 μM concentration to initiate the kinase reaction. After incubation at room temperature for 10 min, the reaction was stopped by adding 4μl SDS-PAGE sample buffer, followed by a second incubation at 100°C for 5 min. The reaction products were analyzed by SDS gel electrophoresis in 12% acrylamide. Radioactivity on the gel was analyzed by exposing the gel on a storage phosphor plate overnight and scanning the autoradiograph in a Typhoon imager.
To confirm that BDK phosphorylates ACL on serine 454, a complementary phosphorylation assay was performed using combinations of freshly purified V5-tagged BDK, V5-tagged βgal, and V5-tagged ACL that were isolated from Fao hepatoma cell lysates that had been transfected with the respective adenoviruses as described above. V5 tagged proteins were purified from pooled Fao cell lysates using the V5- immunoprecipitation kit from MBP. Phosphorylation reactions were performed in 50 μl of reaction mixture containing 20 mM Tris-Cl (pH 8.0), 10 mM MgCl2, 10 mM glycerophosphate, 0.1mg/ml bovine serum albumin, and 10 mM ATP. The reaction was performed at room temperature for 10 minutes and was stopped by the addition of SDS-PAGE sample buffer, followed by incubation at 100°C for 5 minutes. Phosphorylation of ACL on serine 454 was detected by immunoblot.
2H2O label quantitation
Plasma 2H2O enrichment and total palmitic acid labeling in the liver was assayed as described (Jensen et al., 2012). Briefly, for plasma 2H2O labeling, 10 μl plasma or standard was mixed with 2 μl of a 10 M NaOH solution and 4 μl of acetone/acetonitrile solution (1/20, volume ratio). Samples were mixed gently and incubated overnight. The acetone was then extracted by adding 500 μl chloroform. The chloroform phase was dried by addition of ~50 mg NaSO4 salt, and then 100 μl of the chloroform layer underwent GC-MS analysis using an Agilent 5973N-MSD equipped with an Agilent 6890 GC system, and a DB-17MS capillary column (30 m × 0.25 mm × 0.25 μm). The mass spectrometer was operated in the electron impact mode (EI; 70 eV). The temperature program was as follows: 60°C initia l, increase by 20°C/min to 100°C, increase by 50°C/min to 220°C, and hold for 1 min. The sampl e was injected at a split ratio of 40:1 with a helium flow of 1 ml/min. Acetone eluted at 1.5 min. Selective ion monitoring of mass-to-charge ratios of 58 and 59 was performed using a dwell time of 10 ms/ion.
For total palmitic acid labeling in liver, 20 mg liver tissue was homogenized in 1 ml KOH/EtOH (EtOH 75%) and incubated at 85 °C for 3 hours. 200 μl of internal standard [13C-16]palmitate was added into samples after cooling. 100 μl of sample was acidified by addition of equal volume of 6 M HCl. Palmitic acid was extracted in 600 μl chloroform. The chloroform layer was completely dried by nitrogen gas and reacted with 50 μl N-methyl-N-trimethylsilylfluoroacetamide (TMS) at 70 °C for 30 minutes. TMS derivative was analyzed by GC-MS using an Agilent 5973N-MSD equipped with an Agilent 6890 GC system, and a DB-17MS capillary column (30 m × 0.25 mm × 0.25 μm). The mass spectrometer was operated in the electron impact mode (EI; 70 eV). The temperature program was as follows: 100°C initial, increase by 15°C/min to 295°C and hold for 8 min. T he sample was injected at a split ratio of 10:1 with a helium flow of 1 ml/min. Palmitate-TMS derivative eluted at 9.7 min. Mass scan from 100 to 600 was chosen in the method. The m/z at 313, 314, and 319 were extracted for M0, M1, and M16 palmitate quantitation.
Stable isotope labeling was corrected from the natural stable isotope distribution (Tomcik et al., 2011). Newly synthesized total palmitic acid was calculated as described (Jensen et al., 2012) as, % newly synthesized palmitic acid labeling = total palmitic acid labeling/(plasma 2H2O labeling × 22)×100.
Transcriptomic analyses by qPCR
For detection of human and rat PPM1K mRNA expression in the PPM1K study, RNA was extracted from liver tissue using an RNeasy kit from QIAGEN. RNA was reverse transcribed using the Bio-Rad iScript cDNA synthesis kit. qPCR was performed with Applied Biosystems TaqMan® gene expression assays for hPPM1K (Hs00410954_m1), rPPM1K (Rn01410038_m1), and rPPIA(Rn00690933_m1) on a Viia 7 Real-Time PCR system (Applied Biosystems). Each sample was run in duplicate and normalized to Ppia. For human, high fructose, and ChREBP overexpression studies, TRI reagent (MRC, catalog TR118) was used for RNA isolation. RNA was reverse transcribed using a SuperScript VILO kit (Invitrogen). Gene expression was analyzed with the ABI Prism sequence detection system (SYBR Green; Applied Biosystems). Gene-specific primers were synthesized by IDT. Each sample was run in duplicate, and normalized to Rplp0 RNA. Primers used are listed in Supplemental Table 2.
Quantification and statistical analysis
All data are expressed as mean ± SEM. Results from animal and cell studies were analyzed using a two-way Student’s t-test. Regression analysis of human qPCR data was performed with SPSS release 18.0.0. A p value less than 0.05 was considered statistically significant.
Data and software availability
Raw LC-MS/MS proteomics data have been deposited to the ProteomeXchange Consortium via the PRIDE partner repository (Vizcaino et al., 2016), see key resources table for project accession number. Table S1 contains the full proteomics datasets.
Supplementary Material
Supplemental Table 1. Full phosphopeptide and protein abundance measurements. Related to Figure 2 and STAR Methods.
Highlights.
Lowering the BDK:PPM1K ratio improves glucose and lipid homeostasis in obese rats
ATP-citrate lyase (ACL) is an alternate BDK/PPM1K substrate
Overexpression of BDK in liver increases ACL phosphorylation and de novo lipogenesis
The ChREBP-β transcription factor increases BDK and decreases PPM1K expression
Acknowledgments
The studies reported here were supported by NIH grants PO1-DK58398 (to C.B.N.), DK100425 (to M.A.H), DK083439 (to M.L.), DK62306, and DK92921 (to D.T.C.), as well as a grant from the Welch Foundation (to D.T.C.) and a Pathways Award from the American Diabetes Association 1-16-INI-17 (to P.J.W). A fellowship performed by A.L.L in the Newgard lab was supported by a sponsored research grant from Pfizer. The authors are grateful to Dr. J. Will Thompson and the Duke Proteomics and Metabolomics Shared Resource for assistance with the phosphoproteomics studies.
Footnotes
Author Contributions.
PJW, RWM, PAG, JH, ALL, ML, GZ, MAH, RMW, DTC, and CBN participated in study design. PJW, RWM, PAG, JH, ALL, SCT, WHY, TGL, JA, IA, SAH, TG, MA, LBO, ML, GZ, and OI carried out experiments. PJW, RWM, PAG, OI, MAH, RMW, DTC, and CBN analyzed data. PJW, RWM, PAG, JH, MAH, RMW, DTC, and CBN wrote and edited the manuscript.
Declaration of Interests.
C.B.N. is a member of the Lilly Global Diabetes Advisory Board.
References
- Berwick DC, Hers I, Heesom KJ, Moule SK, Tavare JM. The identification of ATP-citrate lyase as a protein kinase B (Akt) substrate in primary adipocytes. J Biol Chem. 2002;277:33895–33900. doi: 10.1074/jbc.M204681200. [DOI] [PubMed] [Google Scholar]
- Davie JR, Wynn RM, Meng M, Huang YS, Aalund G, Chuang DT, Lau KS. Expression and characterization of branched-chain alpha-ketoacid dehydrogenase kinase from the rat. Is it a histidine-protein kinase? J Biol Chem. 1995;270:19861–19867. doi: 10.1074/jbc.270.34.19861. [DOI] [PubMed] [Google Scholar]
- DeBalsi KL, Wong KE, Koves TR, Slentz DH, Seiler SE, Wittmann AH, Ilkayeva OR, Stevens RD, Perry CGR, Lark DS, et al. Targeted metabolomics connects thioredoxin-interacting protein (TXNIP) to mitochondrial fuel selection and regulation of specific oxidoreductase enzymes in skeletal muscle. J Biol Chem. 2014;289:8106–8120. doi: 10.1074/jbc.M113.511535. [DOI] [PMC free article] [PubMed] [Google Scholar]
- Felig P, Marliss E, Cahill GF. Plasma amino acid levels and insulin secretion in obesity. N Engl J Med. 1969;281:811–816. doi: 10.1056/NEJM196910092811503. [DOI] [PubMed] [Google Scholar]
- Ferrara CT, Wang P, Neto EC, Stevens RD, Bain JR, Wenner BR, Ilkayeva OR, Keller MP, Blasiole DA, Kendziorski C, et al. Genetic networks of liver metabolism revealed by integration of metabolic and transcriptional profiling. PLoS Genet. 2008;4:e1000034. doi: 10.1371/journal.pgen.1000034. [DOI] [PMC free article] [PubMed] [Google Scholar]
- Fontana L, Cummings NE, Arriola Apelo SI, Neuman JC, Kasza I, Schmidt BA, Cava E, Spelta F, Tosti V, Syed FA, et al. Decreased Consumption of Branched-Chain Amino Acids Improves Metabolic Health. Cell Rep. 2016;16:520–530. doi: 10.1016/j.celrep.2016.05.092. [DOI] [PMC free article] [PubMed] [Google Scholar]
- Glynn EL, Piner LW, Huffman KM, Slentz CA, Elliot-Penry L, AbouAssi H, White PJ, Bain JR, Muehlbauer MJ, Ilkayeva OR, et al. Impact of combined resistance and aerobic exercise training on branched-chain amino acid turnover, glycine metabolism and insulin sensitivity in overweight humans. Diabetologia. 2015;58:2324–2335. doi: 10.1007/s00125-015-3705-6. [DOI] [PMC free article] [PubMed] [Google Scholar]
- Grimsrud PA, Carson JJ, Hebert AS, Hubler SL, Niemi NM, Bailey DJ, Jochem A, Stapleton DS, Keller MP, Westphall MS, et al. A quantitative map of the liver mitochondrial phosphoproteome reveals posttranslational control of ketogenesis. Cell Metab. 2012;16:672–683. doi: 10.1016/j.cmet.2012.10.004. [DOI] [PMC free article] [PubMed] [Google Scholar]
- Haystead TA, Hardie DG. Insulin and phorbol ester stimulate phosphorylation of acetyl-CoA carboxylase at similar sites in isolated adipocytes. Lack of correspondence with sites phosphorylated on the purified enzyme by protein kinase C. Eur J Biochem. 1988;175:339–345. doi: 10.1111/j.1432-1033.1988.tb14202.x. [DOI] [PubMed] [Google Scholar]
- Haystead TA, Campbell DG, Hardie DG. Analysis of sites phosphorylated on acetyl-CoA carboxylase in response to insulin in isolated adipocytes. Comparison with sites phosphorylated by casein kinase-2 and the calmodulin-dependent multiprotein kinase. Eur J Biochem. 1988;175:347–354. doi: 10.1111/j.1432-1033.1988.tb14203.x. [DOI] [PubMed] [Google Scholar]
- Herman MA, She P, Peroni OD, Lynch CJ, Kahn BB. Adipose tissue branched chain amino acid (BCAA) metabolism modulates circulating BCAA levels. J Biol Chem. 2010;285:11348–11356. doi: 10.1074/jbc.M109.075184. [DOI] [PMC free article] [PubMed] [Google Scholar]
- Herman MA, Peroni OD, Villoria J, Schön MR, Abumrad NA, Blüher M, Klein S, Kahn BB. A novel ChREBP isoform in adipose tissue regulates systemic glucose metabolism. Nature. 2012;484:333–338. doi: 10.1038/nature10986. [DOI] [PMC free article] [PubMed] [Google Scholar]
- Hornbeck PV, Zhang B, Murray B, Kornhauser JM, Latham V, Skrzypek E. PhosphoSitePlus, 2014: mutations, PTMs and recalibrations. Nucleic Acids Res. 2015;43:D512–D520. doi: 10.1093/nar/gku1267. [DOI] [PMC free article] [PubMed] [Google Scholar]
- Hsiao G, Chapman J, Ofrecio JM, Wilkes J, Resnik JL, Thapar D, Subramaniam S, Sears DD. Multi-tissue, selective PPARγ modulation of insulin sensitivity and metabolic pathways in obese rats. Am J Physiol Endocrinol Metab. 2011;300:E164–74. doi: 10.1152/ajpendo.00219.2010. [DOI] [PMC free article] [PubMed] [Google Scholar]
- Iizuka K, Bruick RK, Liang G, Horton JD, Uyeda K. From The Cover: Deficiency of carbohydrate response element-binding protein (ChREBP) reduces lipogenesis as well as glycolysis. Proc Natl Acad Sci. 2004;101:7281–7286. doi: 10.1073/pnas.0401516101. [DOI] [PMC free article] [PubMed] [Google Scholar]
- Jensen KK, Previs SF, Zhu L, Herath K, Wang SP, Bhat G, Hu G, Miller PL, McLaren DG, Shin MK, et al. Demonstration of diet-induced decoupling of fatty acid and cholesterol synthesis by combining gene expression array and 2H2O quantification. AJP Endocrinol Metab. 2012;302:E209–E217. doi: 10.1152/ajpendo.00436.2011. [DOI] [PubMed] [Google Scholar]
- Jensen MV, Haldeman JM, Zhang H, Lu D, Huising MO, Vale WW, Hohmeier HE, Rosenberg P, Newgard CB. Control of Voltage-gated Potassium Channel Kv2.2 Expression by Pyruvate-Isocitrate Cycling Regulates Glucose-stimulated Insulin Secretion. J Biol Chem. 2013;288:23128–23140. doi: 10.1074/jbc.M113.491654. [DOI] [PMC free article] [PubMed] [Google Scholar]
- Jeong YS, Kim D, Lee YS, Kim HJ, Han JY, Im SS, Chong HK, Kwon JK, Cho YH, Kim WK, et al. Integrated expression profiling and genome-wide analysis of ChREBP targets reveals the dual role for ChREBP in glucose-regulated gene expression. PLoS One. 2011;6:e22544. doi: 10.1371/journal.pone.0022544. [DOI] [PMC free article] [PubMed] [Google Scholar]
- Joshi MA, Jeoung NH, Obayashi M, Hattab EM, Brocken EG, Liechty EA, Kubek MJ, Vattem KM, Wek RC, Harris RA. Impaired growth and neurological abnormalities in branched-chain α-keto acid dehydrogenase kinase-deficient mice. Biochem J. 2006;400:153–162. doi: 10.1042/BJ20060869. [DOI] [PMC free article] [PubMed] [Google Scholar]
- Kim MS, Krawczyk SA, Doridot L, Fowler AJ, Wang JX, Trauger SA, Noh HL, Kang HJ, Meissen JK, Blatnik M, et al. ChREBP regulates fructose-induced glucose production independently of insulin signaling. J Clin Invest. 2016;126:4372–4386. doi: 10.1172/JCI81993. [DOI] [PMC free article] [PubMed] [Google Scholar]
- Lavine JA, Raess PW, Davis DB, Rabaglia ME, Presley BK, Keller MP, Beinfeld MC, Kopin AS, Newgard CB, Attie AD. Contamination with E1A-positive wild-type adenovirus accounts for species-specific stimulation of islet cell proliferation by CCK: a cautionary note. Mol Endocrinol. 2010;24:464–467. doi: 10.1210/me.2009-0384. [DOI] [PMC free article] [PubMed] [Google Scholar]
- Li S, Brown MS, Goldstein JL. Bifurcation of insulin signaling pathway in rat liver: mTORC1 required for stimulation of lipogenesis, but not inhibition of gluconeogenesis. Proc Natl Acad Sci. 2010;107:3441–3446. doi: 10.1073/pnas.0914798107. [DOI] [PMC free article] [PubMed] [Google Scholar]
- Lian K, Du C, Liu Y, Zhu D, Yan W, Zhang H, Hong Z, Liu P, Zhang L, Pei H, et al. Impaired adiponectin signaling contributes to disturbed catabolism of branched-chain amino acids in diabetic mice. Diabetes. 2015;64:49–59. doi: 10.2337/db14-0312. [DOI] [PubMed] [Google Scholar]
- Lin R, Tao R, Gao X, Li T, Zhou X, Guan KL, Xiong Y, Lei QY. Acetylation stabilizes ATP-citrate lyase to promote lipid biosynthesis and tumor growth. Mol Cell. 2013;51:506–518. doi: 10.1016/j.molcel.2013.07.002. [DOI] [PMC free article] [PubMed] [Google Scholar]
- Lotta LA, Scott RA, Sharp SJ, Burgess S, Luan J, Tillin T, Schmidt AF, Imamura F, Stewart ID, Perry JRB, et al. Genetic Predisposition to an Impaired Metabolism of the Branched-Chain Amino Acids and Risk of Type 2 Diabetes: A Mendelian Randomisation Analysis. PLoS Med. 2016;13:e1002179. doi: 10.1371/journal.pmed.1002179. [DOI] [PMC free article] [PubMed] [Google Scholar]
- Lu G, Sun H, She P, Youn JY, Warburton S, Ping P, Vondriska TM, Cai H, Lynch CJ, Wang Y. Protein phosphatase 2Cm is a critical regulator of branched-chain amino acid catabolism in mice and cultured cells. J Clin Invest. 2009;119:1678–1687. doi: 10.1172/JCI38151. [DOI] [PMC free article] [PubMed] [Google Scholar]
- Mahendran Y, Jonsson A, Have CT, Allin KH, Witte DR, Jørgensen ME, Grarup N, Pedersen O, Kilpeläinen TO, Hansen T. Genetic evidence of a causal effect of insulin resistance on branched-chain amino acid levels. Diabetologia. 2017;60:873–878. doi: 10.1007/s00125-017-4222-6. [DOI] [PubMed] [Google Scholar]
- McGarry JD. Banting lecture 2001: dysregulation of fatty acid metabolism in the etiology of type 2 diabetes. Diabetes. 2002;51:7–18. doi: 10.2337/diabetes.51.1.7. [DOI] [PubMed] [Google Scholar]
- Munday MR, Campbell DG, Carling D, Hardie DG. Identification by amino acid sequencing of three major regulatory phosphorylation sites on rat acetyl-CoA carboxylase. Eur J Biochem. 1988;175:331–338. doi: 10.1111/j.1432-1033.1988.tb14201.x. [DOI] [PubMed] [Google Scholar]
- Newgard CB. Metabolomics and Metabolic Diseases: Where Do We Stand? Cell Metab. 2017;25:43–56. doi: 10.1016/j.cmet.2016.09.018. [DOI] [PMC free article] [PubMed] [Google Scholar]
- Newgard CB, An J, Bain JR, Muehlbauer MJ, Stevens RD, Lien LF, Haqq AM, Shah SH, Arlotto M, Slentz CA, et al. A branched-chain amino acid-related metabolic signature that differentiates obese and lean humans and contributes to insulin resistance. Cell Metab. 2009;9:311–326. doi: 10.1016/j.cmet.2009.02.002. [DOI] [PMC free article] [PubMed] [Google Scholar]
- Palmer ND, Stevens RD, Antinozzi PA, Anderson A, Bergman RN, Wagenknecht LE, Newgard CB, Bowden DW. Metabolomic Profile Associated With Insulin Resistance and Conversion to Diabetes in the Insulin Resistance Atherosclerosis Study. J Clin Endocrinol Metab. 2015;100:E463–E468. doi: 10.1210/jc.2014-2357. [DOI] [PMC free article] [PubMed] [Google Scholar]
- Pietiläinen KH, Naukkarinen J, Rissanen A, Saharinen J, Ellonen P, Keränen H, Suomalainen A, Götz A, Suortti T, Yki-Järvinen H, et al. Global Transcript Profiles of Fat in Monozygotic Twins Discordant for BMI: Pathways behind Acquired Obesity. PLoS Med. 2008;5:e51. doi: 10.1371/journal.pmed.0050051. [DOI] [PMC free article] [PubMed] [Google Scholar]
- Pinna LA, Ruzzene M. How do protein kinases recognize their substrates? Biochim Biophys Acta. 1996;1314:191–225. doi: 10.1016/s0167-4889(96)00083-3. [DOI] [PubMed] [Google Scholar]
- Popov KM, Zhao Y, Shimomura Y, Kuntz MJ, Harris RA. Branched-chain alpha-ketoacid dehydrogenase kinase. Molecular cloning, expression, and sequence similarity with histidine protein kinases. J Biol Chem. 1992;267:13127–13130. [PubMed] [Google Scholar]
- Potapova IA, El-Maghrabi MR, Doronin SV, Benjamin WB. Phosphorylation of Recombinant Human ATP:Citrate Lyase by cAMP-Dependent Protein Kinase Abolishes Homotropic Allosteric Regulation of the Enzyme by Citrate and Increases the Enzyme Activity. Allosteric Activation of ATP:Citrate Lyase by Phosphorylated Sugars. Biochemistry. 2000;39:1169–1179. doi: 10.1021/bi992159y. [DOI] [PubMed] [Google Scholar]
- Rauniyar N, Yates JR. Isobaric Labeling-Based Relative Quantification in Shotgun Proteomics. J Proteome Res. 2014;13:5293–5309. doi: 10.1021/pr500880b. [DOI] [PMC free article] [PubMed] [Google Scholar]
- Ronnebaum SM, Ilkayeva O, Burgess SC, Joseph JW, Lu D, Stevens RD, Becker TC, Sherry AD, Newgard CB, Jensen MV. A pyruvate cycling pathway involving cytosolic NADP-dependent isocitrate dehydrogenase regulates glucose-stimulated insulin secretion. J Biol Chem. 2006;281:30593–30602. doi: 10.1074/jbc.M511908200. [DOI] [PubMed] [Google Scholar]
- Des Rosiers C, Di Donato L, Comte B, Laplante A, Marcoux C, David F, Fernandez CA, Brunengraber H. Isotopomer analysis of citric acid cycle and gluconeogenesis in rat liver. Reversibility of isocitrate dehydrogenase and involvement of ATP-citrate lyase in gluconeogenesis. J Biol Chem. 1995;270:10027–10036. doi: 10.1074/jbc.270.17.10027. [DOI] [PubMed] [Google Scholar]
- Samuel VT, Shulman GI. Nonalcoholic Fatty Liver Disease as a Nexus of Metabolic and Hepatic Diseases. Cell Metab. 2017;27:22–41. doi: 10.1016/j.cmet.2017.08.002. [DOI] [PMC free article] [PubMed] [Google Scholar]
- Seiler CY, Park JG, Sharma A, Hunter P, Surapaneni P, Sedillo C, Field J, Algar R, Price A, Steel J, et al. DNASU plasmid and PSI:Biology-Materials repositories: resources to accelerate biological research. Nucleic Acids Res. 2014;42:D1253–D1260. doi: 10.1093/nar/gkt1060. [DOI] [PMC free article] [PubMed] [Google Scholar]
- Shah SH, Crosslin DR, Haynes CS, Nelson S, Turer CB, Stevens RD, Muehlbauer MJ, Wenner BR, Bain JR, Laferrère B, et al. Branched-chain amino acid levels are associated with improvement in insulin resistance with weight loss. Diabetologia. 2012;55:321–330. doi: 10.1007/s00125-011-2356-5. [DOI] [PMC free article] [PubMed] [Google Scholar]
- She P, Van Horn C, Reid T, Hutson SM, Cooney RN, Lynch CJ. Obesity-related elevations in plasma leucine are associated with alterations in enzymes involved in branched-chain amino acid metabolism. Am J Physiol Endocrinol Metab. 2007;293:E1552–63. doi: 10.1152/ajpendo.00134.2007. [DOI] [PMC free article] [PubMed] [Google Scholar]
- Shimomura Y, Nanaumi N, Suzuki M, Popov KM, Harris RA. Purification and partial characterization of branched-chain alpha-ketoacid dehydrogenase kinase from rat liver and rat heart. Arch Biochem Biophys. 1990;283:293–299. doi: 10.1016/0003-9861(90)90645-f. [DOI] [PubMed] [Google Scholar]
- Shin AC, Fasshauer M, Filatova N, Grundell LA, Zielinski E, Zhou JY, Scherer T, Lindtner C, White PJ, Lapworth AL, et al. Brain Insulin Lowers Circulating BCAA Levels by Inducing Hepatic BCAA Catabolism. Cell Metab. 2014;20:898–909. doi: 10.1016/j.cmet.2014.09.003. [DOI] [PMC free article] [PubMed] [Google Scholar]
- Titchenell PM, Quinn WJ, Lu M, Chu Q, Lu W, Li C, Chen H, Monks BR, Chen J, Rabinowitz JD, et al. Direct Hepatocyte Insulin Signaling Is Required for Lipogenesis but Is Dispensable for the Suppression of Glucose Production. Cell Metab. 2016;23:1154–1166. doi: 10.1016/j.cmet.2016.04.022. [DOI] [PMC free article] [PubMed] [Google Scholar]
- Tomcik K, Ibarra RA, Sadhukhan S, Han Y, Tochtrop GP, Zhang GF. Isotopomer enrichment assay for very short chain fatty acids and its metabolic applications. Anal Biochem. 2011;410:110–117. doi: 10.1016/j.ab.2010.11.030. [DOI] [PMC free article] [PubMed] [Google Scholar]
- Tso SC, Gui WJ, Wu CY, Chuang JL, Qi X, Skvora KJ, Dork K, Wallace AL, Morlock LK, Lee BH, et al. Benzothiophene carboxylate derivatives as novel allosteric inhibitors of branched-chain α-ketoacid dehydrogenase kinase. J Biol Chem. 2014;289:20583–20593. doi: 10.1074/jbc.M114.569251. [DOI] [PMC free article] [PubMed] [Google Scholar]
- Wang Q, Jiang L, Wang J, Li S, Yu Y, You J, Zeng R, Gao X, Rui L, Li W, et al. Abrogation of hepatic ATP-citrate lyase protects against fatty liver and ameliorates hyperglycemia in leptin receptor-deficient mice. Hepatology. 2009;49:1166–1175. doi: 10.1002/hep.22774. [DOI] [PubMed] [Google Scholar]
- Wang Q, Holmes MV, Davey Smith G, Ala-Korpela M. Genetic Support for a Causal Role of Insulin Resistance on Circulating Branched-Chain Amino Acids and Inflammation. Diabetes Care. 2017;40:1779–1786. doi: 10.2337/dc17-1642. [DOI] [PMC free article] [PubMed] [Google Scholar]
- Wang TJ, Larson MG, Vasan RS, Cheng S, Rhee EP, McCabe E, Lewis GD, Fox CS, Jacques PF, Fernandez C, et al. Metabolite profiles and the risk of developing diabetes. Nat Med. 2011;17:448–453. doi: 10.1038/nm.2307. [DOI] [PMC free article] [PubMed] [Google Scholar]
- White PJ, Lapworth AL, An J, Wang L, McGarrah RW, Stevens RD, Ilkayeva O, George T, Muehlbauer MJ, Bain JR, et al. Branched-chain amino acid restriction in Zucker-fatty rats improves muscle insulin sensitivity by enhancing efficiency of fatty acid oxidation and acyl-glycine export. Mol Metab. 2016;5:538–551. doi: 10.1016/j.molmet.2016.04.006. [DOI] [PMC free article] [PubMed] [Google Scholar]
- Winter D, Kugelstadt D, Seidler J, Kappes B, Lehmann WD. Protein phosphorylation influences proteolytic cleavage and kinase substrate properties exemplified by analysis of in vitro phosphorylated Plasmodium falciparum glideosome-associated protein 45 by nano-ultra performance liquid chromatography-tandem mass spectrometry. Anal Biochem. 2009;393:41–47. doi: 10.1016/j.ab.2009.06.022. [DOI] [PubMed] [Google Scholar]
Associated Data
This section collects any data citations, data availability statements, or supplementary materials included in this article.
Supplementary Materials
Supplemental Table 1. Full phosphopeptide and protein abundance measurements. Related to Figure 2 and STAR Methods.