Abstract
Nanospray Desorption Electrospray Ionization mass spectrometry imaging (nano-DESI MSI) enables ambient imaging of biological samples with high sensitivity and minimal sample pretreatment. Recently, we developed an approach for constant-distance mode MSI using shear force microscopy to precisely control the distance between the sample and the nano-DESI probe. Herein, we demonstrate the power of this approach for robust imaging of pancreatic islets with high spatial resolution of ~11 μm. Pancreatic islets are difficult to characterize using traditional mass spectrometry approaches due to their small size (~100 μm) and molecular heterogeneity. Nano-DESI MSI was used to examine the spatial localization of several lipid classes including phosphatidylcholine (PC), phosphatidylethanolamine (PE), sphingomyelin (SM), phosphatidylinositol (PI), and phosphatidylserine (PS) along with fatty acids and their metabolites (e.g. prostaglandins) in the individual islets and surrounding tissue. Several lipids were found to be substantially enhanced in the islets indicating these lipids may be involved in insulin secretion. Remarkably different distributions were observed for several pairs of Lyso PC (LPC) and PC species differing only by one double bond, such as LPC 18:1 vs LPC 18:0, PC 32:1 vs PC 32:0, and PC 34:2 vs PC 34:1. These findings indicate that minor variations in the fatty acid chain length and saturation have a pronounced effect on the localization of PC and LPC species in pancreatic islets. Interestingly, a small number of oxidized PC species observed experimentally were found to be specifically localized to pancreatic islets. These PCs are potential biomarkers for reactive oxygen species in the islets, which could be harmful to pancreatic beta cells. The experimental approach presented in this study will provide valuable information on the heterogeneity of individual pancreatic islets, which is difficult to assess using bulk characterization techniques.
Graphical Abstract
INTRODUCTION
Mass spectrometry imaging (MSI) enables spatial localization and identification of molecules in biological samples. In the past decade, MSI has emerged as a powerful analytical tool in clinical research and drug discovery.1–9 Matrix assisted laser desorption ionization (MALDI)5,10,11 and desorption electrospray ionization (DESI) 6–8 are the most widely used soft ionization techniques for tissue imaging. Although a majority of MSI studies have been performed with a moderate spatial resolution of ~50–150 μm, several groups have developed approaches for imaging with high spatial resolution.12 A record resolution of ~1.4 μm in MALDI-MSI has been achieved using an atmospheric pressure (AP) MALDI source, which provides histology-quality molecular images of numerous molecules in biological samples.13
DESI is an ambient ionization technique, which enables chemical analysis of biological samples in their native environment.14,15 DESI has been widely used for imaging of different types of tissues including brain, bladder, prostate, spinal cord, and kidney.6,8 The best spatial resolution of 35 μm has been achieved in DESI-MSI of mouse brain tissues.16 Similar to DESI, nanospray desorption electrospray ionization (nano-DESI) developed by our group enables analysis of biological samples with minimal sample pretreatment with high sensitivity and spatial resolution of better than 10 μm.17–19 Moreover, addition of selected standards to the nano-DESI solvent may be used to compensate for signal variations caused by matrix effects and perform accurate quantification of lipids and metabolites in complex samples.20–22 We recently introduced an approach for robust nano-DESI MSI with high spatial resolution by adding a shear force probe, which enables precise control of the distance between the sample and nano-DESI probe.19,23 Herein, we used this approach for imaging of pancreatic islets with high spatial resolution.
Pancreatic islets are clusters of endocrine cells comprising only a small percentage of the total volume of the pancreas that play an extremely important role in maintaining blood glucose homeostasis.24,25 The adult islet consists of several endocrine cell types, including alpha, beta, delta, and PP cells producing glucagon, insulin, somatostatin, and pancreatic polypeptide, respectively. Beta cells represent the major cell type in the islets and contribute to 50 – 70% and 60 – 80% of cells in human and mice islets, respectively.24–26 Beta cell dysfunction and/or defects in beta cell mass results in diabetes due to insufficient insulin secretion and a corresponding increase in blood glucose levels.27,28 Several studies demonstrated that phospholipase A2 (iPLA2) is involved in insulin secretion indicating the important role of lipid metabolism in this process.29–31 Lipidomics analyses of pancreatic islets have been performed to investigate the relationship between lipid composition and insulin secretion.32–34 These studies provided detailed information on the lipid composition and abundance but did not inform on the spatial distribution of lipids in individual islets. Furthermore, lipidomics approaches typically require pooling at least 100 islets for a single-point liquid chromatography tandem MS analysis, thereby masking heterogeneity within and between the individual islets. It follows that experimental approaches for molecular imaging and analysis of individual islets may provide unique insights into their function.
MSI of pancreatic islets is challenging due to their small size (an average diameter of ~100 Gm)25,26 and heterogeneity35, which necessitate imaging with close to cellular resolution. In this study, we employ the recently developed constant-distance nano-DESI MSI approach19,23 to obtain first insights into the localization of lipids and metabolites in both the pancreatic islets and surrounding exocrine tissue. This approach enables molecular imaging of individual pancreatic islets with a lateral resolution of ~11 μm. We demonstrate the specific localization of the phosphatidylcholine (PC), sphingomyelin (SM), and oxidized PC species in pancreatic islets, indicating these lipids could be involved in glucose-stimulated insulin secretion. Moreover, we observe the substantial variations in the abundance of Lyso PC (LPC) and PC species between individual islets, which cannot be revealed by traditional lipidomics approaches.
EXPERIMENTAL SECTION
Chemicals
LPC 19:0 (LPC19:0) and PC (16:0/9:0 (COOH)) were purchased from Avanti® Polar Lipids (Alabaster, AL). Arachidonic acid −5, 6, 8, 9, 11, 12, 14, 15-d8 (D8-arachidonic acid) was purchased from Sigma-Aldrich (St. Louis, MO). HPLC grade methanol was ordered from Fisher Scientific (Pittsburgh, PA).
Tissue Samples
Pancreas was harvested from one six-week old NOR/LtJ mouse (Jackson Labs) and fixed overnight in 4% paraformaldehyde (PFA) prepared in 1× Phosphate buffer saline (PBS). Fixed tissue was embedded in ice cold carboxymethyl cellulose compound, snap-frozen in liquid nitrogen and sectioned at 10 μm thickness. Tissue sections were stored at − 80°C prior to Nano-DESI MSI. We selected 14 sections containing pancreatic islets with a diameter of 50 – 200 Gm including two pairs of adjacent sections (islet #6 vs #11; #5 vs #12): 10 of the islets (#1 – 10) were used in positive and 4 islets (#11 – 14) in negative ion mode imaging, respectively. All the islets were located in the section using a Nikon Eclipse LV 150V optical microscope (Tokyo, Japan). Their optical images are shown in Figure S1.
Nano-DESI MSI
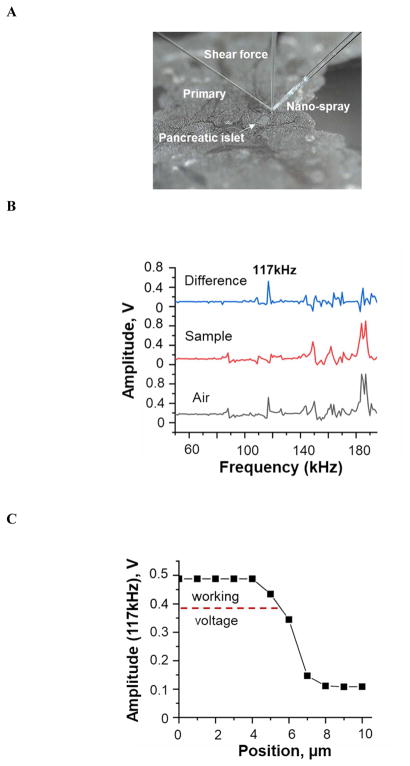
Nano-DESI MSI experiments were performed on an LTQ/Orbitrap mass spectrometer (Thermo Electron, Bremen, Germany) equipped with a custom-designed nano-DESI source. The nano-DESI probe was assembled using a primary capillary and nanospray capillary pulled to 15 – 25 μm OD, and positioned in front of the mass spectrometer inlet. The shear force probe was positioned less than 10 μm to the side and several micrometers below the nano-DESI probe. The capillaries were positioned individually using high-precision micro-positioners (Quater Research and Development, Bend, OR) and visualized using two Dino-Lite microscope cameras connected to a computer. A photograph of the nano-DESI probe is shown in Figure 1A. Detailed description of the capillaries comprising the nano-DESI probe and the shear force setup is provided in the next sections. A microscope glass slide containing thin tissue sections was mounted on a sample holder attached to a high-resolution motorized XYZ stage (Zaber Technologies, Vancouver, BC). The position of the sample holder was controlled by a custom Labview program developed at PNNL. Images were acquired in lines by a continuous motion of the stage in the x-direction at 5 μm/s and with spacing between the individual lines of 20 μm in the y-direction. In this work, the acquisition time for each islet was in a range of 20 – 35 minutes.
Figure 1.
A platform for high resolution imaging of pancreatic islets using a combination of nano-DESI MSI and shear force microscopy. (A) nano-DESI and shear force probes setup. (B) Excitation spectra acquired with the probe kept in air (Air, black trace), and positioned on the tissue surface (Sample, red trace). Blue trace (Difference) represents the difference spectrum between air and tissue surface. (C) Approach curve at 117.0 kHz was constructed by plotting amplitude of the shear-force probe vibration as a function of the distance between the sample and the probe.
Shear force microscopy was used for controlling the z coordinate of the stage in real time as described in detail in the next section. A 9:1 (v/v) methanol/water mixture containing 50 nM LPC 19:0 (an internal standard for positive mode experiments) or 300 nM D8-arachidonic acid (an internal standard for negative mode experiments) was infused using a syringe pump at 0.5 μL/min. Both positive and negative mode experiments were performed in this study. Mass spectra were acquired in the range of m/z 150 – 1000 with a mass resolution of m/Δm = 60 000 at m/z 412 as the sample was scanned under the nano-DESI probe. In positive mode, a high voltage of +3 kV was applied to the primary capillary. The heated capillary was held at 200 °C and 30 V. In negative mode, spraying voltage was set at −4 kV, and the heated capillary was held at 250 °C and 20 V. MS/MS experiments were further performed to assist identification of lipids and metabolites detected in mouse pancreatic islets. Collision-induced dissociation (CID) spectra were acquired using LTQ / Orbitrap with a mass resolution of 60,000 (m/Δm at m/z 412), mass isolation window of 1 amu, and CID energy of 10 – 20 manufacturer specified units.
Nano-DESI Probe
All the fused silica capillaries were purchased from Polymicro Technologies (L.L.C, Phoenix, AZ). To create the primary capillary, a fused silica capillary (70 Gm ID, 365 Gm OD) was pulled to a final OD of ~15 Gm using a P-2000 puller (Sutter instrument, Novato, CA). Pulling parameters: Line1, Heat 550, Fil 4, Vel 30, Del 130, Pull 30; Line2, Heat 650, Fil 4, Vel 30, Del 130, Pull 30; Line3, Heat 600, Fil 4, Vel 40, Del 130, Pull 30. To make the nanospray capillary, a fused silica capillary (50 Gm ID, 150 Gm OD) was heated over a candle fire, and pulled by hand to a final OD of ca. 25 Gm. The length of the nanospray capillary was around 2 cm.
Shear force probe
The shear force probe was produced by pulling a fused silica capillary (200 Gm ID, 790 Gm OD) to ~20 Gm OD. Pulling parameters: Line1, Heat 650, Fil 4, Vel 80, Del 130, Pull 60; Line2, Heat 650, Fil 4, Vel 50, Del 130, Pull 60. The shear-force probe was installed according to our previous method.23 Two piezoelectric ceramic plates (3.8 MHz, Steiner &Martins, Inc. Doral, FL) were attached to the shear force probe. The upper plate used to induce the probe oscillation was connected to a waveform generator (Agilent Technologies, Santa Clara, CA). The detection piezo was positioned closer to the sample and connected to a lock-in amplifier (Stanford Research Systems, Sunnyvale, CA) to detect the amplitude of the shear-force probe vibration. The signal from the shear force probe was converted by NI USB 6009 (National Instrument, Austin, TX), and then processed and synchronized with the high-resolution motorized XYZ stage (Zaber Technologies, Vancouver, BC) controlled with a custom-designed LabVIEW software.
Lipidomics analysis
Lipid composition in homogenized pancreatic islets of six-week old NOR/LtJ mice (Jackson Labs) was examined using liquid chromatography electrospray ionization tandem mass spectrometry (LC-ESI-MS/MS). Detailed description of these experiments can be found in the Supporting Information.
Data Analysis
Line scans acquired using Xcalibur software (Thermo Electron, Bremen, Germany) were subsequently processed and visualized with MSI QuickView developed at PNNL.18 Because automated gain control is turned on during data acquisition, the number of pixels could vary from line to line. In our experiments, acquisition time for each pixel ranged from 0.852 s to 0.867 s, with an average of 0.859 ± 0.0025s obtained by analyzing 900 pixels from 8 imaging data sets. This acquisition time corresponds to a pixel size of 4.30 ± 0.02 Gm along the x-axis. An alignment process was used to linearly interpolate between the points and generate data sets with a fixed number of pixels (1000 pixels) per line. Ion images were normalized to the signal of the standard (i.e. LPC 19:0 in positive mode and D8-arachidonic acid in negative mode). Detailed description of MSI QuickView can be found in our previous report.18
Region of interest (ROI) analyses were performed on the islets using MSI QuickView. Average mass spectra were obtained by integrating over the entire area of each islet. The intensities of LPC or PC normalized to LPC 19:0 were compared between individual islets. The normalized intensities of the abundant LPC and PC species were compiled in an Excel file, and correlation analysis of these lipids was performed using the Excel correlation function. In order to examine differences between the islets, we also performed one-way ANOVA and t-test analysis of the average spectra.
RESULTS AND DISCUSSION
Automated Control of the Sample-to-Probe Distance using Shear Force Microscopy
Precise control of the distance between the nano-DESI probe and sample is essential for the robust imaging with high spatial resolution. First nano-DESI MSI experiments of thin tissue sections used a three-point plane mode to correct for the sample tilt.18 In this mode, (x, y, z) coordinates of three points on the sample are used to define the tilt of the sample. Based on this information, the vertical position of the sample is automatically adjusted throughout the imaging experiment to maintain a constant distance between the sample and nano-DESI probe.18 Several pancreatic islets were imaged in this study using the three-point plane mode and a high resolution nano-DESI probe (15 – 25 Gm OD, see Experimental section). We found that it was difficult to obtain high-quality images due to either scratching or loss of contact between the probe and the sample during imaging experiments. These experiments demonstrated that although the three-point plane mode is well-suited for imaging of relatively flat tissue samples with moderate spatial resolution, it presents challenges for imaging with high spatial resolution. It follows that a more powerful constant-distance approach based on shear force microscopy feedback is necessary for robust imaging of mouse pancreatic islets.
Shear force microscopy experiments were performed using an approach described in our previous reports.19,23 First, an appropriate oscillation frequency was selected, at which the signal obtained from the shear force probe kept in air was substantially different from that on the tissue surface. Typical probe excitation spectra in the frequency range of 50 to 200 kHz are shown in Figure 1B. Black and red traces correspond to excitation spectra obtained when the shear force probe was kept in air and on the tissue surface, respectively. In addition, a difference spectrum (blue line) obtained by subtracting the signal acquired on the surface from that in the air is shown in Figure 1B. Because the maximum signal difference between sample and air was found at 117.0 kHz (Figure 1B), this frequency was selected for controlling the sample-to-probe distance. The approach curve was obtained by measuring the signal amplitude at 117.0 kHz while moving the sample towards the shear-force probe. The signal was stable when the probe was kept in the air (0 – 4 Gm, 0.49 V) or on the tissue surface (8 – 10 Gm, 0.11 V), while a gradual decrease in the signal amplitude was observed in the close proximity to the sample surface (4 – 8 Gm) (Figure 1C). During nano-DESI imaging experiments, the position of the sample was continuously adjusted using the selected working voltage as the feedback. In order to prevent the probe from crashing or losing contact with the samples, the working voltage was set at 80 % of its maximum value (0.39 V) with a tolerance of ± 0.05 V. We estimate that under these conditions the probe is positioned 1.0 ± 0.5 Gm above the sample surface. The same procedure was used to determine the working voltage before each imaging experiment.
Positive Mode Imaging of Mouse Pancreatic Islets
Typical positive mode single-pixel mass spectra of a mouse pancreatic islet (black trace) and surrounding exocrine tissue (red trace) obtained in high-resolution nano-DESI MSI experiments are shown in Figure 2. The single-pixel mass spectra are very similar to the average spectra in our experiments. Despite the small size of the sampling spot, which is discussed in more detail below, high signal-to-noise ratio obtained in these experiments allowed us to acquire good-quality images for 41 distinct compounds listed in Table S1. These compounds were identified using Lipid Maps (http://www.lipidmaps.org/tools/ms/lm_mass_form.php) and Metlin databases (https://metlin.scripps.edu/landing_page.php?pgcontent=advanced_search#) based on the accurate m/z and MS/MS data (Table S1 and Figure S3). The peak at m/z 560.3691 (Peak4) with a signal-to-noise ratio of about 80 in the spectrum of the islet (black trace) corresponds to [M+Na]+ ion of the LPC 19:0 standard added to the solvent. At least 39 phospholipids were identified in the islet (Table S1); nine most abundant phospholipids are labeled in Figure 2. These include four LPC species (LPC 16:0, LPC 18:2, LPC 18:1, and LPC 20:4) and five PC species (PC 34:2, PC 34:1, PC 36:4, PC 36:2, PC 38:4), for which the signal-to-noise ratios were in the range of 40–230. Our lipidomic data confirm that PC 34:1, PC 34:2, PC 38:4, PC 36:4, and PC 36:2 are the most abundant PC species in the pancreatic islets (Figure S4). Importantly, a majority of the PC species are substantially enhanced in the islet (black trace of Figure 2) compared with the surrounding tissue (red trace of Figure 2). We note that only sodium adducts of the detected lipids and metabolites are discussed in the main text, and their protonated and potassium adducts are shown in the Supporting Information.
Figure 2.
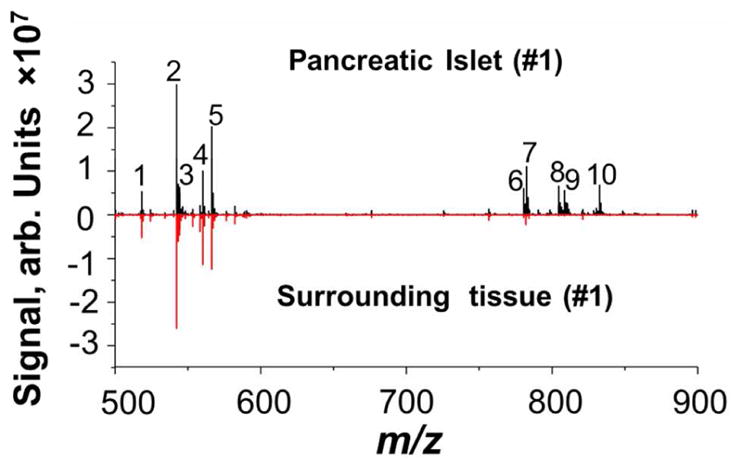
Single-scan positive mode nano-DESI spectrum acquired on the islet (black trace) and the surrounding tissue (red trace). Labeled peaks represents the [M+Na]+ ions of LPC 16:0 (1, m/z 518.3222), 18:2 (2, 542.3221), 18:1 (3, 544.3377), 19:0 (4, 560.3691, 50 nM, internal standard), 20:4 (5, 566.3221), PC 34:2 (6, 780.5526), 34:1 (7, 782.5682), 36:4 (8, 804.5524), 36:2 (9, 808.5839), and 38:4 (10, 832.5842).
Figure 3 shows representative line profiles of PC 36:2 (m/z 808.6) and PC 38:4 (m/z 832.6) acquired across one of the islets referred to as islet #1. We observe a dramatic 10- and 24- fold increase in the abundance of PC 36:2 and PC 38:4, respectively, in the islet as compared to surrounding exocrine tissue. We used the distance over which the signal intensity increases from 20% to 80% of the maximum value to estimate the upper limit of the spatial resolution as suggested by Luxembourg et al.36 Another line scan obtained for islet #1 and line scans obtained for other islets are shown in Figure S2. These data were used to calculate the average spatial resolution of 11 ± 2.9 Gm (n=10). We note that this value is an upper estimate of the experimental spatial resolution as it is based on the assumption that there is no gradient of lipid concentrations used in this estimation on the boundary between the islet and exocrine tissue.
Figure 3.
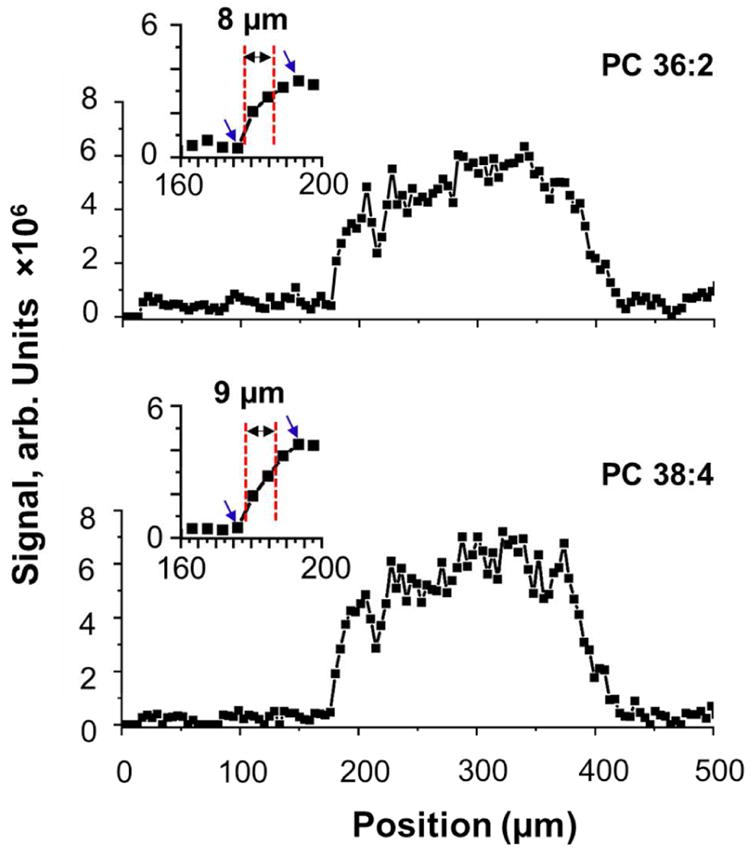
Representative line profile of PC 36:2 and PC 38:4 specifically located in pancreatic islet. Both are extracted from a line scan of islet #1. Blue arrows present the maximum (100 %) and minimum (0 %) values.
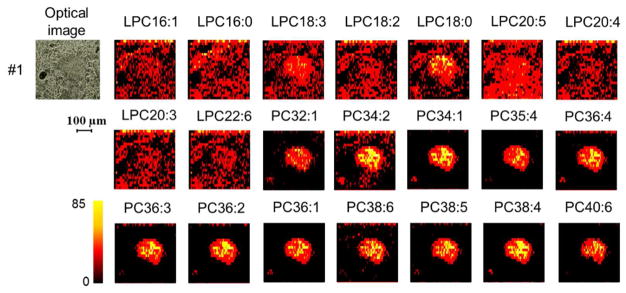
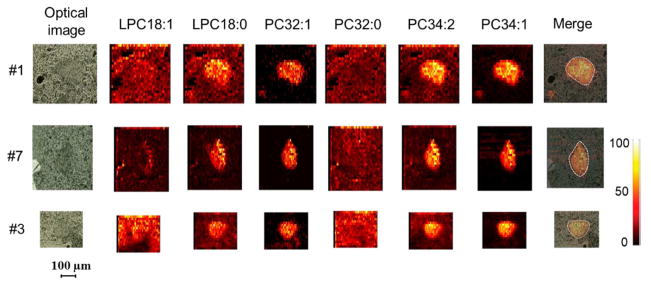
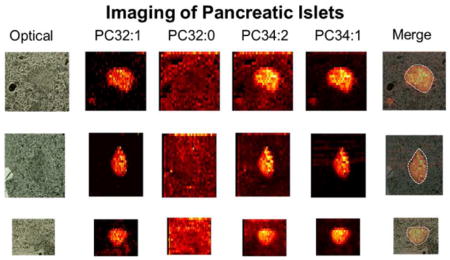
Ion images of several lipids and metabolites identified in islet #1 are shown in Figure 4 and Figure S5. Phospholipids are an abundant class of lipids in pancreatic islets (about 13.5 % of total lipids),37 and play an important role in the regulation of insulin secretion.31 In this study, we initially examined the spatial localization of PC and phosphatidylethanolamine (PE) species, the major classes of phospholipids, in the islet and surrounding tissue. Most of the identified LPC species including LPC 16:0, LPC 16:1, LPC 18:2, LPC 20:3, LPC 20:4, LPC 20:5, LPC 22:5, and LPC 22:6, are distributed uniformly in the islet and the surrounding tissue and only LPC 18:3 and LPC 18:0 are found to be substantially enhanced in the islet (Figure 4 and Figure S5). Meanwhile, the abundances of PC 32:1, PC 34:1, PC 34:2, PC 35:4, PC 36:1, PC 36:2, PC 36:3, PC 36:4, PC 38:4, PC 38:6, PC 40:5, and PC 40:6 are dramatically enhanced in the islet by at least a factor of 5 (Figure 4). Remarkably different distributions were observed for several pairs of LPC and PC species differing by only one double bond. These include LPC 18:1 vs LPC 18:0, PC 32:1 vs PC 32:0, and PC 34:2 vs PC 34:1 (Figure 5). Overlapping these distributions with the optical image of the analyzed tissue section (Figure 5) confirms that a majority of PC species are tightly localized to the islet. These results indicate that minor variations in the fatty acid chain length and saturation have a pronounced effect on the localization of PC and LPC species in pancreatic islets.
Figure 4.
Positive mode ion images of the LPC and PC species acquired over small regions (500*460 Gm2) of mouse pancreatic tissue. All the images were normalized to the abundance of the internal standard (LPC 19:0), and further modified to give a better visual representation by enhancing the contrast to display normalized abundances from 0 to 85%. The original images (0–100%) are shown in Figure S5A.
Figure 5.
Reproducibility of spatial distribution of typical LPC and PC species between individual islets. The merge images were obtained by overlapping the ion images of PC 34:1 with the optical images of the islets.
In order to assess the variability in lipid and metabolite distributions in different islets, we analyzed ten pancreatic islets in positive mode. Two representative data sets obtained for smaller islets (#3 and #7) are shown in Figure 5, and other data sets are shown in Figure S6 for comparison with islet #1. We observe similar enhancement of several PC species in pancreatic islets to that shown for islet #1 indicating excellent reproducibility between individual islets for the enhanced lipids. We also note that distributions of other LPC species were not as reproducible as those of the lipids enhanced in the islets. For an example, LPC 18:2 and LPC 20:4 are distributed uniformly in islet #1 and its surrounding tissue (Figure 4), but are depressed within the islet #8 (Figure S7). An interesting distribution for LPC 18:1 and PC 32:0 were observed in islets #4, 5, 7, 8, 9, and 10 (Figure S8). For these islets, LPC 18:1 and PC 32:0 are significantly enhanced ion the boundary of the islet indicating the contribution from a different type of cells (potentially alpha cells) in these samples.
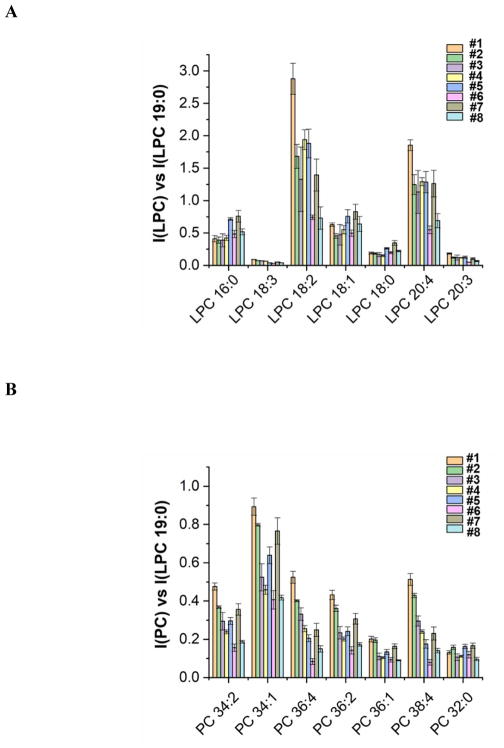
In order to evaluate the heterogeneity of individual pancreatic islets, which is difficult to assess using bulk characterization techniques, we analyzed our imaging data obtained for islets (#1 – 8) using the ROI analysis described in the experimental section. We found substantial variations in the abundance of LPC and PC species between the islets (Figure 6 and Table S2). For example, the normalized abundances of PC 36:4 in the islets range from 0.08 (islet #6) to 0.52 (islet #1) with an average of 0.28 ± 0.14 (RSD 50%). We observed that there are no significant differences in the abundances of these lipids in islets #2, 3, 4, 5, and 7 (one-way ANOVA, P=0.91). In contrast with the results obtained for islets #2, 3, 4, 5, and 7, the intensities of several lipids are substantially enhanced in islet #1, and suppressed in islets #6 and #8 (t-tests, P < 0.05, Figure 6). Table S3 summarizes the result of a correlation analysis of the relative abundances of different lipids present in these islets. LPC 18:2 was found to be closely and positively correlated with LPC 20:4 in pancreatic islets. There was also an excellent correlation between LPC16:0 vs LPC18:0, any two of LPC 20:4, PC 36:4, and LPC 38:4, and any two of PC 34:1, PC 34:2, PC 36:1, and PC 36:2. The observed correlation between LPC 20:4, PC 36:4, and PC 38:4 could be rationalized assuming that hydrolysis of PC 36:4 and 38:4 releases LPC 20:4. Alternatively, it may indicate that LPC 20:4 is efficiently converted into PC 36:4 and PC 38:4 in the islets. The correlation between other LPC and PC species needs to be further studied.
Figure 6.
Quantitative analysis of the islets using nano-DESI MSI. Normalized abundances of selected LPC and PC species in 8 pancreatic islets are presented in (A) and (B), respectively.
As described above, the lipidomics analysis of pooled pancreatic islets (shown in Figure S4) strongly supports the results of our imaging experiments. This analysis also was used for identifying fatty acid chains in PC species, which was impossible based on the nano-DESI MS/MS experiments, due to the low abundance of the fragments corresponding to losses of fatty acid chains. Based on comparison with LC-MS/MS, we assigned the most abundant PC species (PC 34:1, 36:4, 36:2, and 38:4) in the islets as PC (16:0_18:1), PC (16:0_20:4), PC (18:1_18:1), and PC (18:0_20:4). As an important substrate pool, PC species can be hydrolyzed by phospholipases A2 to produce LPC and free fatty acids30,38, some of which have intrinsic mediator functions in pancreatic islets.39–42 For example, arachidonic acid (FA 20:4), one of the well-known mediators that simulates insulin secretion from pancreatic beta cells39–41, can be released by phospholipases A2 from PC species containing arachidonate, such as PC (16:0_20:4) and (18:0_20:4).30 Abundant signal of FA 20:4 in the islet (Figure S9) also confirms the high activity of phospholipases A2. Collectively, our results demonstrate the specific localization of the PC species in pancreatic islets, which are known to be involved in glucose-stimulated insulin secretion.
In addition to abundant LPC and PC species, we observed seven Lyso PE (LPE) species in the islets (Figure S5). Only LPE 18:0 was slightly increased in the islet, while other LPE species were evenly distributed between the islet and surrounding tissue. Sphingomyelin (SM) was also investigated in this study. Unlike phospholipids, only SM d34:1 and SM d42:2 were detectable in the islets. Consistent with the lipidomics data (Figure S4), the intensity of SM d34:1 (m/z 725.5579) was ten times higher than that of SM d42:2 (m/z 835.6677), indicating that SM d34:1 is the most abundant sphingomyelin in the islet. The concentration of SM d34:1 is substantially increased in the islet (Figure S5 and S6). This finding is consistent with the previously reported data, according to which a decrease in SM d34:1 concentration in the islets is correlated with impaired insulin secretion.43
Moreover, several metabolites with m/z of less than 400 were identified in pancreatic islets, and their ion images are shown in Figure S5. For example, sodium adduct of creatine was detected in the islet, which corresponds to the peak at m/z 154.0587 (Figure S3). Creatine was evenly distributed between the islet and surrounding tissue (Figure S5). Another abundant peak at m/z 280.0919 is assigned to the [M+Na]+ ion of glycerylphosphorylcholine (GPC) based on the accurate mass and MS/MS data (Figure S3). We further show that the concentration of GPC in the islet is almost the same as that in the surrounding tissue (Figure S5). It is well-known that GPC is an important biosynthetic precursor of acetylcholine in the brain. Acetylcholine can also be produced in pancreatic islets,44 and is crucial for secretion of hormones including insulin and somatostatin in pancreatic islets.45 However, it is not clear whether GPC is involved in the synthesis of acetylcholine in the islets.
Negative Mode Imaging of Mouse Pancreatic Islets
Negative mode mass spectra acquired from pancreatic islets contain abundant peaks corresponding to [M-H]− ions of fatty acids (FA) including FA 16:1, FA 18:2, FA 18:1, FA 18:0, and FA 20:4 (Figure S9). This observation is consistent with the literature data according to which fatty acids represent about 21 % of total lipids in pancreatic islets.37 FA 16:1, FA 18:2, and FA 18:1 are evenly distributed in the islets and surrounding tissue, while abundances of FA 18:0 and FA 20:4 are slightly suppressed in the islets (Figure 7). Prostaglandin (PG) E2 and / or D2 also was detected in pancreatic islets (Figure 7). PGs are generated from arachidonic acid (FA 20:4) by the action of cyclooxygenase (COX) isoenzymes.41 PGE2 and PGD2 have very similar structures and therefore cannot be distinguished using MS/MS experiments (Figure S10). Horie et.al demonstrated that PGE2 and PGD2 are present at almost equal concentrations in pancreatic islets.46 Therefore, we conclude that the peak at m/z 349.2007 most likely corresponds to a mixture of PGE2 and PGD2. We also found the presence of other prostaglandins in the islets, including PGE3 or PGD3, PGG2, and 6-keto-PGF1 α (Figure S11). These prostaglandins not only mediate insulin secretion,39 but also play important roles in modulating the immune response.47
Figure 7.
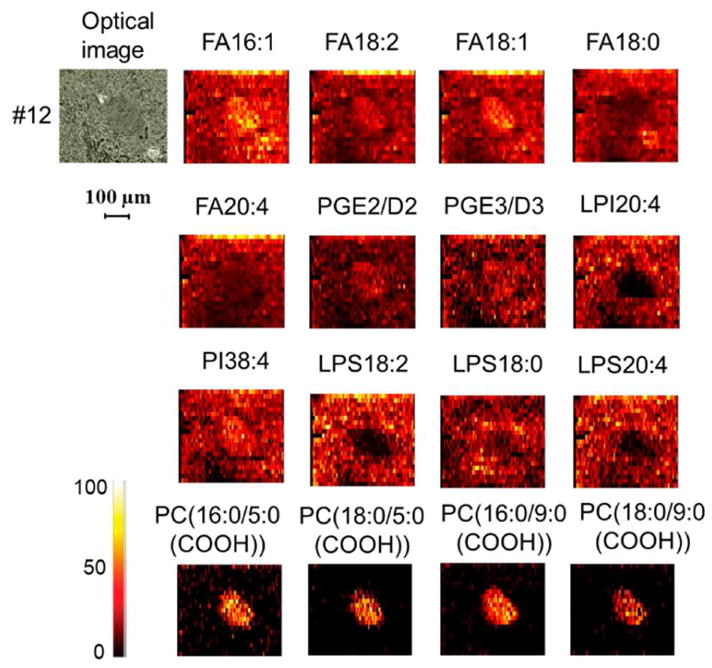
Negative mode nano-DESI imaging of a small region (500*420 Gm2) of mouse pancreatic tissue. All the images were normalized to the internal standard (D8-arachidonic acid).
Representative negative mode ion images of phospholipids are shown in Figure 7; selected MS/MS spectra are summarized in Figure S10. Phosphatidylinositol 38:4 (PI 38:4) identified based on the abundant neutral loss of inositol in the MS/MS spectrum (Figure S10) was observed to be uniformly distributed in the islet and surrounding tissue, while lysophosphoinositol 20:4 (LPI 20:4) was completely suppressed in the islet. Other PI species were not observed in the islets. Our data are consistent with the previous study, which showed PI 38:4 was the predominant PI species in the islets.32 Similarly, the concentrations of lysophosphatidylserine (LPS) 18:2, 18:0, and 20:4 in the islets were much lower than those in the surrounding tissue.
Surprisingly, we observed four types of oxidized PC in the islets using negative mode (Figure 7 and Figure S12), while only the most abundant one (PC 16:0/9:0 (COOH)) was detectable using positive mode (Figure S12). This assignment was confirmed by comparing MS/MS data obtained for endogenous PC 16:0/9:0 (COOH)) in pancreatic islets with the results obtained for the PC (16:0/9:0(COOH)) standard (Figure S10). Importantly, all the oxidized PC species are specifically localized to pancreatic islets #11 – 14 (Figure 7 and Figure S12). A similar localization of PC 16:0/9:0 (COOH) was observed in positive mode (Figure S12). It appears that it is easier to observe oxidized PC species in negative mode, which is likely due to the presence of a carboxyl group that is readily deprotonated in negative mode. The MS signal for 10 GM PC (16:0/9:0(COOH)) in negative mode is two times as high as that in positive mode (Figure S13). Therefore, it is reasonable that we observed four oxidized PCs in pancreatic islets using negative mode, while only one was detected in positive mode.
As discussed earlier, many factors are involved in the process of insulin secretion, such as phospholipid hydrolysis,31 cholinergic signaling,45 etc. Among them, mitochondrial respiration is an essential factor that directly drives insulin secretion in beta cells.48,49 High level of blood glucose activates mitochondrial function to quickly produce amounts of ATP necessary to support insulin release from beta cells.49 Meanwhile, electron transfer in the mitochondria generates reactive oxygen species (ROS).50 Subsequent phospholipid oxidation by ROS may be used to rationalize abundant oxidized PCs observed in pancreatic islets. Normally, ROS are rapidly eliminated through cell defense systems. However, obesity and hyperglycemia often increase the rates of the mitochondrial ROS production, which could induce mitochondrial dysfunction and beta cell failure via severe oxidation of mitochondrial membrane phospholipids.50 It follows that oxidized PCs are potential biomarkers for the production of ROS in pancreatic islets.
CONCLUSIONS
In this study, we used the constant-distance nano-DESI imaging approach to examine lipid and metabolite signatures of pancreatic islets and surrounding exocrine tissue with high spatial resolution (~11 Gm). We found that the concentrations of several LPC and PC species including LPC 18:0, LPC 18:3, PC 32:1, PC 34:1, PC 34:2, PC 36:1, PC 36:2, PC 36:3, PC 36:4, PC 38:4, and PC 38:5 are substantially enhanced in the islets. Meanwhile, other species including LPC 16:0, LPC 16:1, LPC 18:1, LPC 18:2, LPC 20:3, LPC 20:4, LPC 20:5, and PC 32:0 are distributed uniformly between the islet and surrounding tissue or depressed in the islets. These results demonstrate minor variations in the fatty acid chain length and saturation have a pronounced effect on the localization of PC and LPC species in pancreatic islets. In addition, the spatial distribution of oxidized PC, PE, PI, PS, fatty acids, and their metabolites in the islets are investigated using negative mode nano-DESI MSI. Interestingly, we observed that the oxidized PC species are specifically localized to the islets. As byproducts of mitochondrial ROS production, the oxidized PC species could be good biomarkers for monitoring the production of ROS in pancreatic islets. Nano-DESI MSI also confirms the presence of arachidonic acid and its metabolites (such as prostaglandins) in pancreatic islets, which are known mediators that stimulate insulin secretion.
Supplementary Material
Acknowledgments
This work was supported by grant UC4DK108101 from the National Institute of Health (NIDDK)—Human Islet Research Network. A portion of the research was performed at the Environmental Molecular Sciences Laboratory (EMSL), a national scientific user facility sponsored by the Department of Energy’s Office of Biological and Environmental Research and located at PNNL.
Footnotes
Notes
The authors declare no competing financial interest.
ASSOCIATED CONTENT
Supporting Information is available free of charge on the ACS Publications website.
Detailed sample information.
Additional support to the assignments of lipids.
Multiple ion image sets.
References
- 1.Norris JL, Caprioli RM. Chem Rev. 2013;113:2309–2342. doi: 10.1021/cr3004295. [DOI] [PMC free article] [PubMed] [Google Scholar]
- 2.Vaysse PM, Heeren R, Porta T, Balluff B. Analyst. 2017;142:2690–2712. doi: 10.1039/c7an00565b. [DOI] [PubMed] [Google Scholar]
- 3.Rubakhin SS, Jurchen JC, Monroe EB, Sweedler JV. Drug Discov Today. 2005;10:823–837. doi: 10.1016/S1359-6446(05)03458-6. [DOI] [PubMed] [Google Scholar]
- 4.Bodzon-Kulakowska A, Suder P. Mass Spectrom Rev. 2016;35:147–169. doi: 10.1002/mas.21468. [DOI] [PubMed] [Google Scholar]
- 5.Aichler M, Walch A. Lab Invest. 2015;95:422–431. doi: 10.1038/labinvest.2014.156. [DOI] [PubMed] [Google Scholar]
- 6.Wu C, Dill AL, Eberlin LS, Cooks RG, Ifa DR. Mass Spectrom Rev. 2013;32:218–243. doi: 10.1002/mas.21360. [DOI] [PMC free article] [PubMed] [Google Scholar]
- 7.Ifa DR, Eberlin LS. Clin Chem. 2016;62:111–123. doi: 10.1373/clinchem.2014.237172. [DOI] [PMC free article] [PubMed] [Google Scholar]
- 8.Laskin J, Lanekoff I. Anal Chem. 2015;88:52–73. doi: 10.1021/acs.analchem.5b04188. [DOI] [PMC free article] [PubMed] [Google Scholar]
- 9.Greer T, Sturm R, Li L. J Proteomics. 2011;74:2617–2631. doi: 10.1016/j.jprot.2011.03.032. [DOI] [PMC free article] [PubMed] [Google Scholar]
- 10.Cornett DS, Reyzer ML, Chaurand P, Caprioli RM. Nat Methods. 2007;4:828–33. doi: 10.1038/nmeth1094. [DOI] [PubMed] [Google Scholar]
- 11.Chughtai K, Heeren RM. Chem Rev. 2010;110:3237–3277. doi: 10.1021/cr100012c. [DOI] [PMC free article] [PubMed] [Google Scholar]
- 12.Rompp A, Spengler B. Histochem Cell Biol. 2013;139:759–783. doi: 10.1007/s00418-013-1097-6. [DOI] [PMC free article] [PubMed] [Google Scholar]
- 13.Kompauer M, Heiles S, Spengler B. Nat Methods. 2017;14:90–96. doi: 10.1038/nmeth.4071. [DOI] [PubMed] [Google Scholar]
- 14.Takats Z, Wiseman JM, Gologan B, Cooks RG. Science. 2004;306:471–473. doi: 10.1126/science.1104404. [DOI] [PubMed] [Google Scholar]
- 15.Takats Z, Wiseman JM, Cooks RG. J Mass Spectrom. 2005;40:1261–1275. doi: 10.1002/jms.922. [DOI] [PubMed] [Google Scholar]
- 16.Campbell DI, Ferreira CR, Eberlin LS, Cooks RG. Anal Bioanal Chem. 2012;404:389–398. doi: 10.1007/s00216-012-6173-6. [DOI] [PubMed] [Google Scholar]
- 17.Laskin J, Heath BS, Roach PJ, Cazares L, Semmes OJ. Anal Chem. 2011;84:141–148. doi: 10.1021/ac2021322. [DOI] [PMC free article] [PubMed] [Google Scholar]
- 18.Lanekoff I, Heath BS, Liyu A, Thomas M, Carson JP, Laskin J. Anal Chem. 2012;84:8351–8356. doi: 10.1021/ac301909a. [DOI] [PubMed] [Google Scholar]
- 19.Nguyen SN, Sontag RL, Carson JP, Corley RA, Ansong C, Laskin J. J Am Soc Mass Spectrom. 2017:1–7. doi: 10.1007/s13361-017-1750-8. [DOI] [PMC free article] [PubMed] [Google Scholar]
- 20.Lanekoff I, Stevens SL, Stenzel-Poore MP, Laskin J. Analyst. 2014;139:3528–3532. doi: 10.1039/c4an00504j. [DOI] [PMC free article] [PubMed] [Google Scholar]
- 21.Lanekoff I, Thomas M, Laskin J. Anal Chem. 2014;86:1872–1880. doi: 10.1021/ac403931r. [DOI] [PubMed] [Google Scholar]
- 22.Bergman HM, Lundin E, Andersson M, Lanekoff I. Analyst. 2016;141:3686–3695. doi: 10.1039/c5an02620b. [DOI] [PubMed] [Google Scholar]
- 23.Nguyen SN, Liyu AV, Chu RK, Anderton CR, Laskin J. Anal Chem. 2016;89:1131–1137. doi: 10.1021/acs.analchem.6b03293. [DOI] [PubMed] [Google Scholar]
- 24.Dolenšek J, Rupnik MS, Stožer A. Islets. 2015;7:e1024405. doi: 10.1080/19382014.2015.1024405. [DOI] [PMC free article] [PubMed] [Google Scholar]
- 25.Ionescu-Tirgoviste C, Gagniuc PA, Gubceac E, Mardare L, Popescu I, Dima S, Militaru M. Sci Rep. 2015;5:14634. doi: 10.1038/srep14634. [DOI] [PMC free article] [PubMed] [Google Scholar]
- 26.Kim A, Miller K, Jo J, Kilimnik G, Wojcik P, Hara M. Islets. 2009;1:129–136. doi: 10.4161/isl.1.2.9480. [DOI] [PMC free article] [PubMed] [Google Scholar]
- 27.Rorsman P, Braun M. Annu Rev Physiol. 2013;75:155–179. doi: 10.1146/annurev-physiol-030212-183754. [DOI] [PubMed] [Google Scholar]
- 28.Meier JJ, Bonadonna RC. Diabetes Care. 2013;36:S113–S119. doi: 10.2337/dcS13-2008. [DOI] [PMC free article] [PubMed] [Google Scholar]
- 29.Bao S, Song H, Wohltmann M, Ramanadham S, Jin W, Bohrer A, Turk J. J Biol Chem. 2006;281:20958–20973. doi: 10.1074/jbc.M600075200. [DOI] [PMC free article] [PubMed] [Google Scholar]
- 30.Bao S, Jacobson DA, Wohltmann M, Bohrer A, Jin W, Philipson LH, Turk J. Am J Physiol Endocrinol Metab. 2008;294:E217–E229. doi: 10.1152/ajpendo.00474.2007. [DOI] [PMC free article] [PubMed] [Google Scholar]
- 31.Poitout V. Am J Physiol Endocrinol Metab. 2008;294:E214–E216. doi: 10.1152/ajpendo.00638.2007. [DOI] [PMC free article] [PubMed] [Google Scholar]
- 32.Ramanadham S, Hsu FF, Bohrer A, Nowatzke W, Ma Z, Turk J. Biochemistry. 1998;37:4553–4567. doi: 10.1021/bi9722507. [DOI] [PubMed] [Google Scholar]
- 33.Ramanadham S, Hsu FF, Zhang S, Bohrer A, Ma Z, Turk J. Biochim Biophys Acta. 2000;1484:251–266. doi: 10.1016/s1388-1981(00)00022-6. [DOI] [PubMed] [Google Scholar]
- 34.Pearson GL, Mellett N, Chu KY, Boslem E, Meikle PJ, Biden TJ. Mol Metab. 2016;5:404–414. doi: 10.1016/j.molmet.2016.04.003. [DOI] [PMC free article] [PubMed] [Google Scholar]
- 35.Benninger RK, Piston DW. Trends Endocrinol Metab. 2014;25:399–406. doi: 10.1016/j.tem.2014.02.005. [DOI] [PMC free article] [PubMed] [Google Scholar]
- 36.Luxembourg SL, Mize TH, McDonnell LA, Heeren RM. Anal Chem. 2004;76:5339–5344. doi: 10.1021/ac049692q. [DOI] [PubMed] [Google Scholar]
- 37.Díaz GB, Cortizo AM, Garciía ME, Gagliardino JJ. Lipids. 1988;23:1125–1128. doi: 10.1007/BF02535277. [DOI] [PubMed] [Google Scholar]
- 38.Borgström B. Lipids. 1993;28:371–375. doi: 10.1007/BF02535932. [DOI] [PubMed] [Google Scholar]
- 39.Turk J, Wolf BA, McDaniel ML. Prog Lipid Res. 1987;26:125–181. doi: 10.1016/0163-7827(87)90010-5. [DOI] [PubMed] [Google Scholar]
- 40.Keane D, Newsholme P. Biochem Soc Trans. 2008;36:955–8. doi: 10.1042/BST0360955. [DOI] [PubMed] [Google Scholar]
- 41.Persaud SJ, Muller D, Belin VD, Kitsou-Mylona I, Asare-Anane H, Papadimitriou A, Burns CJ, Huang GC, Amiel SA, Jones PM. Diabetes. 2007;56:197–203. doi: 10.2337/db06-0490. [DOI] [PubMed] [Google Scholar]
- 42.Radu CG, Yang LV, Riedinger M, Au M, Witte ON. Proc Natl Acad Sci. 2004;101:245–250. doi: 10.1073/pnas.2536801100. [DOI] [PMC free article] [PubMed] [Google Scholar]
- 43.Yano M, Watanabe K, Yamamoto T, Ikeda K, Senokuchi T, Lu M, Kadomatsu T, Tsukano H, Ikawa M, Okabe M. J Biol Chem. 2011;286:3992–4002. doi: 10.1074/jbc.M110.179176. [DOI] [PMC free article] [PubMed] [Google Scholar]
- 44.Rodriguez-Diaz R, Dando R, Jacques-Silva MC, Fachado A, Molina J, Abdulreda MH, Ricordi C, Roper SD, Berggren PO, Caicedo A. Nat Med. 2011;17:888–892. doi: 10.1038/nm.2371. [DOI] [PMC free article] [PubMed] [Google Scholar]
- 45.Molina J, Rodriguez-Diaz R, Fachado A, Jacques-Silva MC, Berggren PO, Caicedo A. Diabetes. 2014;63:2714–26. doi: 10.2337/db13-1371. [DOI] [PMC free article] [PubMed] [Google Scholar]
- 46.Horie H, Narumiya S, Matsuyama T, Nonaka K, Tarui S. Prostaglandins Leukot Med. 1984;16:39–44. doi: 10.1016/0262-1746(84)90084-2. [DOI] [PubMed] [Google Scholar]
- 47.Ricciotti E, FitzGerald GA. Arterioscler Thromb Vasc Biol. 2011;31:986–1000. doi: 10.1161/ATVBAHA.110.207449. [DOI] [PMC free article] [PubMed] [Google Scholar]
- 48.Malmgren S, Nicholls DG, Taneera J, Bacos K, Koeck T, Tamaddon A, Wibom R, Groop L, Ling C, Mulder H. J Biol Chem. 2009;284:32395–32404. doi: 10.1074/jbc.M109.026708. [DOI] [PMC free article] [PubMed] [Google Scholar]
- 49.Jitrapakdee S, Wutthisathapornchai A, Wallace J, MacDonald M. Diabetologia. 2010;53:1019–1032. doi: 10.1007/s00125-010-1685-0. [DOI] [PMC free article] [PubMed] [Google Scholar]
- 50.Ma ZA, Zhao Z, Turk J. Exp Diabetes Res. 2012;2012:703538. doi: 10.1155/2012/703538. [DOI] [PMC free article] [PubMed] [Google Scholar]
Associated Data
This section collects any data citations, data availability statements, or supplementary materials included in this article.


