Abstract
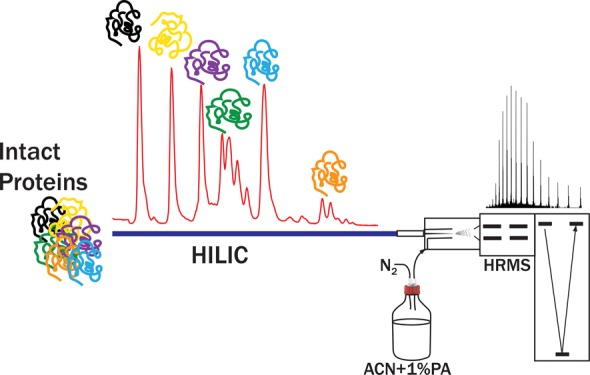
Recent progress in top-down proteomics has driven the demand for chromatographic methods compatible with mass spectrometry (MS) that can separate intact proteins. Hydrophilic interaction liquid chromatography (HILIC) has recently shown good potential for the characterization of glycoforms of intact proteins. In the present study, we demonstrate that HILIC can separate a wide range of proteins exhibiting orthogonal selectivity with respect to reversed-phase LC (RPLC). However, the application of HILIC to the analysis of low abundance proteins (e.g., in proteomics analysis) is hampered by low volume loadability, hindering down-scaling of the method to column diameters below 2.1 mm. Moreover, HILIC-MS sensitivity is decreased due to ion suppression from the trifluoroacetic acid (TFA) often used as the ion-pair agent to improve the selectivity and efficiency in the analysis of glycoproteins. Here, we introduce a capillary-based HILIC-MS method that overcomes these problems. Our method uses RPLC trap-columns to load and inject the sample, circumventing issues of protein solubility and volume loadability in capillary columns (200 μm ID). The low flow rates and use of a dopant gas in the electrospray interface improve protein-ionization efficiencies and reduce suppression by TFA. Overall, this allows the separation and detection of small protein quantities (down to 5 ng injected on column) as indicated by the analysis of a mixture of model proteins. The potential of the new capillary HILIC-MS is demonstrated by the analysis of a complex cell lysate.
Proteins are large and complex macromolecules that play a critical role in many biological processes. Their action is often mediated by variable modifications at the genetic, transcriptional, or post-translational level. State-of-the-art proteomics, using a combination of fractionation, digestion, liquid chromatography (LC), and mass spectrometry (MS), has enabled the identification of a large number of protein cellular components. However, current bottom-up approaches reveal limited information on the distribution of proteins in proteoforms.1 The identification of proteoforms is essential to characterize protein activities, their relationships, and ultimately the cell status.2−5 Therefore, the need to realize isoform-specific analysis has led to the development of top-down proteomics (TDP) analytical methods where proteins are analyzed in their intact form, preserving their proteoform distribution.
Recent developments in the field of MS have delivered benchtop time-of-flight (ToF) and orbitrap instruments providing high resolution, mass accuracy, and sensitivity. These include fragmentation technologies such as electron-transfer dissociation (ETD)6,7 and ultraviolet photodissociation (UVPD),8 allowing in-depth analysis of intact proteins.9,10 The hyphenation of MS methods with nano reversed-phase LC (RPLC) has enabled detailed study of proteoform distributions11 of purified proteins as well as complex cell lysates.12 These intact protein analysis workflows rely on front-end fractionation in order to reduce the sample complexity before MS analysis. When analyzing highly modified proteins (such as histones) or the proteome of a complex organism, RPLC-based methods may not be sufficiently selective. Alternative MS-compatible LC techniques for protein analysis have been developed, including size-exclusion,13 ion-exchange,14 hydrophilic interaction (HILIC),11 and hydrophobic interaction chromatography.15 These techniques separate the sample components based on different analyte characteristics (size, charge, hydrophilicity, and hydrophobicity, respectively). Therefore, coupling these techniques in online or offline two-dimensional LC workflows has increased the depth of LC-MS analysis of complex protein samples.16−18
The use of HILIC for separating intact proteins has recently gained more attention. Different types of column chemistries (and hence selectivities) have been successfully applied to the separation of proteins and proteoforms. The two main classes of stationary phases typically used are weak ion-exchange19 and neutral (polyhydroxylated20 or amide functionalized21) materials. To date, HILIC-MS has been applied to the study of proteins such as histones,19 membrane proteins,22 intact23 and IdeS-digested24 monoclonal antibodies, biopharmaceuticals25 and neoglycoproteins.26 For these proteins, HILIC resolved proteoforms (e.g., resulting from glycosylation or acetylation) would coelute in RPLC.
The application of HILIC-MS for analysis of low abundant proteins is currently limited by two main issues: protein-ionization suppression by mobile-phase additives required for protein elution and solvent compatibility problems related to sample and eluent. Weak-cation-exchange HILIC (WCX-HILIC) methods are used to separate acetylated and methylated variants of basic proteins (e.g., histones) using acetonitrile-rich mobile phases with gradients from low to high concentration of acid/buffers in water. Volatile buffers allow the coupling of these methods to MS;11,27 however, their high concentration still causes protein ion suppression.
In HILIC employing neutral stationary phases, protein retention is primarily based on hydrophilic interactions, under conditions that diminish ion-exchange contributions, and, as such, do not require high buffer concentrations. A gradient of acetonitrile to water is used in combination with mobile-phase additives to decrease the pH of the eluent and allow ion-pair formation with basic protein residues. As a result, ionic interactions of the protein with the stationary phase are minimized, leaving hydrophilic partitioning and/or hydrogen bonding the driving forces of retention. Additionally, ion-pair agents. such as trifluoroacetic acid (TFA), give rise to protein solvating effects that enhance the chromatographic performance in terms of separation selectivity, resolution, and peak shape.24,26,28 Nevertheless, when compared to weaker acids such as formic and acetic acid, TFA causes ionization suppression in electrospray ionization (ESI) MS, impairing protein detection.29,30
The other restriction that typically applies to HILIC is the composition of the injection solvent. HILIC separations, especially when using neutral materials, are sensitive to the composition of the injection plug. Depending on the volume loaded, injecting samples in solvents comprising a high percentage of water may cause peak distortion31 and sample breakthrough (part of the compounds injected leaves the column unretained).32 Thus, in HILIC, it is preferred to use sample diluents with an organic solvent percentage similar to that of the initial mobile-phase composition. However, many proteins have limited solubility and/or stability in solvents of high organic content.
Here we describe a new HILIC-MS approach aimed at minimizing issues connected with both ionization suppression by TFA and analyte breakthrough upon injection of aqueous protein samples. First, we show that HILIC can separate a wide range of proteins, providing a selectivity orthogonal to RPLC, however, allowing only limited injection volumes. In order to circumvent this problem, we studied the use of online RPLC trap-columns to load and inject protein samples on a capillary HILIC column packed with amide functionalized silica. We investigated the advantage of low flow rates and the use of a dopant gas to achieve favorable protein-ionization efficiencies in the presence of TFA. Finally, we evaluated the applicability of the capillary HILIC-MS method for the analysis of complex protein mixtures.
Experimental Section
Chemicals and Sample Preparation
Water was obtained from a direct-QTM Millipore system Millipore (Millipore, Billerica, MA, U.S.A.). MS grade acetonitrile (ACN) and TFA were purchased from Biosolve B.V. (Valkenswaard, The Netherlands). Escherichia coli lyophilized protein lysate was purchased from Bio-Rad (Veenendaal, The Netherlands). Ubiquitin (human >95%), ribonuclease A (bovine pancreas Type X-A, ≥90%), ribonuclease B (bovine pancreas, ≥80%), myoglobin (equine heart >90%), lysozyme (chicken egg white, >90%), carbonic anhydrase (bovine erythrocytes, ≥95%), cytochrome c (equine heart, >95%), transferrin (human, >98%), trypsinogen (bovine pancreas, lyophilized powder) as well as other reagents were acquired from Sigma–Aldrich (Zwijndrecht, The Netherlands).
Standard proteins were used as received without additional purification and were solubilized in Milli-Q grade water at 2 mg/mL. The injection volume on analytical scale columns was 2 μL of the protein standard. For capillary LC-MS experiments, the sample was diluted to 0.2 mg/mL, and the injection volume was 1.0 μL. The lyophilized lysate of E. coli was diluted to a final concentration of 2.5 mg/mL, and 5.0 μL was injected.
HPLC
Analytical LC separations of intact proteins were performed on an Agilent HPLC 1290 Infinity II system (Waldbronn, Germany), equipped with a quaternary pump, autosampler, column thermostated compartment, and multiple wavelength detector. The HILIC column used was an Agilent AdvanceBio glycan mapping 300 Å, 1.8 μm (150 × 2.1 mm ID), which has an amide-based coating. The RPLC C8 column was an Agilent RRHD 300 Å, 1.8 μm (50 × 2.1 mm ID).
Capillary LC separations were done on an UltiMate RSLCnano system (ThermoFisher Scientific, Breda, The Netherlands) equipped with an autosampler (20 μL loop), thermocontrolled column compartment with six ports, two-position valve, nano-HPLC and loading pump system (NCS-3500RS), and UV/vis detector (VWD-3400RS). The capillary HILIC column was packed in our laboratories using the same stationary phase as the analytical column. A slurry was made with MeOH (100 mg/mL), and a 200 μm ID capillary column was packed using a steel-based union and frits from VICI-Valco. As a trap-column, a 5 mm × 300 μm ID C4, 5 μm, 300 Å (Thermo Fisher Scientific) was used. The outlet of the column was connected to the CaptiveSpray source using a 750 mm long, 20 μm ID capillary.
The sample loop in the injection loop was loaded on the trap-column at 15 μL/min using the loading pump (see Figure 3) for 3 min with a mobile phase of 2% ACN in water with 0.1% TFA. HILIC mobile-phases for both analytical and capillary HPLC separation were composed of solvent A (98% ACN, 2% water, 0.1% TFA) and solvent B (10% 2-propanol, 2% ACN, 0.1% TFA). The gradient programs are described in the figure captions. In order to prevent carryover after the separation gradient, fast linear gradients were programmed going from 90 to 10% B in 1 min, followed by three cycles from 10 to 90% B in 1 min, and 90 to 10% B in 1 min, and final column equilibration at 10% B for 10 min prior to sample injection.
Figure 3.
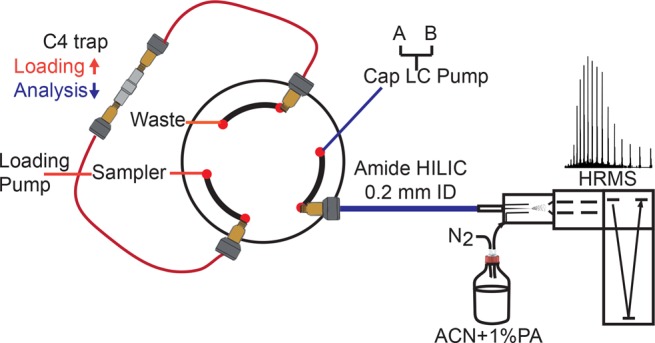
Schematic representation of the capillary HILIC-MS setup with online trap column and CaptiveSpray interface.
MS
Capillary HILIC was coupled to a Bruker Maxis HD instrument (Bremen, Germany) using CaptiveSpray ESI. The mass spectrometer was operated in positive-ion mode with an electrospray voltage of 1.3 kV. The CaptiveSpray nanobooster pressure was set at 0.4 bar (ACN + 1% propionic acid) and dry gas at 3 L/min of nitrogen at 220 °C. The quadrupole ion and collision cell energy were 4 and 8 eV, respectively. The collision cell RF was 2000 Vpp. The in-source CID (isCID) was set to 30 eV. The funnel RF was 400 Vpp, and the multipole RF was 800 Vpp. The transfer and prepulse storage times were set at 150.0 and 20.0 μs, respectively. The monitored mass range was 400–4000 m/z. The MS and MS/MS (CID) acquisition rates were set to 1 Hz, the autoMSn cycle time was 3 s, the MS/MS charge-state preference was 2–12, exclusion was after 1 spectrum, the exclusion time was 60 s, and charge state = 1 was ignored.
Data analysis was done using Compass data analysis (4.3) from Bruker using the Maximum Entropy deconvolution algorithm. Extracted-ion chromatograms were obtained with an extraction window of ±0.5 m/z. ProMex and LcMsSpectator (https://github.com/PNNL-Comp-Mass-Spec/Informed-Proteomics)33 were used for intact mass deconvolution and visualization of the HILIC-MS runs reported in Figures 5 and 6.
Figure 5.
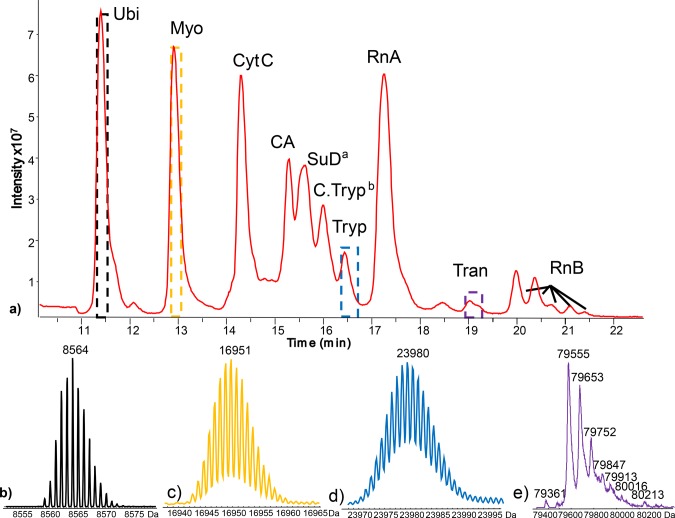
Capillary HILIC-MS of mixture of eight proteins and their protein contaminants. (a) Total-ion chromatogram and (b–e) deconvoluted mass spectra obtained for the peaks (area indicated) of (b) ubiquitin, (c) myoglobin, (d) trypsinogen, and (e) transferrin. Figure 5b–d shows the isotope clusters obtained for each protein, while Figure 5e reports the observed average masses of the glycoforms of transferrin. Protein abbreviations as described in Figure 1 except for: asuperoxide dismutase and bcationic trypsin. Flow rate, 3 μL/min; column temperature, 50 °C; 2 μL injection of 0.05 μg/μL solution. Trap-column loaded for 3 min at 15 μL/min. Linear gradient from 10 to 20% B in 1 min, from 20 to 50% B in 30 min, from 50 to 90% B in 2 min; isCID energy, 40 eV. The extracted-ion chromatograms, mass spectra, and measured peak capacity are reported in section S4 of the Supporting Information.
Figure 6.
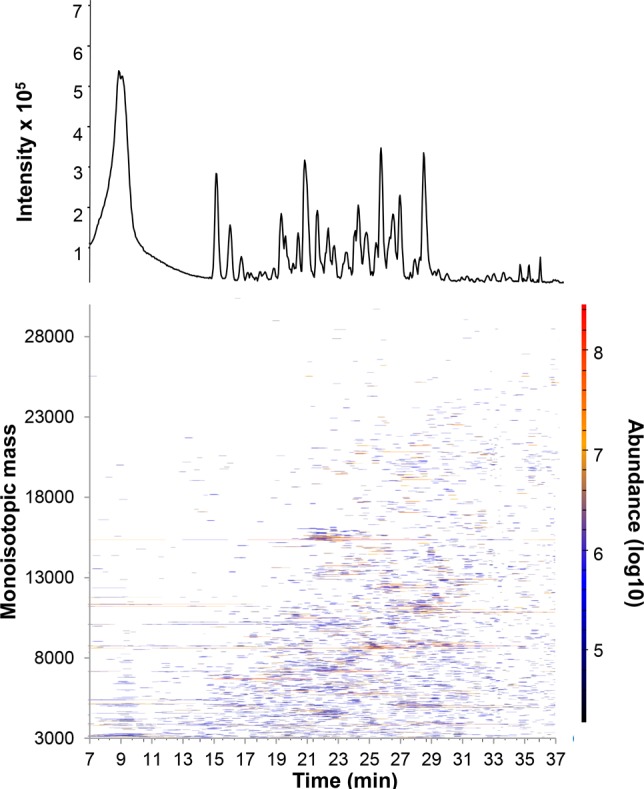
Capillary HILIC-MS of an E. coli lysate (5 μL loaded of a 2.5 mg/mL solution in 2% ACN and 0.1% TFA). (top) Base-peak chromatogram (900–3000 m/z); (bottom) feature map showing deconvoluted MS spectra. The deconvolution algorithm is based on isotopically resolved molecular features, and therefore, potential features above 35 kDa are not identified. Mobile phases as specified in the Experimental Section. Loading at 10% B, multisegment linear gradient from 10–12% B in 1 min, 12–30% in 30 min, 30–65% B in 6 min, 65–90% B in 1 min, followed by 3 min at 90% B and several washing steps (total analysis time of 60 min).
mzML data from the HILIC analysis shown in Figure 6 was uploaded to the National Resource for Translational and Developmental Proteomics (NRTDP, Northwestern University, Evanston, IL, U.S.A.) TDPortal1.3 high-performance computing environment for analysis of high-throughput top-down proteomics data (available for academic collaborators at: http://nrtdp.northwestern.edu/tdportal-request/). The data was deconvoluted using the THRASH algorithm with the cut off of a S/N of 20, searched against the E. coli database. The identified proteins were filtered at 1% of false discovery rate.
Results and Discussion
HILIC of Intact Proteins on Amide Stationary Phases and Comparison to RPLC
In order to study the selectivity of the amide functionalized silica material, 14 proteins (Table 1) were selected covering a wide range of chemophysical properties, such as molecular weight (Mw, 8.5–660 kDa), theoretical isoelectric point (pI, 5.2–9.6) and aliphatic index (46–100). Most of these proteins carry post-translational modifications (PTMs), in particular, ribonuclease B, α-acidic glycoprotein (AGP), transferrin, fetuin, ovalbumin, and thyroglobulin, which are glycosylated. Each protein standard was injected from a water solution to the analytical HILIC column, and a gradient of ACN/water containing 0.1% TFA was applied (see Figure 1A). With respect to previous reports, here we used a small percentage of isopropanol in the highly aqueous solvent both to reduce the solvent elution strength and to prevent carry over between runs (further details are described in the Experimental Section). Interestingly, all the test proteins are retained on HILIC, indicating that such a method can be used to resolve mixtures of intact proteins. The retention and selectivity of the HILIC separation is determined both by the properties of the peptide backbone (e.g., resolution between ubiquitin, myoglobin, cytochrome c, and lysozyme) and by the presence of glycoforms. Glycoproteins are better retained with respect to their aglyco form as indicated by the clear separation of the nonglycosylated ribonuclease (RnA) from its glycosylated isoforms (i.e., RnB).
Table 1. Characteristics of the Protein Standards Analyzed by HILIC (Amide) and RPLC (C8).
| protein | Uniprot entry nr | elution order RPLC | elution order HILIC | Mw (Da)a | pIb | aliphatic index | GRAVY* |
|---|---|---|---|---|---|---|---|
| ribonuclease Bc | P61824 | 1 | 11 | 13681 | 8.64 | 46.45 | 0.337 |
| ribonuclease Ac | P61823 | 2 | 9 | 13681 | 8.64 | 46.45 | –0.663 |
| ubiquitinc | RS27A | 3/4 | 1 | 8564 | 6.56 | 100.0 | –0.489 |
| cytochrome Ce** | P00004 | 3/4 | 3 | 11701 | 9.59 | 59.13 | –0.902 |
| lysozymed | P00698 | 5 | 4 | 14313 | 9.32 | 65.12 | –0.472 |
| trypsinogenc | P00760 | 6 | 8 | 23993 | 8.23 | 78.30 | –0.118 |
| AGPc | Q3SZR3 | 7 | 14 | 21253 | 5.67 | 71.09 | –0.597 |
| transferrinf** | Q06AH7 | 8 | 10 | 75091 | 6.84 | 70.69 | –0.403 |
| BSAc | P02769 | 9 | 7 | 66432 | 5.60 | 76.14 | –0.475 |
| myoglobine** | P0CG53 | 10 | 2 | 16951 | 7.36 | 89.35 | –0.396 |
| fetuinc | Q58D62 | 11 | 12/13 | 40845 | 5.59 | 69.46 | –0.499 |
| carbonic anhydrasec | P00921 | 12 | 6 | 28693 | 6.40 | 75.64 | –0.555 |
| ovalbumind | P01012 | 13 | 5 | 42881 | 5.19 | 89.95 | –0.001 |
| thyroglobulinc*** | P01267 | 14 | 12/13 | 301219*** | 5.50 | 73.39 | –0.257 |
Molecular weight calculated from the amino acid sequence (not considering proteoforms).
Theoretical.
Bovine.
Chicken Egg.
Equine.
Human.
Grand average hydropathy
Heme protein.
Thyroglobulin is a tetramer of 165 kDa units. The molecular weight reported here is deduced from the 2769 amino acid primary structure.34
Figure 1.
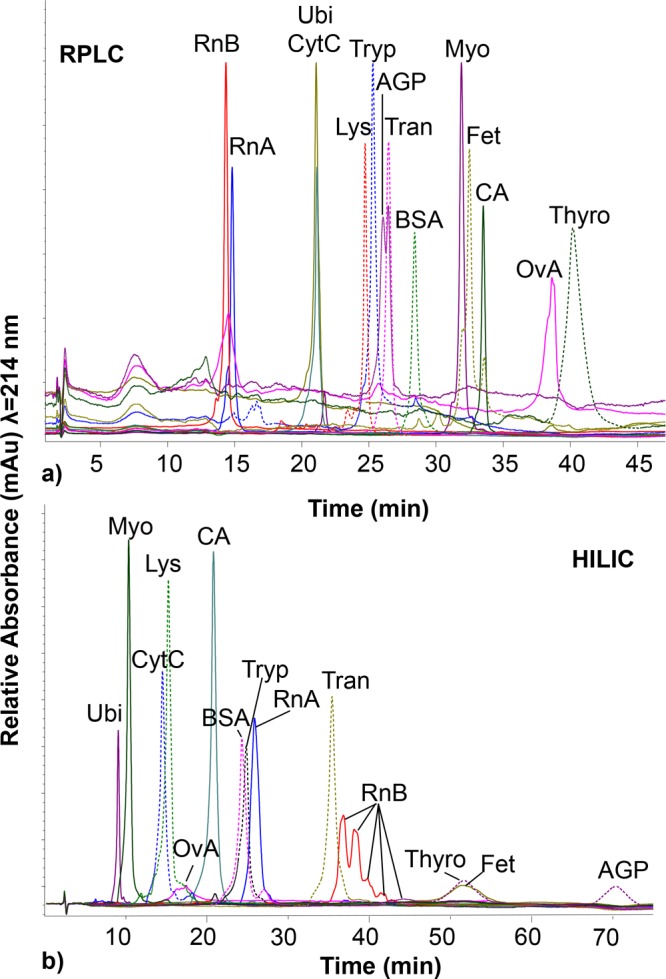
(a) C8-RPLC and (b) HILIC of protein standards. The RPLC analysis was performed using a linear gradient from 5 to 60% A in 45 min. HILIC analysis started with 10% B for 1 min followed by a linear increase to 20% B in 1 min and then to 55% B in 90 min. Flow rate, temperature, and UV absorbance detection for all runs were 0.2 mL/min, 60 °C, and at 214 nm, respectively. Ubi = ubiquitin, Myo = myoglobin, CytC = cytochrome C, Lys = lysozyme, OvA = albumin from chicken egg, CA = carbonic anhydrase, BSA = bovine serum albumin, Tran = Transferrin, Fet = fetuin, Tryp = trypsinogen, RnA = ribonuclease A, RnA B = ribonuclease B, Thyro = thyroglobulin, AGP = α-1-acidic glycoprotein.
Each protein standard was also analyzed by C8 RPLC using the same mobile-phase solvents, but with a gradient from high water to high organic solvent content (details in the Experimental Section). As can be seen from Figure 1 and Table 1, the protein elution orders of RPLC and HILIC are clearly different and do not appear to correlate to chemophysical parameters, such as pI, aliphatic index, and GRAVY (see section S1 of the Supporting Information). The elution order in HILIC is also not the opposite of RPLC, suggesting that different polar and nonpolar domains of the protein are responsible for the interaction with the stationary phases, and as such, the two methods have orthogonal selectivity.35 Hence, HILIC could be used as a prefractionation method to reduce sample complexity (e.g., in top-down proteomics analysis of complex cell lysates12) given its alternative selectivity and high peak capacity (comparable to RPLC).
Injection Volume and Sample Breakthrough
HILIC separations are sensitive to the solvent composition of the injected sample, and this is a constraint when developing methods for separating intact proteins. Ideally, the solvent composition should be as close as possible to the initial elution conditions. However, the solubility and stability of many proteins in high percentages of ACN is low. In order to allow proteins to be injected in water, small volumes of concentrated protein solutions have been injected while starting the gradients at a high percentage of ACN. In this way, peak distortion by the strong elution strength of the sample diluent could be prevented.23,26,36 This approach has proven feasible for relatively pure samples, such as biopharmaceuticals,23,24 but may not be (directly) applicable to more diluted and complex samples containing various proteins at low concentrations.
In order to further investigate the limitations of the direct analysis of highly aqueous samples with HILIC, we studied the effect of the injection volume on the chromatographic performance of four proteins (Figure 2). Increasing sample volumes (2–20 μL) were injected while keeping the protein mass injected constant. For the retained proteins, peak shapes remained fairly constant, showing no deformation (Figure 2S). However, injection volumes above 10 μL showed a drastic decrease of peak area for the retained protein peaks, while the peak eluting with the column void volume substantially increased.
Figure 2.
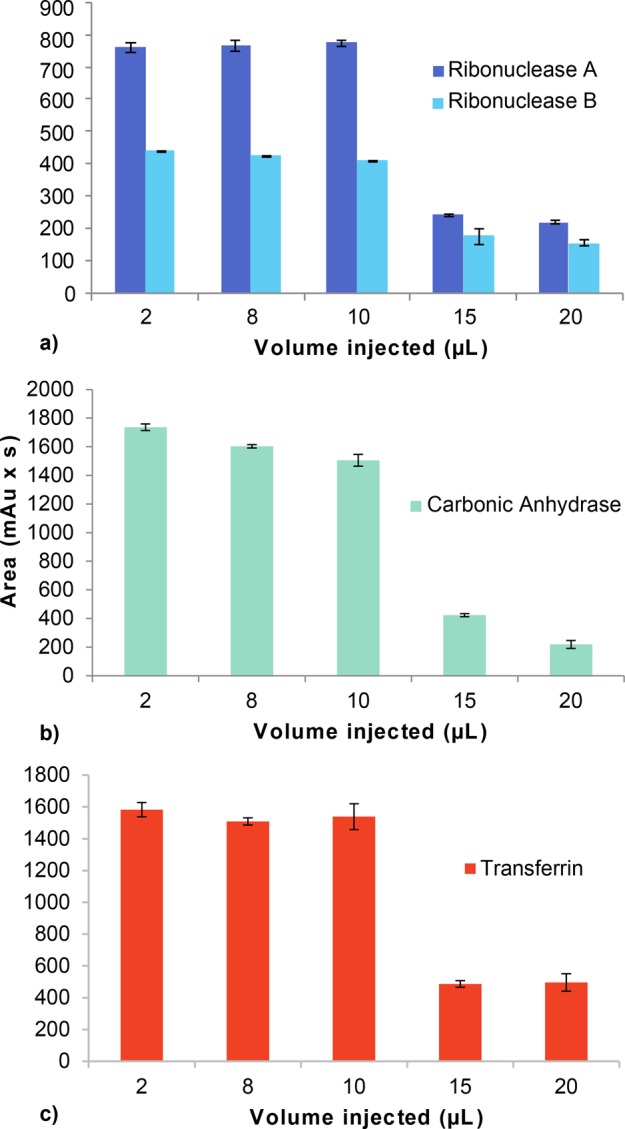
Area of the retained peak obtained during HILIC of (a) RNase A and B1 (first eluting glycoform), (b) carbonic anhydrase, and (c) transferrin using increasing injection volumes (2–20 μL). Protein concentrations are 0.2 mg/mL (2 μL), 0.05 mg/mL (8 μL), 0.04 mg/mL (10 μL), 0.026 mg/mL (15 μL), 0.020 mg/mL (20 μL). The error bars indicate the standard deviation from triplicate injections. The chromatograms of the measurements as well as the gradient details are reported in Figure S2.
Hence, upon the applied conditions, injection of volumes higher than 10 μL (corresponding to about 3% of the column volume) have a significant amount of the protein injected not retained on the column but did elute with the solvent front. This phenomenon is known as “breakthrough”32 and happens because the injection solvent (water) is a strong eluent in HILIC. Small injection volumes allow the injection solvent to be efficiently mixed with the ACN-rich mobile phase in the column at the start of the gradient. However, with injection volumes above 3–5% of the column volume, the mixing becomes incomplete. As a result, part of the protein injected remains in the injected solvent eluting at the column dead time, while part of it is retained on the column. We also tested mobile phases containing 0.05% TFA instead of 0.1% TFA and observed an earlier onset of breakthrough (starting from 4 μL, data not shown), demonstrating the importance of the concentration of the ion-pairing agent in solvating the proteins in mobile phases rich in ACN.
Capillary HILIC Separation Using an RPLC Trap-Column
Injecting small volumes (0.5–1 μL) of concentrated samples (e.g., 1–2 mg/mL) may be a viable option when analyzing biotechnological protein products available in relatively large amounts. In our research, we aimed to extend the application of HILIC methods to study intact proteins in biological samples (e.g., proteomics purposes). These applications typically require capillary or nano-HPLC in order to profit from sensitive ESI-MS detection at low flow rates. When downscaling the HILIC method to a capillary format using a column of 200 mm length and 200 μm ID, the maximum allowed volume of injection for aqueous samples without causing breakthrough would be about 120–200 nL. Such a volume is difficult to inject reliably with standard injectors, and relatively high concentrations would be needed to inject appreciable amounts of protein (e.g., to inject 100 ng on column, one would need a 0.5 mg/mL solution).
Trap-columns, having chemistry similar to that of the stationary phase used (but generally less retentive), allow one to preconcentrate analytes from relatively large sample volumes of weak elution solvents and subsequently inject them onto the separation column in a much smaller volume.37 However, trap-columns are not a solution to overcome the limited volume loadability of HILIC, since these would only be compatible with samples dissolved in high percentages of organic solvent. For this reason, we used RPLC trap-columns (5 × 0.3 mm ID packed with C4, 300 Å material) to load relatively large volumes (up to 20 μL) of aqueous samples and injected the concentrated proteins in about 220 nL. Elution was achieved by simply backflushing the trap-column using the HILIC starting solvent, which is high in ACN (i.e., a strong eluent for RPLC). The small sample plug, once it leaves the trap, is mixed with the HILIC mobile-phase and focused on the capillary HILIC column and then separated using a gradient. A schematic of the system is shown in Figure 3.
A small adjustment of the gradient conditions, in which the capillary column is held for 1 min at 10% solvent B, allowed injection of the entire trap-column volume (about 220 nL) on the capillary HILIC column without observing significant breakthrough. This configuration allowed us to load aqueous sample volumes of up to 20 μL in the trap-column (i.e., about 700% of the column volume) without significant sample losses. This was demonstrated by the linear correlation between the mass loaded on the trap-column and protein peak areas obtained (section S3 of the Supporting Information).
Capillary HILIC-MS of Proteins: Optimization of ESI Conditions
Capillary scale separations help reduce solvent and sample consumption and benefit from more favorable ESI conditions. Still, a significant bottleneck in the application of HILIC separations remains the presence of relatively high concentrations of TFA in the mobile phase (0.1% v/v), resulting in protein-ionization suppression and formation of gas-phase TFA–protein adducts. HILIC methods having formic acid as eluent additive are not a viable option, as the protein separation efficiency of HILIC methods is significantly reduced, in particular with respect to glycoforms.24 Dissociation of formed TFA–protein adducts in some instances can be achieved using a high in-source collision energy (isCID; often over 100 eV28) during MS analysis. However, a potential drawback of a high isCID is that proteins (in particular, proteins below 30 kDa) may be fragmented in the source, impairing their intact analysis.
To overcome this issue, we studied the use of a CaptiveSpray38,39 source to reduce issues with protein ionization due to TFA in capillary HILIC-MS methods. This ionization source allows the introduction of dopant-enriched nitrogen (DEN) gas in the ionization chamber, in order to enhance ESI of analytes. Here we investigated the use of ACN and ACN with 1% propionic acid (PA) as the DEN-gas in capillary HILIC-MS for a mixture of cytochrome C and ribonuclease A and compared it with analysis without DEN-gas (Figure 4).
Figure 4.
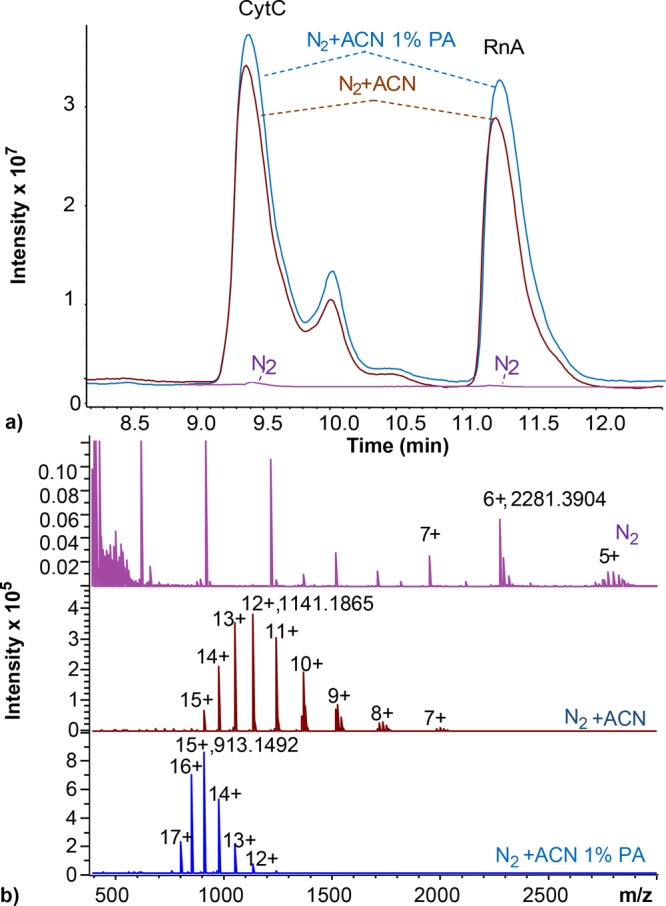
Capillary HILIC-MS with online RPLC trap-column and CaptiveSpray ESI source of a mixture of cytochrome C and ribonuclease A (0.02 mg/mL each, 10 μL injection) using pure nitrogen (magenta), nitrogen with ACN as DEN-gas (brown), and ACN with 1% PA as DEN-gas (blue). (a) Total-ion chromatograms and (b) mass spectra of ribonuclease A (and respective most intense mass). isCID energy, 30 eV; trap-column loaded for 3 min at 15 μL/min; linear gradient from 10 to 20% B in 1 min, from 20 to 50% B in 10 min, from 50 to 90% B in 2 min.
The use of DEN-gas significantly enhances the ionization of the HILIC separated proteins. The peak area obtained for cytochrome C with ACN as the DEN-gas is up to 400-fold larger with respect to the same analysis with nondoped nitrogen gas (Figure 4a). Moreover, Figure 4b shows a drastic shift in the charge-state distribution observed for RNase A when ACN is used as DEN-gas. The DEN-gas has a clear charging effect, counteracting the ionization suppression effects of TFA and substantially improving the proteins’ ESI efficiency. Relatively mild isCID conditions (30 eV) were applied, and therefore, TFA adducts still appeared in the mass spectrum (Figure 4b, middle trace). Addition of PA to the ACN DEN-gas removed the TFA–protein adducts and further increased protein signal intensity, shifting the protein charge-distribution to higher charge states (Figure 4B, bottom trace).
Chen et al.39 reported the use of PA vapors to counteract ion-suppression due to TFA using a ionization source having a similar layout on a different mass spectrometer (Orbitrap XL). Signal enhancement and declustering may be a result of the dissolution of PA vapor in the ESI droplets. The lower vapor pressure of PA with respect to TFA (0.32 vs 11 kPa at 20 °C) would facilitate the formation of PA–protein adducts in the gas phase, complexes that can be more easily dissociated with respect to the ones resulting from TFA. Moreover, acidic vapors can improve the ionization efficiency of analytes as described by Kharlamova40 and then by Li et al.41 Infusion experiments of single proteins in 50/50 ACN/water with 0.1% TFA and pure PA as DEN-gas helped increase the signal intensity but at the same time introduced PA adducts and significantly shifted the protein charge-state distribution toward higher charge states. The different outcome of our result may be explained by the different design of the desolvation source of the instruments, the gas pressure at which TOF and Orbitrap systems operate, and different ESI settings. Therefore, in our experiments, we opted to use a mixture of ACN and PA, which successfully tackled this issue
Ultimately, capillary HILIC with an online RPLC trap-column and CaptiveSpray source using ACN with 1% PA as DEN-gas enabled us to obtain clear mass spectra for protein masses down to 5 ng on the column (∼400 fmol, 2 μL of a 2.5 ng/μL; more details available in section S3 of the Supporting Information).
Capillary HILIC-MS of Protein Mixture and Cell Lysate
In order to study the applicability of the developed capillary HILIC-MS method for the assessment of protein samples, a mixture of eight standard proteins of varying natures was analyzed (Figure 5).
Good-quality mass spectra were obtained for all of the proteins, including carbonic anhydrase, which is particularly sensitive to fragmentation when using high isCID energies42 (the MS spectra are reported in section S4). Notably, transferrin, which has a relatively high molecular weight (>70 kDa) and often requires high isCID energy for ion desolvation, could be detected effectively under the applied conditions. The average width-at-half-height for the peaks in the extracted-ion chromatograms was about 0.2 min, resulting in a satisfactory peak capacity of 43 for an effective gradient window of about 15 min (results are summarized in Table S1).
The potential of the capillary HILIC-MS method for proteomics purposes was evaluated by the analysis of an E. coli lysate. Figure 6 shows the base-peak chromatogram and feature map (deconvoluted MS spectra vs time) obtained with capillary HILIC-MS after loading about 10 μg of lysate on column. The surfactant present in the sample elutes as an intense peak at the beginning of the chromatogram (∼8 min) followed by the proteins.
A large number of LC-MS protein features were detected in the HILIC MS run (representative mass spectra are reported in section S5 of the Supporting Information). Promex33 analysis of our data set revealed 885 distinct deconvoluted masses from species having charge states between 5 and 30 and a likelihood ratio higher than 100. The likelihood is calculated on the basis of ratio of abundance at a given charge state with respect to total abundance and the similarity score of the aggregated isotopomer envelope.33 Analysis of the MS/MS data using TDportal identified 23 proteins at 1% FDR (the list is available in the Supporting Information) with Mw below 15 kDa. The limited identifications are a consequence of not fully optimized analysis conditions. Given the complexity of the sample, coelution of proteins in one-dimensional LC is inevitable, and fractionation/multidimensional separations should be employed.16,43,44 However, our results prove that HILIC can be used for high-resolution separation of intact proteins as demonstrated by the peak capacity of about 200 obtained from a 25 min elution window. This result suggests that HILIC methods could be used for fractionation in top-down MS experiments given the high resolution and the orthogonality with respect to RPLC analysis.
Conclusions
The development of a generally applicable approach to perform capillary HILIC-mass spectrometry analysis of intact proteins is reported. The restraints on protein solubility, volume loadability, and ionization suppression met in analytical scale HILIC are overcome using an RPLC trap-column (to concentrate the sample injection volumes) and a dopant gas in the ESI.
The capillary HILIC-MS method can be used as a high-resolution approach to separate complex mixtures of proteins such as cell lysates using wide mobile-phase gradients (e.g., from 10 to 40% water). Implementation of this method adds selectivity options for multidimensional LC of intact proteins and represents an alternative to RPLC-MS for the analysis of proteins after affinity purification. The relatively small protein quantities needed for analysis makes the method attractive for samples comprising low concentrations of proteins. Further down-scaling of the method to nanoliter flow rates should be possible, potentially achieving an increase in sensitivity. This would require reducing the dimensions of the RPLC trap-column (e.g., to 10 mm × 100 μm ID) and those of the HILIC column (e.g., to 300 mm × 75 μm ID). However, at present, trap-columns of such dimensions are not commercially available.
Acknowledgments
This work was financially supported by The Netherlands Organization for Scientific Research by the NWO Veni grant IPA (722.015.009). The authors would like to thank Rob Haselberg (Vrije Universiteit Amsterdam), Peter J. Schoenmakers, and Eva M. Johansson (University of Amsterdam) for their help and valuable discussions and Xiaoli Wang and Linda Lloyd (Agilent Technologies) for the kind gift of the HPLC columns.
Supporting Information Available
The Supporting Information is available free of charge on the ACS Publications website at DOI: 10.1021/acs.analchem.8b00382.
Scatter plots and linear regressions between aliphatic index and percentage of elution and natural logarithm of elution time (Figure S1). Chromatograms reporting the effect of the injection volume on the HILIC separation (Figure S2). Calibration curve obtained from the injection of cytochrome C and ribonuclease A on a capillary HILIC separation (Figure S3) and the mass spectra from the highest and lowest injected mass (Figure S4). Mass spectra of the protein peaks reported in Figure 5 (Figure S5) and their extracted-ion chromatogram (Figure S6). LC-MS parameters (retention time, area, intensity, S/N, max m/z, and fwhm) and peak capacity obtained from the analysis of the protein mixture in Figure 5 (Table S1). Total-ion and extracted-ion chromatograms (Figure S7), mass spectra and deconvoluted mass spectra (Figure S8) from the capillary HILIC analysis of E. coli lysate reported in Figure 6 (PDF)
Output of the Promex search (XLSX)
Output of the TD portal search (XLSX)
The authors declare no competing financial interest.
Supplementary Material
References
- Smith L. M.; Kelleher N. L. Nat. Methods 2013, 10 (3), 186–187. 10.1038/nmeth.2369. [DOI] [PMC free article] [PubMed] [Google Scholar]
- Ansong C.; Wu S.; Meng D.; Liu X.; Brewer H. M.; Deatherage Kaiser B. L.; Nakayasu E. S.; Cort J. R.; Pevzner P.; Smith R. D.; Heffron F.; Adkins J. N.; Pasa-Tolic L. Proc. Natl. Acad. Sci. U. S. A. 2013, 110 (25), 10153–10158. 10.1073/pnas.1221210110. [DOI] [PMC free article] [PubMed] [Google Scholar]
- Duan G.; Walther D. PLoS Comput. Biol. 2015, 11 (2), e1004049. 10.1371/journal.pcbi.1004049. [DOI] [PMC free article] [PubMed] [Google Scholar]
- Krueger K. E.; Srivastava S. Mol. Cell. Proteomics 2006, 5 (10), 1799–1810. 10.1074/mcp.R600009-MCP200. [DOI] [PubMed] [Google Scholar]
- Gregorich Z. R.; Peng Y.; Cai W.; Jin Y.; Wei L.; Chen A. J.; McKiernan S. H.; Aiken J. M.; Moss R. L.; Diffee G. M.; Ge Y. J. Proteome Res. 2016, 15 (8), 2706–2716. 10.1021/acs.jproteome.6b00244. [DOI] [PMC free article] [PubMed] [Google Scholar]
- Fornelli L.; Parra J.; Hartmer R.; Stoermer C.; Lubeck M.; Tsybin Y. O. Anal. Bioanal. Chem. 2013, 405 (26), 8505–8514. 10.1007/s00216-013-7267-5. [DOI] [PubMed] [Google Scholar]
- Tsybin Y. O.; Fornelli L.; Stoermer C.; Luebeck M.; Parra J.; Nallet S.; Wurm F. M.; Hartmer R. Anal. Chem. 2011, 83 (23), 8919–8927. 10.1021/ac201293m. [DOI] [PubMed] [Google Scholar]
- Shaw J. B.; Li W.; Holden D. D.; Zhang Y.; Griep-Raming J.; Fellers R. T.; Early B. P.; Thomas P. M.; Kelleher N. L.; Brodbelt J. S. J. Am. Chem. Soc. 2013, 135 (34), 12646–12651. 10.1021/ja4029654. [DOI] [PMC free article] [PubMed] [Google Scholar]
- Toby T. K.; Fornelli L.; Kelleher N. L. Annu. Rev. Anal. Chem. 2016, 9 (1), 499–519. 10.1146/annurev-anchem-071015-041550. [DOI] [PMC free article] [PubMed] [Google Scholar]
- Fornelli L.; Durbin K. R.; Fellers R. T.; Early B. P.; Greer J. B.; LeDuc R. D.; Compton P. D.; Kelleher N. L. J. Proteome Res. 2017, 16 (2), 609–618. 10.1021/acs.jproteome.6b00698. [DOI] [PMC free article] [PubMed] [Google Scholar]
- Tian Z.; Tolić N.; Zhao R.; Moore R. J.; Hengel S. M.; Robinson E. W.; Stenoien D. L.; Wu S.; Smith R. D.; Paša-Tolić L. Genome Biol. 2012, 13 (10), R86. 10.1186/gb-2012-13-10-r86. [DOI] [PMC free article] [PubMed] [Google Scholar]
- Tran J. C.; Zamdborg L.; Ahlf D. R.; Lee J. E.; Catherman A. D.; Durbin K. R.; Tipton J. D.; Vellaichamy A.; Kellie J. F.; Li M.; Wu C.; Sweet S. M. M.; Early B. P.; Siuti N.; LeDuc R. D.; Compton P. D.; Thomas P. M.; Kelleher N. L. Nature 2011, 480 (7376), 254–258. 10.1038/nature10575. [DOI] [PMC free article] [PubMed] [Google Scholar]
- Muneeruddin K.; Thomas J. J.; Salinas P. A.; Kaltashov I. A. Anal. Chem. 2014, 86 (21), 10692–10699. 10.1021/ac502590h. [DOI] [PubMed] [Google Scholar]
- Muneeruddin K.; Nazzaro M.; Kaltashov I. A. Anal. Chem. 2015, 87 (19), 10138–10145. 10.1021/acs.analchem.5b02982. [DOI] [PubMed] [Google Scholar]
- Chen B.; Peng Y.; Valeja S. G.; Xiu L.; Alpert A. J.; Ge Y. Anal. Chem. 2016, 88 (3), 1885–1891. 10.1021/acs.analchem.5b04285. [DOI] [PMC free article] [PubMed] [Google Scholar]
- Valeja S. G.; Xiu L.; Gregorich Z. R.; Guner H.; Jin S.; Ge Y. Anal. Chem. 2015, 87 (10), 5363–5371. 10.1021/acs.analchem.5b00657. [DOI] [PMC free article] [PubMed] [Google Scholar]
- Xiu L.; Valeja S. G.; Alpert A. J.; Jin S.; Ge Y. Anal. Chem. 2014, 86 (15), 7899–7906. 10.1021/ac501836k. [DOI] [PMC free article] [PubMed] [Google Scholar]
- Tian Z.; Zhao R.; Tolić N.; Moore R. J.; Stenoien D. L.; Robinson E. W.; Smith R. D.; Paša-Tolić L. Proteomics 2010, 10 (20), 3610–3620. 10.1002/pmic.201000367. [DOI] [PMC free article] [PubMed] [Google Scholar]
- Lindner H.; Sarg B.; Helliger W. J. Chromatogr. A 1997, 782 (1), 55–62. 10.1016/S0021-9673(97)00468-8. [DOI] [PubMed] [Google Scholar]
- Tetaz T.; Detzner S.; Friedlein A.; Molitor B.; Mary J.-L. J. Chromatogr. A 2011, 1218 (35), 5892–5896. 10.1016/j.chroma.2010.09.027. [DOI] [PubMed] [Google Scholar]
- Zhang Z.; Wu Z.; Wirth M. J. J. Chromatogr. A 2013, 1301, 156–161. 10.1016/j.chroma.2013.05.076. [DOI] [PMC free article] [PubMed] [Google Scholar]
- Carroll J.; Fearnley I. M.; Walker J. E. Proc. Natl. Acad. Sci. U. S. A. 2006, 103 (44), 16170–16175. 10.1073/pnas.0607719103. [DOI] [PMC free article] [PubMed] [Google Scholar]
- D’Atri V.; Fekete S.; Beck A.; Lauber M.; Guillarme D. Anal. Chem. 2017, 89 (3), 2086–2092. 10.1021/acs.analchem.6b04726. [DOI] [PubMed] [Google Scholar]
- Periat A.; Fekete S.; Cusumano A.; Veuthey J.-L.; Beck A.; Lauber M.; Guillarme D. J. Chromatogr. A 2016, 1448, 81–92. 10.1016/j.chroma.2016.04.056. [DOI] [PubMed] [Google Scholar]
- Domínguez-vega E.; Tengattini S.; Peintner C.; van Angeren J.; Temporini C.; Haselberg R.; Massolini G.; Somsen G. W. Talanta 2018, 184, 375–381. 10.1016/j.talanta.2018.03.015. [DOI] [PubMed] [Google Scholar]
- Tengattini S.; Dominguez-Vega E.; Temporini C.; Bavaro T.; Rinaldi F.; Piubelli L.; Pollegioni L.; Massolini G.; Somsen G. W. Anal. Chim. Acta 2017, 981, 94–105. 10.1016/j.aca.2017.05.020. [DOI] [PubMed] [Google Scholar]
- Molden R. C.; Garcia B. A. Curr. Protoc. Protein Sci. 2014, 77 (1), 23.7.1–23.7.28. 10.1002/0471140864.ps2307s77. [DOI] [PMC free article] [PubMed] [Google Scholar]
- Pedrali A.; Tengattini S.; Marrubini G.; Bavaro T.; Hemström P.; Massolini G.; Terreni M.; Temporini C. Molecules 2014, 19 (7), 9070–9088. 10.3390/molecules19079070. [DOI] [PMC free article] [PubMed] [Google Scholar]
- García M. C.; Hogenboom a. C.; Zappey H.; Irth H. J. Chromatogr. A 2002, 957 (2), 187–199. 10.1016/S0021-9673(02)00345-X. [DOI] [PubMed] [Google Scholar]
- Bobaly B.; Beck A.; Fekete J.; Guillarme D.; Fekete S. Talanta 2015, 136, 60–67. 10.1016/j.talanta.2014.12.006. [DOI] [PubMed] [Google Scholar]
- Ruta J.; Rudaz S.; McCalley D. V.; Veuthey J. L.; Guillarme D. J. Chromatogr. A 2010, 1217 (52), 8230–8240. 10.1016/j.chroma.2010.10.106. [DOI] [PubMed] [Google Scholar]
- Jiang X.; Van Der Horst A.; Schoenmakers P. J. J. Chromatogr. A 2002, 982 (1), 55–68. 10.1016/S0021-9673(02)01483-8. [DOI] [PubMed] [Google Scholar]
- Park J.; Piehowski P. D.; Wilkins C.; Zhou M.; Mendoza J.; Fujimoto G. M.; Gibbons B. C.; Shaw J. B.; Shen Y.; Shukla A. K.; Moore R. J.; Liu T.; Petyuk V. A.; Tolić N.; Paša-Tolić L.; Smith R. D.; Payne S. H.; Kim S. Nat. Methods 2017, 14 (9), 909–914. 10.1038/nmeth.4388. [DOI] [PMC free article] [PubMed] [Google Scholar]
- Pitt-Rivers R. Biochem. J. 1976, 157 (3), 767–768. 10.1042/bj1570767. [DOI] [PMC free article] [PubMed] [Google Scholar]
- Gilar M.; Olivova P.; Daly A. E.; Gebler J. C. Anal. Chem. 2005, 77 (19), 6426–6434. 10.1021/ac050923i. [DOI] [PubMed] [Google Scholar]
- Lauber M. A.; Mccall S. A.; Alden B. A.; Iraneta P. C.; Koza S. M.. Developing High Resolution HILIC Separations of Intact Glycosylated Proteins Using a Wide-Pore Amide-Bonded Stationary Phase; Waters application note 720005380EN; Waters Corporation: Milford, MA, U.S.A., 2015.
- Lankelma J.; Poppe H. J. Chromatogr. 1978, 149, 587–598. 10.1016/S0021-9673(00)81013-4. [DOI] [PubMed] [Google Scholar]
- Nugent K.; Zhu Y.; Kent P.; Phinney B.; Alvarado R.. CaptiveSpray: A New Ionization Technique to Maximizing Speed, Sensitivity, Resolution and Robustness for LCMS Protein Biomarker Quantitation. Presented at the 57th ASMS Conference on Mass Spectrometry and Allied Topics, Philadelphia, PA, May 2009; MP003.
- Chen J.; Liu Z.; Wang F.; Mao J.; Zhou Y.; Liu J.; Zou H.; Zhang Y. Chem. Commun. 2015, 51 (79), 14758–14760. 10.1039/C5CC06072A. [DOI] [PubMed] [Google Scholar]
- Kharlamova A.; McLuckey S. A. Anal. Chem. 2011, 83 (1), 431–437. 10.1021/ac1027319. [DOI] [PMC free article] [PubMed] [Google Scholar]
- Li Z.; Li L. Anal. Chem. 2014, 86 (1), 331–335. 10.1021/ac4036263. [DOI] [PubMed] [Google Scholar]
- Vellaichamy A.; Tran J. C.; Catherman A. D.; Lee J. E.; Kellie J. F.; Sweet S. M. M.; Zamdborg L.; Thomas P. M.; Ahlf D. R.; Durbin K. R.; Valaskovic G. A.; Kelleher N. L. Anal. Chem. 2010, 82 (4), 1234–1244. 10.1021/ac9021083. [DOI] [PMC free article] [PubMed] [Google Scholar]
- Kellie J. F.; Catherman A. D.; Durbin K. R.; Tran J. C.; Tipton J. D.; Norris J. L.; Witkowski C. E.; Thomas P. M.; Kelleher N. L. Anal. Chem. 2012, 84 (1), 209–215. 10.1021/ac202384v. [DOI] [PMC free article] [PubMed] [Google Scholar]
- Cai W.; Tucholski T.; Chen B.; Alpert A. J.; McIlwain S.; Kohmoto T.; Jin S.; Ge Y. Anal. Chem. 2017, 89 (10), 5467–5475. 10.1021/acs.analchem.7b00380. [DOI] [PMC free article] [PubMed] [Google Scholar]
Associated Data
This section collects any data citations, data availability statements, or supplementary materials included in this article.


