

Abstract
Evaluation of cost-utility is critical in assessing the medical utility of predictive or prognostic biomarkers. Current methods involve complex state-transition models, requiring comprehensive data inputs. We propose a simplified decision-analytic tool to explore the relative effect of factors contributing to the cost-utility of a biomarker. We derived a cost-utility metric, the “test incremental cost-effectiveness ratio” (TICER) for biomarker-guided treatment compared to no biomarker use. This method uses data inputs readily accessible through clinical literature. We compared our results with traditional cost-effectiveness analysis of predictive biomarkers for established (HER2-guided trastuzumab, ALK-guided crizotinib, OncotypeDX-guided adjuvant chemotherapy) and emerging (ROS1-guided crizotinib) targeted treatments. We conducted sensitivity analysis to determine which factors had the greatest impact on TICER estimates. Base case TICER for HER2 was $149,600/quality-adjusted life year (QALY), for ALK was $22,200/QALY, and for OncotypeDX was $11,600/QALY, consistent with literature-reported estimates ($180,000/QALY, $202,800/QALY, $8900/QALY, respectively). Base case TICER for ROS1-guided crizotinib was $205,900/QALY. Generally, when treatment cost is considerably greater than biomarker testing costs, TICER is driven by clinical outcomes and health-related quality of life, while biomarker prevalence and treatment cost have a lesser effect. Our simplified decision-analytic approach produces values consistent with existing cost-effectiveness analyses. Our results suggest that biomarker value is mostly driven by the clinical efficacy of the targeted agent. A user-friendly web tool for complete TICER analysis has been made available for open use at http://medicine.yale.edu/lab/pusztai/ticer/.
Keywords: Decision analysis, Breast cancer, Outcomes, Research, Comparative effectiveness, OncotypeDX
Introduction
In 2010, health care spending in the United States was projected to be $2.6 trillion, corresponding to 18 % of the gross domestic national product [1]. While national health care expenses are extensive compared to other countries, this spending has not yielded commensurate improvements in health care outcomes [2, 3]. This problem is epitomized in the management of cancer: the field of oncology has benefited from breakthroughs in targeted therapy significantly improving outcomes in specific populations of cancer patients [4–6]. On one hand, these results demonstrate the promise of personalized therapy. On the other hand, this optimism is tempered by soaring costs of targeted agents. Cancer care is responsible for 5 % of the GDP, and these expenditures are projected to increase by forty percent by 2020 [7]. Driven by these concerns, the American Society of Clinical Oncology (ASCO) has proposed a formal framework to promote and guide value– conscious interactions between patient and oncologist [8].
To parallel these broad efforts, we consider the value of biomarker-guided therapeutic interventions in terms of their downstream costs and resulting clinical outcomes, compared to the current standard-of-care treatments. A facet of this value assessment is clinical utility, which describes the difference in clinical outcomes between biomarker-negative and -positive patients along with changes in quality of life, and depends on biomarker characteristics and on the availability of effective biomarker-driven therapies. Our goal is to propose and validate a framework that incorporates biomarker prevalence, quality-of-life metrics, and test- and treatment-associated costs to efficiently assess the cost effectiveness of biomarker-guided targeted therapeutic interventions.
Traditional cost-effectiveness approaches employ “state-transition models” and comprehensively consider the costs, benefits, durations, and transition probabilities through sequential health states over the entire projected course of the disease [9–11]. Such methods have been used extensively to evaluate the cost effectiveness of many therapeutic interventions and treatment programs [12–16] in oncology [16–20]. However, estimation of the health state-transition probabilities required by these models is generally complicated and can vary across clinical scenarios [21]. Additionally, these analyses involve rigorous documentation of cost states, which precludes meaningful analysis until these data become available. Moreover, some authors have suggested that the complexity of these methods may introduce bias into the analysis [22].
Here we propose a simplified framework that limits the extent of external data inputs by utilizing parameters readily reported in clinical trials, thus increasing the accessibility of cost-effectiveness analyses to clinical investigators. The main differences between our approach and the traditional methods are documented in Table 1. We derive an index, referred to as test incremental cost-effectiveness ratio (TICER), which we then apply to several predictive biomarker-driven therapeutic scenarios to compare our estimates with those obtained from traditional cost-effectiveness approaches. These biomarkers include HER2 amplification to determine inclusion of trastuzumab in the treatment of breast cancer, rearrangement of the anaplastic lymphoma receptor tyrosine kinase (ALK) to select patients with lung cancer for crizotinib therapy, and the OncotypeDX gene expression assay in estrogen receptor (ER)-positive breast cancer to identify low-risk patients who may be spared from adjuvant chemotherapy.
Table 1.
Model summary
| Traditional method State-transition model |
Proposed method:
“TICER” Simplified decision-analytic model |
|
|---|---|---|
| Model type | Stochastic Model format is specific to clinical scenario of interest |
Deterministic Baseline model flexible to many scenarios, with considerations of easily documented assumptions |
| Health states | Requires derivation of transition probabilities, which are difficult to generalize across patient demographics and clinical scenarios [21] | Time spent in health state based on
directly measurable clinical outcomes Treatment time, progression-free survival, overall survival |
| Test characteristics | Sensitivity, specificity explicitly incorporated into model | Sensitivity and specificity implicitly affect clinical outcomes PFS, OS inputs are based on actual data, where patients are stratified based on biomarker characteristics |
| Cost reporting | Detailed cost
analysis Including costs of travel, patient time, side effect monitoring |
Only key cost inputs: cost of
treatment, testing, standard therapy, progression (where
applicable) Simple, directly reported Supportive/maintenance costs are assumed to be negligible between treatment arms |
| Quality of life | Inputs derived from clinical trial, or quality-of-life source specific to clinical scenario | Inputs derived from clinical trial, or quality-of-life source specific to clinical scenario |
| Presentation of results | Base case ICER, cost-effectiveness acceptability curves, cost-benefit plane | Base case ICER, cost-effectiveness
acceptability curves, cost-benefit plane Ability to suggest treatment cost needed to satisfy a range of willingness-to-pay thresholds |
| Suggested function | Require detailed data inputs and more
intensive computational resources Comprehensive cost-effectiveness analysis after robust (Phase III) data available |
Allow cost-effectiveness analysis
with limited data inputs Ease of implementation allows streamlined cost-effectiveness estimates even if comprehensive data are unavailable (for example, after Phase I clinical trials) Potential precursor to state-transition models Available as web-accessible tool |
The differences between the commonly used state-transition cost-effectiveness analyses and our proposed simplification are detailed in the table above. The traditional models require consideration of comprehensive cost inputs and derivation of state-transition probabilities; this level of detail precludes preliminary cost effectiveness when these values are not defined. We propose to implement a simplified model with limited data inputs (biomarker prevalence, clinical outcomes, quality of life, costs of testing and targeted therapy). This approach would be potentially useful in early biomarker development, when comprehensive data are not available
The simplicity of our approach may allow for preliminary cost-effectiveness analysis at an earlier stage of biomarker development. To demonstrate this, we analyze an emerging biomarker that has not yet been assessed with a phase III clinical trial. We examine ROS proto-oncogene 1, receptor tyrosine kinase (ROS1) to select lung cancer patients for crizotinib therapy in the first-line setting [23]. Finally, we perform sensitivity analyses to assess how each input variable (biomarker prevalence, clinical outcomes, quality of life, costs of testing and therapy) affects the cost effectiveness of the biomarker and the corresponding therapy. A greater understanding of cost-effectiveness drivers will allow more informed and value-focused bio-marker development. To enable clinicians utilize our cost-effectiveness analysis in new scenarios, we have made it available as an open-access user-friendly web tool at http://medicine.yale.edu/lab/pusztai/ticer/.
Methods
The TICER index
We consider a simple decision tree-based scenario, the general form of which is shown in Fig. 1a. The first branch-point in the model is the decision to conduct biomarker testing. The model is flexible and can address a variety of biomarker scenarios, including guiding administration of a novel treatment relative to standard of care (i.e., HER2- guided trastuzumab treatment), or sparing therapy in patients who may not benefit from it. If no testing occurs, all patients receive the standard-of-care therapy for the given situation. If tested, marker-positive patients receive an add-on targeted drug along with standard therapy, while the marker-negative cases receive the standard-of-care alone. Alternatively, the test can be used to screen out patients who may not benefit from the targeted therapy. In this scenario, under no testing everyone is treated with standard of care (e.g., chemo-endocrine therapy in ER-positive breast cancer), whereas if tested, marker-negative patients are spared of the non-beneficial treatment.
Fig. 1.
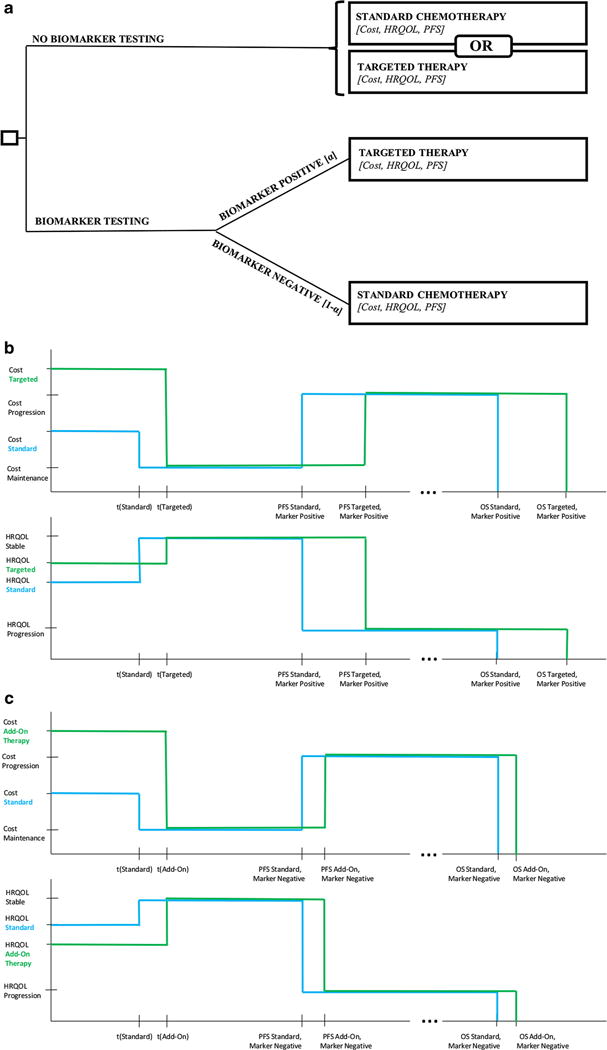
Model schematic a Simple decision framework to guide treatment with biomarker testing, as compared to no biomarker testing. If testing is performed, the biomarker prevalence a determines the proportion of patients for which a specific therapy is added or spared. Each endpoint is a clinical state corresponding to the patient’s progression-free survival, overall survival, as well as associated costs and HRQOL. b Cost (top) and HRQOL profile (bottom) when the default treatment is standard therapy. We consider treatment time t for targeted therapy, t (targeted), for standard therapy, t (standard), post-treatment stable disease (from t to PFS), and disease progression (PFS to OS) for both treatment arms. TICER essentially compares the median difference in quality-adjusted outcomes (PFS and OS) in biomarker-positive patients to the cost difference between treatment arms. c Cost (top) and HRQOL profile (bottom) when the default treatment is a certain therapy, and testing serves to spare this treatment in biomarker-negative patients. We consider a similar progression through treatment time, stable disease, and progression as (b). We effectively compare cost, HRQOL difference, and any difference in median PFS and OS for add-on therapy and standard therapy in biomarker-negative patients
We next outline the key steps in our method, while the detailed derivation of our index is given in the Supplementary materials. We first consider the incremental cost-effectiveness ratio (ICER) of the testing decision, a commonly expressed index in cost-effectiveness analysis [24], which when applied to our biomarker-test scenario gives
| (1) |
Here, QALY is quality-adjusted life years (Eq. A.1 in the Supplement).
After considering the incremental cost (numerator) based on the cost and quality-of-life states outlined in Fig. 1b–c (see Fig. S1 for details), we see it can be simply expressed as the difference between the areas under the cost profile, divided by the difference between the areas under the quality-of-life profile. Figure 1b can be used to analyze the cost effectiveness of biomarker-guided targeted therapy relative to standard-of-care by comparing the difference between targeted and standard therapy in biomarker-positive patients. In Fig. 1c, the difference between testing and non-testing arms simplifies to a comparison of targeted and standard therapy in biomarker-negative patients. The algebraic derivation of TICER expressions for both default scenarios is detailed in the Supplement.
Parameter identification
Figure 2 depicts a template that we provide to guide identification of the necessary data inputs required for the TICER calculation. The relevant parameters for commonly employed biomarkers are easily obtained from clinical trials reporting median PFS (and median OS, where available) for standard-of-care and marker-directed targeted therapies. For our analysis, priority was given to sources referenced by existing cost-effectiveness analyses (CEA), in order to facilitate comparison of our results with published CEA literature. For the purpose of comparison, our costs were derived from published CEA and converted to 2015 USD. If the user wishes to analyze a situation for which a published CEA does not exist, comprehensive cost values are found using cost database (such as hospital-specific Medicare reimbursement rates or Red Book data-base). Quality-of-life measures were obtained from clinical trials (where possible), or alternatively, meta-analyses and compendiums on the subject [25–27].
Fig. 2.
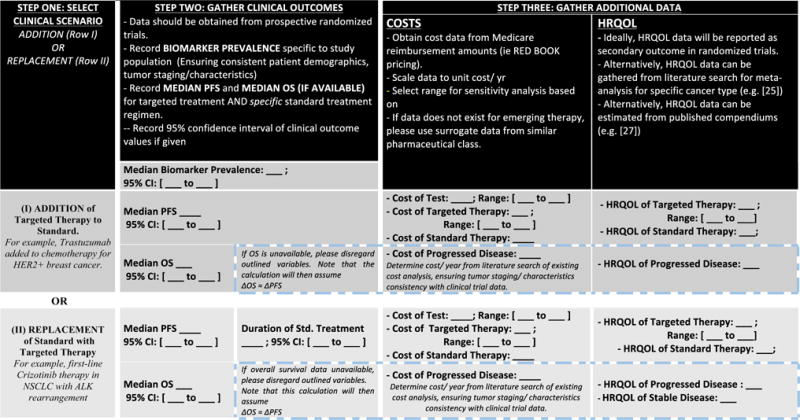
TICER data input template. This figure guides the reader in the data collection process. Step one involves the decision of clinical scenario considered (addition of targeted treatment to standard-of-care therapy or replacement of standard therapy with targeted treatment). Step two involves collection of clinical outcome data from a randomized clinical trial. Step three guides the reader on the remaining data needed, depending on availability of overall survival data
The range evaluated in sensitivity analyses was either derived from the 95 % confidence interval of clinical outcome estimates (PFS and OS), or set to the range used in the published CEA. These ranges aim to capture the uncertainty and variation in the estimate of each parameter. For example, the base case HER2 biomarker testing cost corresponds to Medicare reimbursement for HercepTest (as the clinical outcomes were obtained by grouping patients by immunohistochemistry staining): $120 USD. The sensitivity range ($75-500 USD) captures the cost of FISH testing ($380 USD [18]), as well as reflex FISH testing if IHC is equivocal ($180 USD, assuming 12 % of IHC stains are equivocal [28]).
Cost-effectiveness analysis for a range of scenarios
To evaluate the sensitivity of the cost-effectiveness calculation to the uncertainly in data inputs, we compute cost-effectiveness acceptability curves (CEACs) [29]. These are generated by randomly sampling all parameters from their respective distributions over 10,000 iterations. We assumed that the median PFS and median OS follow a normal distribution, costs follow a log-normal distribution, while HRQOL and biomarker prevalence (α) follow a beta distribution [30]. The incremental costs of testing and corresponding treatment (ΔCost, numerator) and incremental QALYs (ΔQALY, denominator) were also evaluated separately.
Sensitivity analyses
To evaluate the effect of each variable on TICER in the context of all other variables, we assign a range to a parameter of interest, as explained above. Fifty sequential values are generated from within this range, and for each value TICER is computed 2000 times with all remaining parameters sampled from their respective distributions. The median TICER obtained for each of these sequential values of the variable of interest is calculated and recorded. The range of the median TICER values for each variable is summarized in the sensitivity graph. The corresponding interquartile ranges for each value of the variable of interest can also be depicted, as shown in Fig. S2. To account for potentially confounding effects of uncertainty in literature-reported values, we selected an extended range from 0.75 to 1.25 of the reported base case of each variable (Fig. S4).
Application of TICER to recent clinical trials
To demonstrate the practicality of TICER in estimating the cost effectiveness of novel biomarker tests, we evaluated ROS1 rearrangement patients with locally advanced or metastatic lung cancer in the first-line setting. We estimated the median PFS by considering a recent Phase I clinical trial, which was not restricted to first-line therapy [23]. Therefore, this represents a conservative estimate. Additionally, outcomes of standard treatment and HRQOL states were estimated from a recent Phase III clinical trial evaluating ALK-guided crizotinib therapy in a similar patient population [6]. Relevant costs were obtained from existing CEA of ALK-guided crizotinib therapy [19]. Therefore, we assume that the costs, outcomes, and quality-of-life changes are similar between ALK-positive and ROS1-positive patients.
Results
Case studies and parameter identification
Table 2 summarizes the parameter inputs for the cost-effectiveness scenarios evaluated. Biomarker prevalence ranges from 0.04 (in the instance of ALK translocation) to 0.25 (for HER2+ breast cancer). Median PFS estimates were directly obtained from literature-reported values. In the HER2 scenario, biomarker positivity resulted in adding HER2-targeted therapy to standard of care. In the ALK and ROS1 scenarios, biomarker positivity resulted in replacement of standard therapy with targeted therapy. In the OncotypeDX scenario, the presence of “Low Recurrence Score” biomarker results in chemotherapy sparing, rather than addition.
Table 2.
Model inputs
| Biomarker | Disease population and biomarker prevalence (95 % CI) | Therapy | PFS and OS in months (range tested in sensitivity analysis) | Health-related quality of life (range tested in sensitivity analysis) | ||||||
|---|---|---|---|---|---|---|---|---|---|---|
|
|
|
|
||||||||
| Standard therapy | Targeted therapy | Standard therapy | Targeted therapy | Ref | Std. therapy | Targeted therapy | Prog. Dis. | Ref | ||
| HER2+ | Metastatic breast cancer | AC/P | AC/P + trastuzumab | PFS: 4.60 | 7.80 (5.00–9.00) | [4] | 0.60 | 0.67 (0.58–0.82) | 0.4 | [29] |
| 0.25 (0.15–0.30) | OS: 20.3 | 25.1 (17.7–26.5) | ||||||||
| ALK translocation | Late-stage NSCLC | Pemetrexed, cisplatin | Crizotinib | PFS: 7.00 | 10.9 (8.3–13.9) | [6] | 0.53 | 0.67 (0.55–0.79)b | 0.47 | [6, 25] |
| 0.04 (0.03–0.14) | OS: N/A | N/A | ||||||||
| OncotypeDX (low-risk recurrence score) | Early-stage breast cancer | Chemotherapy + tamoxifena | Tamoxifen (for 5 years) | PFS: N/Ac | PFS: N/A | [31] | 0.60 | 0.82 (0.46–1.00) | N/A | [26, 27] |
| 0.51 (0.50–0.59) | ||||||||||
| ROS1 translocationd | Late-stage NSCLC | Pemetrexed, cisplatin | Crizotinib | PFS: 7.00 | 19.2 (14.5–23.9) | [23, 6] | 0.53 | 0.67 (0.55–0.79) | N/A | [25, 26] |
| 0.01 (0.10–0.30) | OS: N/A | N/A | ||||||||
| Biomarker | Disease population and biomarker prevalence (95 % CI) | Cost (range tested in sensitivity analysis) | ||||
|---|---|---|---|---|---|---|
|
| ||||||
| Standard therapy ($USD/year) | Targeted therapy ($USD/year) | Cost of test ($USD) | Cost prog ($USD/year) | Ref | ||
| HER2+ | Metastatic breast cancer | N/A | 52,200 (22,600–67,800) | 120 (75–500) | 29,800 | [18] |
| 0.25 (0.15–0.30) | ||||||
| ALK translocation | Late-stage NSCLC | 83,300 | 100,300 (71,000–130,800) | 330 (270–500) | N/A | [19, 33] |
| 0.04 (0.03–0.14) | ||||||
| OncotypeDX | Early-stage breast cancer | 27,520 | 804 (660–881) | 4400 (3300–5500) | N/A | [34, 35] |
| (low-risk recurrence score) | 0.51 (0.50–0.59) | |||||
| ROS1 translocationd | Late-stage NSCLC | 83,300 | 100,300 (71,000–130,800) | 330 (270–500) | N/A | [19, 33] |
| 0.01 (0.10–0.30) | ||||||
Input parameters as obtained from literature sources. The range tested in sensitivity analysis is defined as the 95 % confidence interval of the variable of interest, when available. Otherwise, the range used in the cited cost-effectiveness analysis is utilized. Further assumptions and currency conversions are documented in Supplementary Table 1–3
Cost and outcome data were derived from published data representing a variety of OncotypeDX-guided chemotherapy regimens. The specific distribution of treatments is detailed in Supplementary Table 2
HRQOL values for ALK is estimated from baseline HRQOL and the DHRQOL reported in the original trial. Standard deviation for DHRQOL is not reported; it is assumed to be consistent with compared cost-effectiveness analysis. [6]
OncotypeDX involves a curative-intent scenario, where the progression-free survival is replaced with TEndo, representing the time period of endocrine therapy treatment
ROS1-guided crizotinib therapy in the first-line setting represents a clinical situation which does not have phase III clinical trial data available. We estimated the median PFS by considering a recent phase I clinical trial, which was not restricted to first-line therapy. Costs, outcomes, and quality-of-life states of standard therapy are equivalent to the ALK case study
Cost-effectiveness analysis of established biomarkers
For the biomarker scenarios considered, the incremental cost of HER2 biomarker was $9740 (standard deviation [SD] $3030) with a corresponding ΔQALY of 0.0625 (SD 0.029) and an ICER of 149,600 $USD/QALY. For the ALK biomarker, the incremental cost was $2550 (SD $1770), while the base case ΔQALY was 0.0116 (SD 0.009), with an ICER of 222,000 $USD/QALY. Finally, for OncotypeDX the incremental cost was $385 (SD $360), while the base case ΔQALY was 0.039 (SD 0.014), with an ICER of 11,600 $USD/QALY.
To assess the cost effectiveness of the above scenarios, we plotted the results of separate cost-incremental QALY analysis on a cost-utility plane (Fig. 3), along with common cost-effectiveness threshold values reported in the literature: 50,000, 100,000, and 285,000 $USD/QALY [36]. Biomarkers leading to better outcomes and lower costs and thus lie below a reference line are considered cost-effective with respect to the corresponding cost-effectiveness threshold. OncotypeDX (Fig. 3b) meets every cost-effectiveness threshold due to cost savings and quality-of-life benefit resulting from avoiding chemotherapy. The HER2 biomarker does not meet the $100,000 thresh-old, but is at or below the $285,000 threshold (Fig. 3a). The large variation in the estimates for this scenario is due to relatively high standard deviation for HER2 treatment costs and QALYs, which stems from the relatively high variation in the overall survival term. ALK falls in the region of low incremental cost and low incremental benefit, which limits the resolution of the analysis, but it appears to be distributed around the $285,000 threshold.
Fig. 3.
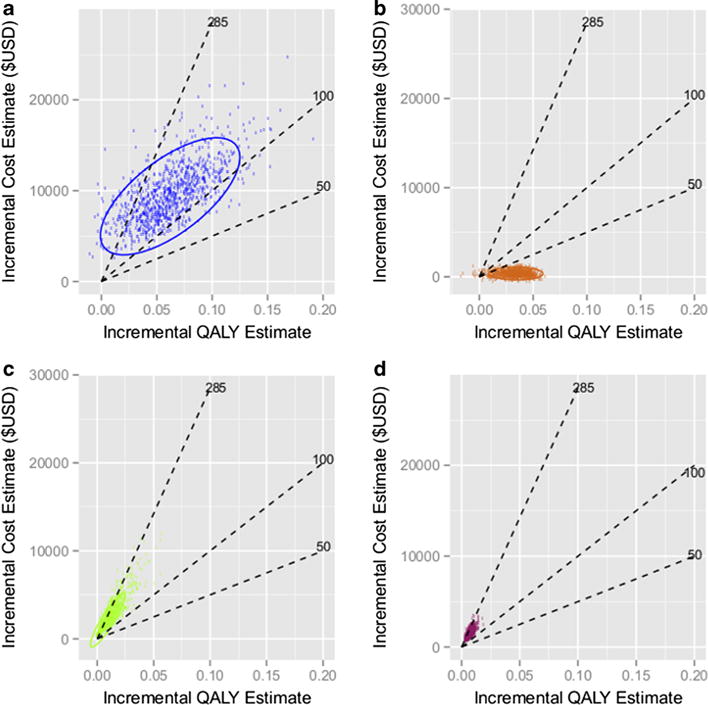
Incremental cost-QALY plane. Scatterplots portray the incremental costs (numerator of TICER) vs. incremental QALY (denominator of TICER) for a HER2-guided Trastuzumab therapy, b OncotypeDX-guided chemotherapy sparing, c ALK-guided crizotinib therapy, and d ROS1-guided crizotinib therapy. A variety of “acceptability” thresholds are plotted (dashed lines, in units of 1000 $USD/QALY). 95 % confidence ellipses are also plotted around the estimated points
Sensitivity analysis of cost-effectiveness scenarios
The results of sensitivity analysis to assess the influence of each of the data inputs to the cost-effectiveness estimate of the various scenarios are presented in Fig. 4. The cost-effectiveness values from the literature (red lines) were within the limits of sensitivity testing. Cost-effectiveness calculations by TICER produce results that are consistent with established methods, while allowing to account for uncertainty in the values of the scenario parameters. Figure S3 displays the overall cost-effectiveness acceptability curves (CEAC) for the evaluated scenarios, accounting for the uncertainty involved in the estimates of the input variables. These curves show how acceptability of a treatment scenario is affected by a range of willingness-to-pay thresholds.
Fig. 4.
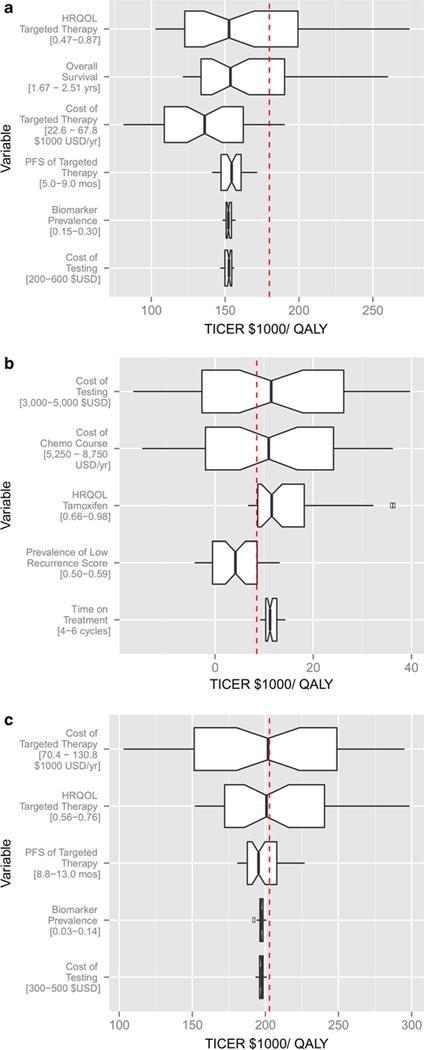
Sensitivity analyses. Sensitivity analysis displays the median TICER for uniformly sampled values of each parameter of interest, averaged over the effect of all other parameters. The range of each parameter tested in sensitivity analysis, as reported in Table 2, is shown underneath each variable. ICER values derived from comprehensive cost-effectiveness analyses in the literature are reported as a reference line for comparison. HER2-guided trastuzumab therapy (a), OncotypeDX-guided chemotherapy sparing (b), and ALK-guided crizotinib therapy (c). The base case TICER for HER2 biomarker was 149,600 $USD/QALY, as compared to the literature value of 180,000 $USD/QALY [18]. The base case for ALK was 222,000 $USD/QALY, as compared to the literature value of 202,800 $USD/QALY [19]. The base case TICER for OncotypeDX was 11,600 $USD/QALY, as compared to the literature value of 8900 $USD/QALY [37]
Generally, TICER is driven by the outcome variables of health-related quality of life (HRQOL) and PFS/OS, and by the cost of therapy. When each variable range was set to be a fixed proportion of the base case value (0.75 to 1.25), this analysis revealed the sensitivity of each variable as it pertained to its position in the equation, rather than the inherent differences in each variable’s uncertainty (Fig. S4). In this analysis, HRQOL and OS contributed to the greatest variation in TICER values. Interestingly, when the cost of targeted treatment is only marginally greater than the cost of standard treatment (i.e., when crizotinib is compared to pemetrexed/cisplatin), the cost of targeted therapy drives the cost-utility analysis to a greater extent (Fig. 4c).
We found that TICER is only marginally sensitive to biomarker prevalence (Fig. 4a, c). When the cost of the targeted therapy is considerably greater than the cost of biomarker testing, as in the case of HER2 and ALK, the biomarker prevalence a effectively drops out of the TICER formula. In the OncotypeDX case, TICER is comparatively more sensitive to changes in cost of testing and chemotherapy, as well as biomarker prevalence (Fig. 4b).
Application of TICER to recent clinical trials
Figure 3d demonstrates ROS1-directed crizotinib therapy on the cost-benefit plane. The base case incremental cost was $1530/year (SD $1060) with a corresponding QALY of 0.0077 (SD 0.0061), with ICER estimate of 205,900 $USD/QALY. Most values are above the $100,000 threshold but below the $285,000 threshold. Figure 5 displays the cost of crizotinib needed to meet a range of cost-effectiveness thresholds, as derived in the Supplement. To meet a threshold of $100,000/QALY, the treatment cost must be below $50,800/year. For a threshold of $285,000/QALY, the treatment cost must be below $125,800/year.
Fig. 5.
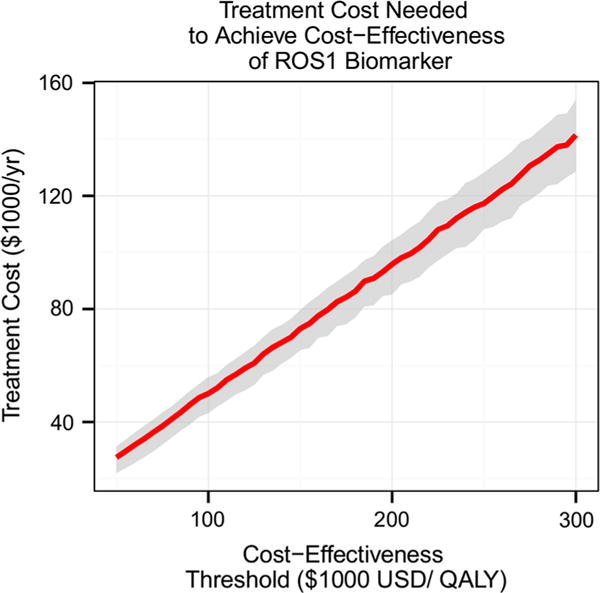
Treatment cost needed to meet a range of cost-effectiveness thresholds. This graph suggests maximum treatment costs that are needed in order to meet a cost-effectiveness threshold defined by the user. For a cost-effectiveness threshold of $100,000 USD/QALY, the treatment cost must be below $50,800 USD/year. For a threshold of $200,000 USD/QALY, the treatment cost must be below $93,400 USD/year
Discussion
A benefit of the proposed approach is the ability to assess cost effectiveness of biomarker-guided treatment scenarios using a simplified but representative decision model requiring six readily quantifiable input variables: marker prevalence, progression-free survival, overall survival, quality of life, and costs of testing and therapy. The model is flexible and allows the user to incorporate in an intuitive way a variety of biomarker scenarios. For example, by considering median PFS and OS times, the TICER method allows simple analysis of relative biomarkers, in which both biomarker-negative and -positive groups experience benefit from targeted therapy. The TICER method can reliably incorporate a variety of treatment types (addition or replacement of standard therapy), and allows comparison to multiple relevant base case treatment scenarios (standard vs. targeted therapy in non-tested patients).
The cost-effectiveness estimates from our method yielded similar results to those reported in the literature using more complex methods. Limitations of our model include the assumption that costs and HRQOL of progressive and stable disease are equivalent, as we do not consider the difference in costs related to adverse events. Additionally, caution should be used in using median PFS as a surrogate for overall outcome when OS data are not available. We also assumed consistency of costs, HRQOL, and clinical outcome data that may have been obtained from a variety of sources. We attempted to account for potential inconsistencies by performing sensitivity analysis over a wide range of parameter values.
Several clinical implications are apparent from the reported analyses. The fact that OncotypeDX meets every relevant willingness-to-pay threshold reflects the cost savings and increased HRQOL benefit of chemotherapy sparing. Our data support OncotypeDX as a clear cost-effective predictive biomarker. While there is considerable subjectivity in the acceptability of ICER values, our data demonstrate that ALK, HER2, and ROS-1 biomarkers are not considered cost-effective by the commonly used $50–100,000 willingness-to-pay thresholds. However, these biomarkers meet the $285,000 threshold, which reflects Medicare’s current acceptability of 1 year of renal dialysis. Using current data inputs, ROS1 exhibits similar cost effectiveness to HER2, which is widely accepted in clinical practice.
Sensitivity analysis suggested that cost-effectiveness esti-mates using our model are most sensitive to survival and quality-of-life inputs, followed closely by the cost of therapy. Biomarker prevalence and testing costs had almost negligible impact under most scenarios. When the cost of biomarker testing is insignificant compared to the cost of targeted therapy, biomarker prevalence effectively cancels from both the numerator and denominator of the TICER index. An exception is seen in the OncotypeDX case, where costs of testing and therapy are of similar magnitude, and thus dominate the TICER levels. Another exception was observed in the ALK case, where the difference between costs of targeted therapy and chemotherapy was narrow. These results have broad implications for value-driven decision making. Development of predictive biomarkers should focus on optimizing test characteristics to clearly classify patients into groups that are most likely to benefit or not from targeted therapy. The clinical outcome benefits resulting from attaining optimal test characteristics (represented in our model as achievement of the greatest PFS, OS, and HRQOL benefit) generally appear to justify the associated biomarker testing costs.
The disproportionately large impact of clinical outcome measures and HRQOL on ICER has been observed in previous studies [19, 20]. A few other studies have suggested a dominant impact of test specificity/sensitivity on cost effectiveness [18, 20]. Our derivation differs from these analyses, as in TICER the analytical performance of the biomarker-based test is implicitly included in the difference in clinical outcomes between the marker-positive and -negative groups. TICER’s strong sensitivity on HRQOL is primarily due to the broad range of reported HRQOL values, which may be the least objectively measurable value among our input variables. This underscores the importance of more research to focus on HRQOL methodology, and standardization of assessment tools, as well as the importance of reporting standardized HRQOL measures as a secondary outcome in clinical trials.
The TICER approach employs a simplified decision-analytic model to create a flexible, accessible cost-effectiveness analysis of predictive biomarkers in oncology. It produces results that are consistent with more detailed state-transition models. Our method suggests that the value of a biomarker is primarily driven by efficacy of the targeted agent in the biomarker-positive group, followed closely by treatment costs; cost of testing plays a comparatively smaller role. TICER will be a potentially useful tool for assisting in cost-effectiveness analysis at an early stage of biomarker development. To facilitate adoption of the proposed approach, we have developed a web-based tool that can perform the cost-benefit and sensitivity analyses described in this article for various biomarker-driven scenarios (http://medicine.yale.edu/lab/pusztai/ticer/).
Supplementary Material
Acknowledgments
The authors thank Weiwei Shi, Tingting Jiang, Vikram Wali, James Platt, Tomoko Kurita, Bilge Aktas for technical assistance and constructive discussions.
Funding This study was supported by the National Center for Advancing Translational Sciences of the National Institutes of Health [TL1TR000141 to A.S.], Associazione Italiana per la Ricerca sul Cancro [MFGA 13428 to G.B.].
Footnotes
Electronic supplementary material The online version of this article (doi:10.1007/s10549-016-3677-3) contains supplementary material, which is available to authorized users.
Compliance with ethical standards
Conflicts of Interest The authors of this study have no conflicts of interest to disclose.
References
- 1.Scalo JF, Rascati KL. Trends and issues in oncology costs. Expert Rev Pharmacoecon Outcomes Res. 2014;14(1):35–44. doi: 10.1586/14737167.2014.864561. [DOI] [PubMed] [Google Scholar]
- 2.Fund C. Why not the best?: results from the National Scorecard on US Health System Performance 2008. Common-wealth Fund; New York: 2008. [Google Scholar]
- 3.Woolf SH, Aron L. U.S. Health in International perspective: shorter lives, poorer health. In: Woolf SH, Aron L, editors. The National academies collection: reports funded by National Institutes of Health. Institute of Medicine of the National Academies; Washington: 2013. [PubMed] [Google Scholar]
- 4.Slamon DJ, Leyland-Jones B, Shak S, Fuchs H, Paton V, Bajamonde A, Fleming T, Eiermann W, Wolter J, Pegram M, Baselga J, Norton L. Use of chemotherapy plus a monoclonal antibody against HER2 for metastatic breast cancer that overexpresses HER2. N Engl J Med. 2001;344(11):783–792. doi: 10.1056/NEJM200103153441101. [DOI] [PubMed] [Google Scholar]
- 5.Herbst RS, Soria JC, Kowanetz M, Fine GD, Hamid O, Gordon MS, Sosman JA, McDermott DF, Powderly JD, Gettinger SN, Kohrt HE, Horn L, Lawrence DP, Rost S, Leabman M, Xiao Y, Mokatrin A, Koeppen H, Hegde PS, Mellman I, Chen DS, Hodi FS. Predictive correlates of response to the anti-PD-L1 antibody MPDL3280A in cancer patients. Nature. 2014;515(7528):563–567. doi: 10.1038/nature14011. [DOI] [PMC free article] [PubMed] [Google Scholar]
- 6.Solomon BJ, Mok T, Kim DW, Wu YL, Nakagawa K, Mekhail T, Felip E, Cappuzzo F, Paolini J, Usari T, Iyer S, Reisman A, Wilner KD, Tursi J, Blackhall F, Investigators P First-line crizotinib versus chemotherapy in ALK-positive lung cancer. N Engl J Med. 2014;371(23):2167–2177. doi: 10.1056/NEJMoa1408440. [DOI] [PubMed] [Google Scholar]
- 7.Mariotto AB, Yabroff KR, Shao Y, Feuer EJ, Brown ML. Projections of the cost of cancer care in the United States: 2010–2020. J Natl Cancer Inst. 2011;103(2):117–128. doi: 10.1093/jnci/djq495. [DOI] [PMC free article] [PubMed] [Google Scholar]
- 8.Schnipper LE, Davidson NE, Wollins DS, Tyne C, Blayney DW, Blum D, Dicker AP, Ganz PA, Hoverman JR, Langdon R, Lyman GH, Meropol NJ, Mulvey T, Newcomer L, Peppercorn J, Polite B, Raghavan D, Rossi G, Saltz L, Schrag D, Smith TJ, Yu PP, Hudis CA, Schilsky RL. American Society of Clinical Oncology Statement: a conceptual framework to assess the value of cancer treatment options. J Clin Oncol. 2015 doi: 10.1200/JCO.2015.61.6706. [DOI] [PMC free article] [PubMed] [Google Scholar]
- 9.Mushlin AI, Ruchlin HS, Callahan MA. Cost effectiveness of diagnostic tests. Lancet. 2001;358(9290):1353–1355. doi: 10.1016/S0140-6736(01)06417-0. [DOI] [PubMed] [Google Scholar]
- 10.Drummond MF, Sculpher MJ, Torrance GW, O’Brien BJ, Stoddart GL. Methods for the economic evaluation of health care programmes. OUP Catalogue; Oxford: 2005. [Google Scholar]
- 11.Garber AM. Advances in cost-effectiveness analysis of health interventions. Handb Health Econ. 2000;1:181–221. [Google Scholar]
- 12.Rochau U, Jahn B, Qerimi V, Burger EA, Kurzthaler C, Kluibenschaedl M, Willenbacher E, Gastl G, Willenbacher W, Siebert U. Decision-analytic modeling studies: an overview for clinicians using multiple myeloma as an example. Crit Rev Oncol Hematol. 2014 doi: 10.1016/j.critrevonc.2014.12.017. [DOI] [PubMed] [Google Scholar]
- 13.Warner KE, Hutton RC. Cost-benefit and cost-effectiveness analysis in health care. Growth and composition of the literature. Med Care. 1980;18(11):1069–1084. doi: 10.1097/00005650-198011000-00001. [DOI] [PubMed] [Google Scholar]
- 14.Stason WB, Weinstein MC. Public-health rounds at the Harvard School of Public Health. Allocation of resources to manage hypertension. N Engl J Med. 1977;296(13):732–739. doi: 10.1056/NEJM197703312961307. [DOI] [PubMed] [Google Scholar]
- 15.Bennett WM. Cost-benefit ratio of pretransplant bilateral nephrectomy. JAMA. 1976;235(16):1703–1704. [PubMed] [Google Scholar]
- 16.Hillner BE. Review of cost-effectiveness assessments of chemotherapy in adjuvant and advanced breast cancer. Anti-cancer Drugs. 1998;9(10):843–847. doi: 10.1097/00001813-199811000-00003. [DOI] [PubMed] [Google Scholar]
- 17.Earle CC, Chapman RH, Baker CS, Bell CM, Stone PW, Sandberg EA, Neumann PJ. Systematic overview of cost-utility assessments in oncology. J Clin Oncol. 2000;18(18):3302–3317. doi: 10.1200/JCO.2000.18.18.3302. [DOI] [PubMed] [Google Scholar]
- 18.Elkin EB, Weinstein MC, Winer EP, Kuntz KM, Schnitt SJ, Weeks JC. HER-2 testing and trastuzumab therapy for metastatic breast cancer: a cost-effectiveness analysis. J Clin Oncol. 2004;22(5):854–863. doi: 10.1200/JCO.2004.04.158. [DOI] [PubMed] [Google Scholar]
- 19.Djalalov S, Beca J, Hoch JS, Krahn M, Tsao M-S, Cutz J-C, Leighl NB. Cost effectiveness of EML4-ALK fusion testing and first-line crizotinib treatment for patients with advanced ALK-positive non–small-cell lung cancer. J Clin Oncol. 2014;32(10):1012–1019. doi: 10.1200/JCO.2013.53.1186. [DOI] [PubMed] [Google Scholar]
- 20.Tsoi DT, Inoue M, Kelly CM, Verma S, Pritchard KI. Cost-effectiveness analysis of recurrence score-guided treatment using a 21-gene assay in early breast cancer. Oncologist. 2010;15(5):457–465. doi: 10.1634/theoncologist.2009-0275. [DOI] [PMC free article] [PubMed] [Google Scholar]
- 21.Benbassat J, Zajicek G, van Oortmarssen GJ, Ben-Dov I, Eckman MH. Inaccuracies in estimates of life expectancies of patients with bronchial cancer in clinical decision making. Med Decis Mak. 1993;13(3):237–244. doi: 10.1177/0272989X9301300310. [DOI] [PubMed] [Google Scholar]
- 22.John-Baptiste AA, Bell C. A glimpse into the black box of cost-effectiveness analyses. Can Med Assoc J. 2011;183(6):E307–E308. doi: 10.1503/cmaj.110384. [DOI] [PMC free article] [PubMed] [Google Scholar]
- 23.Shaw AT, Solomon BJ. Crizotinib in ROS1-rearranged non-small-cell lung cancer. N Engl J Med. 2015;372(7):683–684. doi: 10.1056/NEJMc1415359. [DOI] [PubMed] [Google Scholar]
- 24.Detsky AS, Naglie IG. A clinician’s guide to cost-effectiveness analysis. Ann Intern Med. 1990;113(2):147–154. doi: 10.7326/0003-4819-113-2-147. [DOI] [PubMed] [Google Scholar]
- 25.Nafees B, Stafford M, Gavriel S, Bhalla S, Watkins J. Health state utilities for non small cell lung cancer. Health Qual Life Outcomes. 2008;6(84):84. doi: 10.1186/1477-7525-6-84. [DOI] [PMC free article] [PubMed] [Google Scholar]
- 26.de Koning HJ, van Ineveld BM, van Oortmarssen GJ, de Haes JC, Collette HJ, Hendriks JH, van der Maas PJ. Breast cancer screening and cost-effectiveness; policy alternatives, quality of life considerations and the possible impact of uncertain factors. Int J Cancer. 1991;49(4):531–537. doi: 10.1002/ijc.2910490410. [DOI] [PubMed] [Google Scholar]
- 27.Tengs TO, Wallace A. One thousand health-related quality-of-life estimates. Med care. 2000;38:583–637. doi: 10.1097/00005650-200006000-00004. [DOI] [PubMed] [Google Scholar]
- 28.Vergara-Lluri ME, Moatamed NA, Hong E, Apple SK. High concordance between HercepTest immunohistochemistry and ERBB2 fluorescence in situ hybridization before and after implementation of American Society of Clinical Oncology/College of American Pathology 2007 guidelines. Mod Pathol. 2012;25(10):1326–1332. doi: 10.1038/modpathol.2012.93. [DOI] [PubMed] [Google Scholar]
- 29.Fenwick E, Byford S. A guide to cost-effectiveness acceptability curves. Brit J Psychiat. 2005;187:106–108. doi: 10.1192/bjp.187.2.106. [DOI] [PubMed] [Google Scholar]
- 30.Hunger M, Doring A, Holle R. Longitudinal beta regression models for analyzing health-related quality of life scores over time. BMC Med Res Methodol. 2012;12:144. doi: 10.1186/1471-2288-12-144. [DOI] [PMC free article] [PubMed] [Google Scholar]
- 31.Burstein HJ, Temin S, Anderson H, Buchholz TA, Davidson NE, Gelmon KE, Giordano SH, Hudis CA, Rowden D, Solky AJ, Stearns V, Winer EP, Griggs JJ. Adjuvant endocrine therapy for women with hormone receptor-positive breast cancer: american society of clinical oncology clinical practice guideline focused update. J clin oncol. 2014;32(21):2255–2269. doi: 10.1200/JCO.2013.54.2258. [DOI] [PMC free article] [PubMed] [Google Scholar]
- 32.Rugo H, Brammer M, Zhang F, Lalla D. Effect of trastuzumab on health-related quality of life in patients with HER2-positive metastatic breast cancer: data from three clinical trials. Clin Breast Cancer. 2010;10(4):288–293. doi: 10.3816/CBC.2010.n.037. [DOI] [PubMed] [Google Scholar]
- 33.Handorf EA, McElligott S, Vachani A, Langer CJ, Bristol Demeter M, Armstrong K, Asch DA. Cost effectiveness of personalized therapy for first-line treatment of stage IV and recurrent incurable adenocarcinoma of the lung. J oncol pract. 2012;8(5):267–274. doi: 10.1200/JOP.2011.000502. [DOI] [PMC free article] [PubMed] [Google Scholar]
- 34.Flanagan MB, Dabbs DJ, Brufsky AM, Beriwal S, Bhargava R. Histopathologic variables predict Oncotype DX recurrence score. Mod pathol. 2008;21(10):1255–1261. doi: 10.1038/modpathol.2008.54. [DOI] [PubMed] [Google Scholar]
- 35.Hornberger J, Chien R, Krebs K, Hochheiser L. US insurance program’s experience with a multigene assay for early-stage breast cancer. J oncol pract. 2011;7(3 Suppl):e38s–e45s. doi: 10.1200/JOP.2011.000303. [DOI] [PMC free article] [PubMed] [Google Scholar]
- 36.Gafni A, Birch S. Incremental cost-effectiveness ratios (ICERs): the silence of the lambda. Soc Sci Med. 2006;62(9):2091–2100. doi: 10.1016/j.socscimed.2005.10.023. [DOI] [PubMed] [Google Scholar]
- 37.Hall PS, McCabe C, Stein RC, Cameron D. Economic evaluation of genomic test-directed chemotherapy for early-stage lymph node-positive breast cancer. J Natl Cancer Inst. 2012;104(1):56–66. doi: 10.1093/jnci/djr484. [DOI] [PubMed] [Google Scholar]
Associated Data
This section collects any data citations, data availability statements, or supplementary materials included in this article.