Abstract
BACKGROUND:
Stargardt disease, a juvenile retinal dystrophy, may show secondary changes in the choroid which may have importance while considering future treatments such as stem cell transplant.
OBJECTIVE:
To evaluate the choroidal and retinal morphology in patients with Stargardt disease and compare with age-matched normals.
SETTING AND DESIGN:
This was a case–control study at a tertiary level eye care institute.
METHODS:
Twenty-six patients (52 eyes) clinically diagnosed with Stargardt disease underwent detailed evaluation with swept-source optical coherence tomography. Retinal and choroidal layers were analyzed and compared with 52 eyes of controls.
RESULTS:
The median age of patients with Stargardt disease was 23 years. The mean best-corrected visual acuity was 0.82 logMAR (20/125 Snellen). Mean diameter of the lesion was 2810.92 ± 1311.15 μ. The lesion size increased with increasing extent of flecks and was significantly correlated with visual acuity (r = 0.622, P < 0.001). The retinal and choroidal thicknesses (CTs) were significantly reduced in Stargardt group. The mean subfoveal CT was 290.59 ± 60.43 μ(range: 184–395) in Stargardt and 331.31 ± 68.90 μ (range: 199–464) in normal group, P = 0.043. CT in Early Treatment Diabetic Retinopathy Study grid pattern showed significant thinning in Stargardt group. The small choroidal vessel (SCV) layer was more affected than the large choroidal vessel (LCV) layer. There was thinning of SCV and thickening of LCV inside the macular lesion. The CT was not correlated to lesion size, extent of flecks, or visual acuity.
CONCLUSIONS:
Stargardt disease shows generalized thinning of the choroid affecting mainly the SCVs. In the macular lesion, there is atrophy of SCV with compensatory dilation of LCV. The visual acuity did not correlate with CT but showed worsening with increasing lesion size and wider extent of flecks.
Keywords: Choriocapillaris atrophy, macular degeneration, optical coherence tomography, photoreceptor degeneration, Stargardt disease
Introduction
Stargardt disease,first described by Karl Stargardt in 1909, is an autosomal recessive macular dystrophy and one of the most commonly inherited juvenile retinal diseases.[1] Its prevalence is estimated at 1 in 8000–10,000.[2,3] It typically presents in childhood or early teenage and leads to macular degeneration. Although there is a wide variation in the phenotype, the retinal examination generally shows beaten-bronze or bull's eye appearance with deep yellowish-white flecks in the macular and perimacular region. In the advanced stages, the vision can be greatly affected leading to legal blindness.
The gene, ABCA4, and its mutation responsible for Stargardt disease were discovered by Allikmets et al.[4] in 1997. It theorized that ABCA4 plays a metabolic role and is responsible for the removal of all-trans-retinal and N-retinylidene-phosphatidylethanolamine from disc membranes after the photobleaching of rhodopsin. The mutant ABCA4 allows these metabolic products to build up in excess resulting in the accumulation of the end product di-retinoid-phosphatidylethanolamine (A2E) in the retinal pigment epithelium (RPE) cells. Studies in the ABCA4 knockout mice have shown that the accumulation of A2E leads to RPE cell death and secondary photoreceptor degeneration.[5]
The RPE has a symbiotic relationship with the choroid. The choriocapillaris provides vascular support to the RPE and the outer retina. The RPE in turn maintains the choriocapillaris health by secreting vascular endothelial growth factor (VEGF) isoforms. Animal studies have shown that the RPE cell death causes choriocapillaris atrophy.[6,7] Thus, there may be a role of choroidal angiopathy in the progression of Stargardt disease. Previous studies have explored the relationship of RPE and choroid in Stargardt disease with the help of spectral-domain optical coherence tomography (SDOCT).[8,9] The SDOCT, a noninvasive procedure, is widely used for studying the pathophysiology of various diseases that affect the retina and choroid.[10,11,12,13,14,15]
Swept-source OCT (SSOCT) is the latest advance in retinal and choroidal imaging.[16] It uses a short cavity, longer wavelength laser that sweeps across a narrow band with each scan. The advantage of an SSOCT is the faster acquisition of images (100,000 A-scans/second compared with 50,000 A-scans/second) over a wider area, with higher axial resolution. Another advantage of the SSOCT is that it provides uniform sensitivity over the entire scan window without any dropoff, with increasing depth, allowing for a high-quality simultaneous imaging of the vitreous, retina, and choroid. Choroidal layers that are hardly distinguishable in conventional SDOCT because of the scattering from the RPE can be visualized well.
With this in mind, we planned a study to explore the choroidal changes in the patients with Stargardt disease and to correlate those changes with the retinal morphology and other phenotypic features of the disease.
Methods
Subjects
Twenty-six patients (52 eyes) who were clinically diagnosed with Stargardt disease on the basis of the inclusion and exclusion criteria were prospectively recruited for the study from Shri Bhagwan Mahavir Vitreoretinal Services, Medical Research Foundation, Chennai, Tamil Nadu, India. Twenty-six age-matched controls (52 eyes) were recruited from the general outpatient department of the Medical Research Foundation, Chennai. The study followed the Declaration of Helsinki, and the approval of the Institutional Review Board of the Medical Research Foundation, Chennai, was obtained. Informed consent was obtained from the patients as well as for the controls.
The diagnosis of Stargardt disease was on the basis of a comprehensive eye examination that included history, subjective and objective refraction, anterior segment examination, intraocular pressure measurement, and dilated fundus examination that revealed a typical beaten-bronze maculopathy with or without surrounding flecks, along with normal disc and vessels. Patients with extensive retinal degenerative changes, bony spicule pigmentation, vascular attenuation, or disc pallor were excluded from the study. Fundus autofluorescence (FAF) and fluorescein angiography were not routinely performed. When available, the FAF revealed absent FAF at the macula in the area of the atrophic lesion. The flecks showed variable FAF with some flecks showing hypoautofluorescence and some showed hyperautofluorescence. Fluorescein angiography revealed patchy hyperfluorescence due to window defect secondary to RPE atrophy at the macula. The flecks revealed hyperfluorescence due to transmission defect. A dark choroid was not always seen. Figure 1 shows a representative patient. Some patients also underwent electroretinography that showed normal rod and cone responses and visual fields that showed central scotoma. Patients with additional retinal pathologies, high refractive errors, high intraocular pressure, or those with a history of any intraocular surgery were excluded. Age-matched healthy controls without any systemic condition or ocular diseases, except for mild refractive errors, were recruited on the basis of screening from the comprehensive eye examination. The controls included in the study had best-corrected visual acuity (BCVA) of 20/20 with normal ocular structures and intraocular pressure.
Figure 1.

(a) Fundus picture of a 16 year old patient diagnosed as Stargardt disease shows beaten metal appearance of macular degeneration. The optic disc and vessels are normal. There are no flecks in this patient. (b) Autofluorescence (fundus autofluorescence) of the same eye reveals absent fundus autofluorescence at the macula. (c) Fluorescein angiography of the same eye shows patchy hyperfluorescence at the macula due to transmission defect secondary to retinal pigment epithelial atrophy
Swept-source optical coherence tomography protocol
All patients underwent SSOCT (DRI OCT-1 Atlantis, Topcon Corporation, Tokyo, Japan). The OCT measurements were taken by a single well-trained examiner. A three-dimensional (3D) 12 mm × 9 mm scan and a 12-mm radial scan comprising 12 line scans spread across 360° were obtained. If the centration was poor because of poor fixation, 9-mm radial scan was taken, which allowed the examiner to manually move the scan in the center of the fovea.
Diameter of the macular lesion
The diameter of the atrophic lesion at the macula was calculated from the average of four measurements in four radial line scans.
Thickness of the inner and outer retinal layers
The central retinal thickness at the fovea was measured. The retinal nerve fiber layer (RNFL), ganglion cell layer (GCL), inner plexiform complex (IPC), outer nuclear layer (ONL), and RPE thickness were measured 500 μ inside the atrophic macular lesion, at the border of the lesion, and 500 μ outside the lesion. The automatic segmentation software available in the instrument was used for these measurements.
Measurements of choroidal layers
The choroidal measurements were taken manually after marking the choroidal scleral interface in the SSOCT scan. The SSOCT gives high-quality, good-resolution images of the choroid, which included its various layers. The junction between the small and the large choroidal vessels (SCVs and LCVs) could be easily identified because of the difference in the reflectivity of these two layers. This demarcation was marked manually and the thickness of the SCVs was measured in a horizontal radial scan. The total choroidal thickness (CT) was similarly measured. The thickness of the LCVs was calculated from the difference between the total CT and the thickness of the SCVs. All these measurements were taken at four locations, viz., subfoveal, 500 μ inside the macular lesion, at the border of the lesion, and 500 μ outside the lesion on the nasal side [Figure 2].
Figure 2.
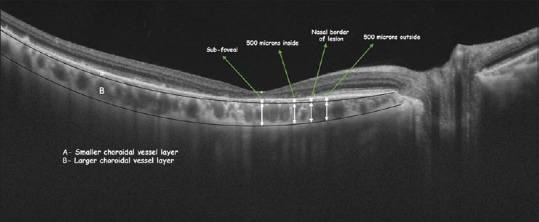
Measurement of choroidal thickness in Stargardt group
The CT was also measured in the Early Treatment Diabetic Retinopathy Study (ETDRS) grid pattern as shown in Figure 3 using the automated measurement software. The 3D scan was used for these measurements. The measurement zones comprised central 1 mm at the fovea surrounded by two rings spanning 3 and 6 mm from the center, which were further divided into superior, inferior, nasal, and temporal zones.
Figure 3.
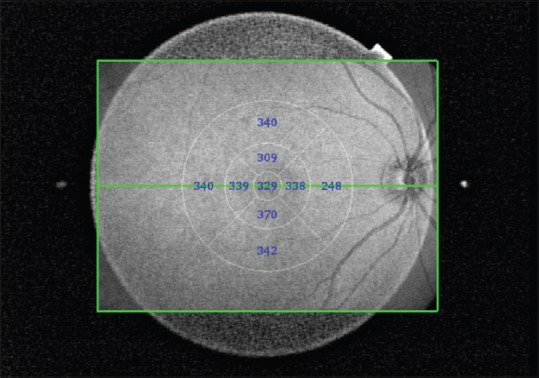
Automated Early Treatment Diabetic Retinopathy Study choroidal thickness map in control eye
Swept-source optical coherence tomography in normal subjects
The thickness of the retinal and choroidal layers was measured at five locations in the normal, healthy age-matched control subjects, viz., at the fovea, and 500 and 1000 μ on either side of the fovea as shown in Figure 4. The horizontal raster scan was chosen for these measurements.
Figure 4.
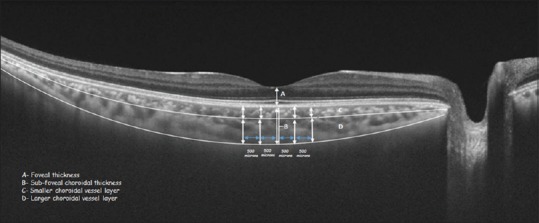
Measurement of choroidal thickness in normal group
Statistical analysis
Statistical analyses were done using the statistical software (released 2013, IBM SPSS Statistics for Windows, version 21.0. IBM Corp., Armonk, NY, USA). One-way analysis of variance on the ranks for parametric data and Kruskal–Wallis for nonparametric data were used to analyze the thickness in more than two groups within the Stargardt disease group, and independent t-test for parametric data and Mann–Whitney test for nonparametric data were used to compare the control group with the Stargardt group.
Results
Twenty-six patients (52 eyes) with Stargardt disease and 26 normal, healthy control subjects (52 eyes) were included in the study. The median age in the Stargardt group was 23 years (range 11–58 years, interquartile distance 18.5) and in the normal group was 26.5 years (range 12–62 years, interquartile distance 27.5) (P = 0.153). The male subjects were 52.94% in the Stargardt group and 42.83% in the normal group. The mean distance BCVA was 0.82 logMAR (20/125 Snellen equivalent) in the Stargardt group and −0.01 logMAR (20/20 Snellen equivalent) in the normal group. Axial length was not measured, but the mean refractive error was −0.55 D (range −4.00–+1.25 D) in Stargardt group and −0.65 D (range −5.25–+3.25 D) in the normal group. The SSOCT scans were performed for all subjects during the afternoon between 11 am and 4 pm. A positive family history was available in 17.65% of the patients with Stargardt disease. The mean duration of Stargardt disease was 7.92 ± 5.73 years.
Retinal layers in Stargardt disease and in normal subjects
Statistically significant differences (P < 0.05) in the thickness of all layers of the retina were noted between the Stargardt and normal group. The mean foveal thickness in Stargardt group was 36.91 ± 20.95 (range: 7–89) μ and in the normal group was 184.73 ± 12.59 (range: 158–207) μ (P < 0.001). All retinal layers showed a gradual decrease in the thickness from outside the lesion to inside the lesion with the border of the lesion as the central variable. The RPE appeared hyperreflective in the area of the lesion.
Choroidal layers in Stargardt disease
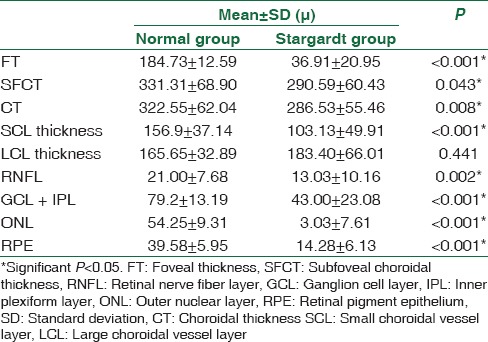
The choroidal–scleral interface as well as the various layers of the choroid could be very well delineated. When compared with the normal group, the choroid was thinner in the patients with Stargardt disease. The mean subfoveal CT was 290.59 ± 60.43 (range: 184–395) μ in the Stargardt group and 331.31 ± 68.90 (range: 199–464) μ in the normal group (P = 0.043). The inbuilt automated thickness mapping software ETDRS grid provides the average thickness in nine sectors around the fovea. Table 1 shows the difference in the mean thicknesses in central 1-, 3-, and 6-mm zones and the four quadrant sectors in the Stargardt group and normal group. Statistically significant P < 0.05 is noted for central 1-mm ring, 3-mm superior sector, and 3-mm temporal sector. No statistically significant difference was noted for the other sectors.
Table 1.
Mean of average choroidal thickness (μ) at 9 sectors in 3 concentric circles of Early Treatment Diabetic Retinopathy Study grid of normal group and Stargardt group

Table 2 shows the comparison of mean retinal and choroidal layer thickness between the normal group and the Stargardt group. Significant differences in the thickness were noted in all the layers of the retina and choroid. The total CT and the thickness of the SCV layer were decreased in the Stargardt group. However, the thickness of the large choroidal vessel layer (LCL) was slightly increased in the Stargardt group; however, it was not statistically significant (P > 0.05).
Table 2.
Mean retinal and choroidal layer thickness at 1000 μ from fovea in normal and Stargardt group
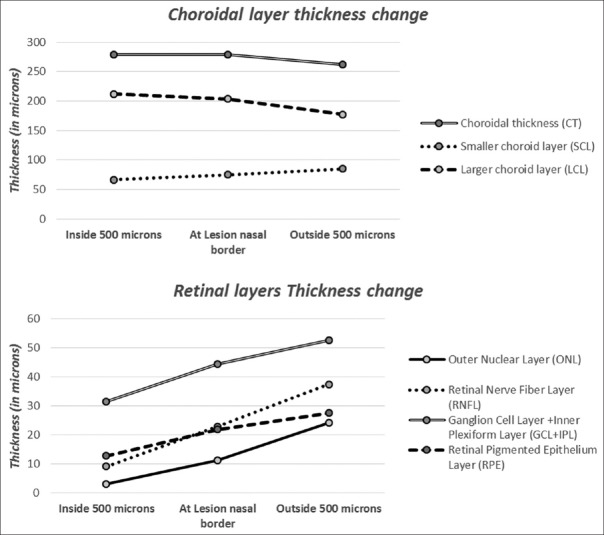
The thickness of the various layers of retina and choroid was measured at the border of lesion, 500 μ inside the lesion from the nasal border in horizontal axis, and 500 μ outside the lesion from the nasal border. Table 3 shows the mean difference in the thickness of the retinal layers (ONL, RNFL, GCL, IPC, and RPE) and the choroidal layers inside and outside the lesion in the Stargardt group. Statistically significant difference was noted in retinal layers with P < 0.05. Interesting trends were noted in the thickness of the choroidal layer. The total CT was almost stable inside the lesion and at the lesion border and showed a slight decrease outside the lesion on the nasal side. The SCV layer showed a gradual decrease from outside the lesion to inside the lesion similar to retinal layers [Figure 5], whereas the LCL showed gradual increase from outside the lesion to the inside. However, the differences were not statistically significant.
Table 3.
Mean thickness (μ) of various layers of retina and choroid at the edge of the lesion, 500 μ inside the lesion, and 500 μ outside the lesion measured from the nasal border of lesion in Stargardt group

Figure 5.
Change in mean thickness of retinal and choroidal layers in three regions of retina with respect to nasal border of lesion in Stargardt group
Correlation with visual acuity
The BCVA (in logMAR) in the Stargardt group was correlated with the diameter of the lesion, retinal, and CTs. Statistically significant correlation was noted between the BCVA in logMAR and the diameter of the lesion (r = 0.622, P < 0.001). With increasing the diameter of the lesion, there was worsening of the BCVA, but no significant correlation was noted between the BCVA and the thickness of either choroidal or retinal layers. Figure 6 shows the scatterplot between the BCVA in logMAR and the diameter of the lesion with linear regression model.
Figure 6.
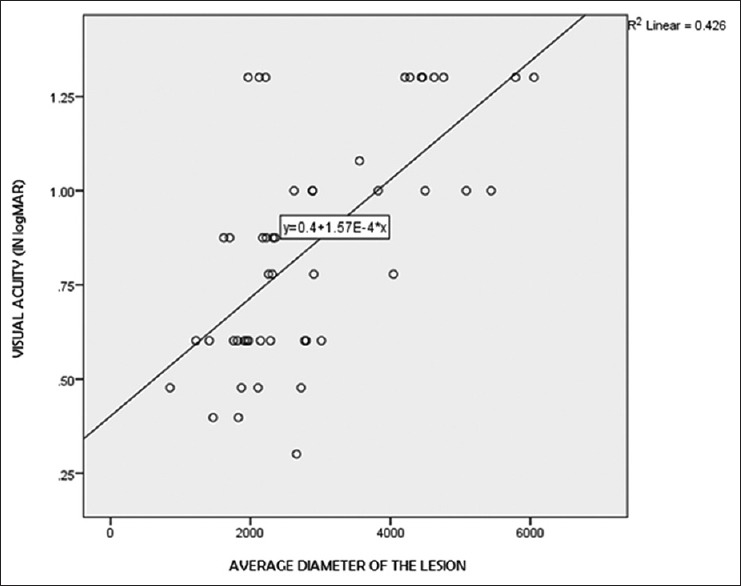
Linear regression analysis between average diameter of the lesion and visual acuity (in logMAR)
Correlation with the extent of flecks
The patients in the Stargardt group were divided into four groups depending on the extent of flecks observed in the fundus photograph. They were as follows: no flecks (n = 16), flecks at the parafoveal region only as a rim just surrounding the fovea (n = 12), flecks in the perifoveal region extending to a larger area around the fovea but inside the vascular arcades (n = 12), and flecks extending to the mid-peripheral region beyond the arcades (n = 12). Diameter of the lesion and retinal and CT of 500 μ inside the lesion, at the nasal border of lesion, and 500 μ outside the lesion were compared among these four groups. The average diameter of the lesion (P = 0.033), total CT (P = 0.020), and smaller choroidal vessel layer (SCL) thickness (P = 0.005) at 500 μ outside the lesion showed significant difference among the groups [Table 4]. Figure 7 shows the changes in the mean of average diameter of the lesions across the four groups. The mean of average diameter of the lesions increased gradually from no flecks to mid-peripheral flecks group. Thus, in Stargardt disease, with an increasing extent of flecks, there was an increase in the size of the macular atrophic lesion and a worsening of the visual acuity.
Table 4.
Mean value (μ) of parameters with statistically significant difference between groups of flecks
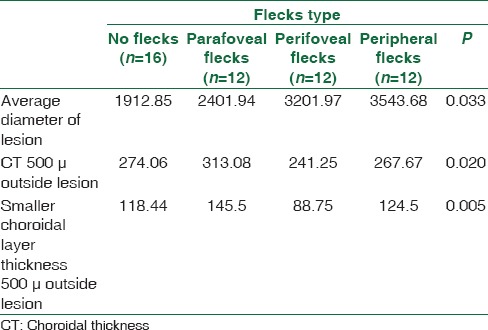
Figure 7.
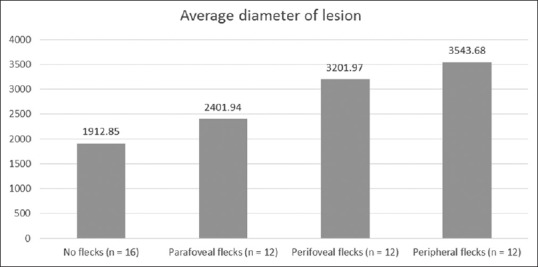
Average diameter of lesion in each group of flecks
Discussion
It is interesting to note the variations in the choroidal structure in the patients with Stargardt disease. As compared with the healthy age-matched controls, we found generalized thinning of the choroid in the eyes of the patients with Stargardt disease. The thinning was more pronounced subfoveal and immediate superior and temporal to fovea. Nasally also the choroid showed thinning, but it was not statistically significant. This is due to the fact that the choroid normally has a tapered configuration with maximum thickness at fovea and thinning in the nasal area near the disc. This pattern was maintained in Stargardt disease as well. Adhi et al.[8] found an exaggerated nasal thinning of the choroid. Chhablani et al.[17] did not note any difference in the CT in the patients with Stargardt disease when compared with the age-matched controls. However, their study included only nine patients (18 eyes) with Stargardt disease and the analysis included all the eyes with various inherited retinal diseases together. The study was also limited on account of the choroidal estimation carried out only in the horizontal raster scan.
We found a statistically significant thinning of the SCL in all the eyes with Stargardt disease, whereas the LCL was either unaffected (in 31 eyes, 59.6%) or increased in thickness (in 21 eyes, 40.3%). The small vessel layer or the choriocapillaris has been shown to be affected by the RPE atrophy. Giani et al.[18] indirectly proved the presence of choriocapillaris atrophy indicated by the “dark choroid” on fluorescein and indocyanine green angiography. When they compared the eyes with geographic atrophy secondary to age-related macular degeneration, the choriocapillaris appeared intact in such eyes. The deposition of A2E in the RPE cells can lead to the reduction of diffusion of water-soluble molecules such as VEGF from across the RPE cells to the choriocapillaris. Saint-Geniez et al.[19] have shown in their animal studies that the VEGF isomers secreted by the RPE are essential for maintaining the choriocapillaris. In the absence of these RPE-derived VEGF isomers, the choriocapillaris can atrophy. They observed dramatic choroidal remodeling, RPE cell loss, and photoreceptor apoptosis in the absence of RPE-derived VEGF.
The LCVs were seen to be affected to a lesser extent. The increased thickness of the LCVs may be a compensatory response to the atrophy of SCVs. In contrast, Adhi et al.[8] observed the attenuation of the LCVs. They also observed that the visual acuity tended to be better in the eyes with preserved LCL. We believe that the RPE atrophy is more likely to cause thinning of the choriocapillaris as they are in proximity and share a symbiotic relationship. However, it is possible that the eyes in their series were at a more advanced stage of the disease and hence reflected an advanced stage of choroidal damage.
We also analyzed the choroidal layers under the area of atrophy and outside the area. The layer of the SCVs was more thinned out in the area of atrophy than outside this area. Conversely, the LCL was thicker in the area of atrophy. This further confirms the fact that the changes in the RPE affect the choriocapillaris leading to its degeneration as well. However, the relative thickening of the LCVs in the same area, we assume, is due to a compensatory dilation of the LCVs, which might occur in response to the atrophy of the choriocapillaris, to maintain the blood supply.
The eyes affected with Stargardt disease were grouped into four categories on the basis of the extent of flecks. Assuming that the eyes with widespread flecks may indicate a larger area of involvement of the RPE and hence may indicate a more advanced stage of the disease. This was also indicated by the progressively increasing diameter of the central atrophic area. We could not detect any correlation between the anatomic variations and the extent of flecks with choroidal layer thickness. In a study by Battaglia Parodi et al.,[20] the CT varied according to the stage of the Best vitelliform macular dystrophy. In their series of eyes, the choroid was thicker in the stage with vitelliform deposition and it was thinner in the cicatricial or atrophic stage. Yeoh et al.[21] studied twenty patients with various retinal dystrophies, among them six patients had Stargardt disease. They found choroidal thinning in three of them. They commented that the choroidal thinning might depend on the stage of the disease as well as on the causative gene defect. Further studies with more number of eyes and longitudinal follow-up may reveal additional information with regard to the duration of Stargardt disease and CT.
Our study did not show any correlation between the visual acuity and the total CT or thickness of the different layers of choroidal vessels. However, we did find a direct correlation between the lesion size and the visual acuity. With the increasing lesion size, the visual acuity worsened. This indicates the progressive nature of the central atrophic area. Again, a longer duration follow-up is necessary to ascertain this.
There are some major differences between our study and the study conducted by Adhi et al.[8] Adhi et al.[8] measured the CT retrospectively at the subfoveal location in the horizontal meridian alone. SDOCT was used without the enhanced depth imaging technique. They found the procedure of measuring the CT difficult owing to the interference produced by the hyperreflectivity of the atrophic RPE. In our study, we explored the choroidal morphology in a well-planned prospective manner using the SSOCT, which gave a deeper penetration and well-defined images of the choroid. We analyzed the CT and the vasculature at the subfoveal location and also in the area of the ETDRS grid covering a distance of 6 mm around the fovea. Further, we also compared the choroidal structure inside the area of atrophy and outside this area.
However, there were several limitations to this study. The diagnosis of Stargardt disease was done on the basis of the typical clinical features. No genetic testing was performed. The study did not have any longitudinal follow-up of the cases, which would have helped in the correlation with disease stage and progression. Furthermore, a larger sample size would have given more information.
Conclusions
The SSOCT gives high-quality, high-resolution images of the choroidal layers in Stargardt disease despite the presence of high reflective RPE in the area of the lesion. The choroid shows thinning in the area of the lesion with the SCVs showing attenuation. The LCV layer may show a compensatory dilation and a consequent increase in its thickness. There was no correlation between the choroidal morphology and the visual acuity or other phenotypic features. However, the BCVA was seen to correlate with the size of the lesion and the extent of flecks. Despite these significant observations about the choroidal layers, they were inadequate to prognosticate regarding the severity or the progression of the disease. Newer imaging techniques and computer-based algorithms, such as choroidal vascularity index, are being explored by the researchers to accurately quantify the changes seen in the choroid.[22,23,24] In the future, these might act as biomarkers for the quantification of the disease progression and the visual loss in Stargardt disease.
Financial support and sponsorship
Nil.
Conflicts of interest
There are no conflicts of interest.
References
- 1.Koenekoop RK. The gene for Stargardt disease, ABCA4, is a major retinal gene: A mini-review. Ophthalmic Genet. 2003;24:75–80. doi: 10.1076/opge.24.2.75.13996. [DOI] [PubMed] [Google Scholar]
- 2.Cideciyan AV, Aleman TS, Swider M, Schwartz SB, Steinberg JD, Brucker AJ, et al. Mutations in ABCA4 result in accumulation of lipofuscin before slowing of the retinoid cycle: A reappraisal of the human disease sequence. Hum Mol Genet. 2004;13:525–34. doi: 10.1093/hmg/ddh048. [DOI] [PubMed] [Google Scholar]
- 3.Lewis RA, Shroyer NF, Singh N, Allikmets R, Hutchinson A, Li Y, et al. Genotype/Phenotype analysis of a photoreceptor-specific ATP-binding cassette transporter gene, ABCR, in Stargardt disease. Am J Hum Genet. 1999;64:422–34. doi: 10.1086/302251. [DOI] [PMC free article] [PubMed] [Google Scholar]
- 4.Allikmets R, Singh N, Sun H, Shroyer NF, Hutchinson A, Chidambaram A, et al. A photoreceptor cell-specific ATP-binding transporter gene (ABCR) is mutated in recessive Stargardt macular dystrophy. Nat Genet. 1997;15:236–46. doi: 10.1038/ng0397-236. [DOI] [PubMed] [Google Scholar]
- 5.Mata NL, Weng J, Travis GH. Biosynthesis of a major lipofuscin fluorophore in mice and humans with ABCR-mediated retinal and macular degeneration. Proc Natl Acad Sci U S A. 2000;97:7154–9. doi: 10.1073/pnas.130110497. [DOI] [PMC free article] [PubMed] [Google Scholar]
- 6.Neuhardt T, May CA, Wilsch C, Eichhorn M, Lütjen-Drecoll E. Morphological changes of retinal pigment epithelium and choroid in rd-mice. Exp Eye Res. 1999;68:75–83. doi: 10.1006/exer.1998.0589. [DOI] [PubMed] [Google Scholar]
- 7.Korte GE, Reppucci V, Henkind P. RPE destruction causes choriocapillary atrophy. Invest Ophthalmol Vis Sci. 1984;25:1135–45. [PubMed] [Google Scholar]
- 8.Adhi M, Read SP, Ferrara D, Weber M, Duker JS, Waheed NK. Morphology and vascular layers of the choroid in Stargardt disease analyzed using spectral-domain optical coherence tomography. Am J Ophthalmol. 2015;160:1276–84.e1. doi: 10.1016/j.ajo.2015.08.025. [DOI] [PubMed] [Google Scholar]
- 9.Battaglia Parodi M, Cicinelli MV, Rabiolo A, Pierro L, Bolognesi G, Bandello F. Vascular abnormalities in patients with Stargardt disease assessed with optical coherence tomography angiography. Br J Ophthalmol. 2017;101:780–785. doi: 10.1136/bjophthalmol-2016-308869. [DOI] [PubMed] [Google Scholar]
- 10.Spaide RF, Koizumi H, Pozonni MC. Enhanced depth imaging spectral-domain optical coherence tomography. Am J Ophthalmol. 2008;146:496–500. doi: 10.1016/j.ajo.2008.05.032. [DOI] [PubMed] [Google Scholar]
- 11.Adhi M, Liu JJ, Qavi AH, Grulkowski I, Fujimoto JG, Duker JS. Enhanced visualization of the choroido-scleral interface using swept-source OCT. Ophthalmic Surg Lasers Imaging Retina. 2013;44(6 Suppl):S40–2. doi: 10.3928/23258160-20131101-08. [DOI] [PubMed] [Google Scholar]
- 12.Rahimy E, Sarraf D. Paracentral acute middle maculopathy spectral-domain optical coherence tomography feature of deep capillary ischemia. Curr Opin Ophthalmol. 2014;25:207–12. doi: 10.1097/ICU.0000000000000045. [DOI] [PubMed] [Google Scholar]
- 13.Adhi M, Brewer E, Waheed NK, Duker JS. Analysis of morphological features and vascular layers of choroid in diabetic retinopathy using spectral-domain optical coherence tomography. JAMA Ophthalmol. 2013;131:1267–74. doi: 10.1001/jamaophthalmol.2013.4321. [DOI] [PMC free article] [PubMed] [Google Scholar]
- 14.Adhi M, Regatieri CV, Branchini LA, Zhang JY, Alwassia AA, Duker JS. Analysis of the morphology and vascular layers of the choroid in retinitis pigmentosa using spectral-domain OCT. Ophthalmic Surg Lasers Imaging Retina. 2013;44:252–9. doi: 10.3928/23258160-20130503-08. [DOI] [PubMed] [Google Scholar]
- 15.Battaglia Parodi M, La Spina C, Corradetti G, Berchicci L, Petruzzi G, Bandello F. Retinal hereditary and degenerative/dystrophic diseases (Non-Age-Related Macular Degeneration) Dev Ophthalmol. 2016;55:205–11. doi: 10.1159/000431125. [DOI] [PubMed] [Google Scholar]
- 16.Adhi M, Duker JS. Optical coherence tomography – Current and future applications. Curr Opin Ophthalmol. 2013;24:213–21. doi: 10.1097/ICU.0b013e32835f8bf8. [DOI] [PMC free article] [PubMed] [Google Scholar]
- 17.Chhablani J, Nayaka A, Rani PK, Jalali S. Choroidal thickness profile in inherited retinal diseases in Indian subjects. Indian J Ophthalmol. 2015;63:391–3. doi: 10.4103/0301-4738.159862. [DOI] [PMC free article] [PubMed] [Google Scholar]
- 18.Giani A, Pellegrini M, Carini E, Peroglio Deiro A, Bottoni F, Staurenghi G. The dark atrophy with indocyanine green angiography in Stargardt disease. Invest Ophthalmol Vis Sci. 2012;53:3999–4004. doi: 10.1167/iovs.11-9258. [DOI] [PubMed] [Google Scholar]
- 19.Saint-Geniez M, Kurihara T, Sekiyama E, Maldonado AE, D'Amore PA. An essential role for RPE-derived soluble VEGF in the maintenance of the choriocapillaris. Proc Natl Acad Sci U S A. 2009;106:18751–6. doi: 10.1073/pnas.0905010106. [DOI] [PMC free article] [PubMed] [Google Scholar]
- 20.Battaglia Parodi M, Sacconi R, Iacono P, Del Turco C, Bandello F. Choroidal thickness in best vitelliform macular dystrophy. Retina. 2016;36:764–9. doi: 10.1097/IAE.0000000000000759. [DOI] [PubMed] [Google Scholar]
- 21.Yeoh J, Rahman W, Chen F, Hooper C, Patel P, Tufail A, et al. Choroidal imaging in inherited retinal disease using the technique of enhanced depth imaging optical coherence tomography. Graefes Arch Clin Exp Ophthalmol. 2010;248:1719–28. doi: 10.1007/s00417-010-1437-3. [DOI] [PubMed] [Google Scholar]
- 22.Vupparaboina KK, Nizampatnam S, Chhablani J, Richhariya A, Jana S. Automated estimation of choroidal thickness distribution and volume based on OCT images of posterior visual section. Comput Med Imaging Graph. 2015;46(Pt 3):315–27. doi: 10.1016/j.compmedimag.2015.09.008. [DOI] [PubMed] [Google Scholar]
- 23.Agrawal R, Gupta P, Tan KA, Cheung CM, Wong TY, Cheng CY. Choroidal vascularity index as a measure of vascular status of the choroid: Measurements in healthy eyes from a population-based study. Sci Rep. 2016;6:21090. doi: 10.1038/srep21090. [DOI] [PMC free article] [PubMed] [Google Scholar]
- 24.Tan KA, Gupta P, Agarwal A, Chhablani J, Cheng CY, Keane PA, et al. State of science: Choroidal thickness and systemic health. Surv Ophthalmol. 2016;61:566–81. doi: 10.1016/j.survophthal.2016.02.007. [DOI] [PubMed] [Google Scholar]


