

Abstract
Huntington’s disease homolog (Hdh) mRNA levels in mice with different Hdh alleles were measured. Brain Hdh mRNA levels varied up to threefold in genetically identical wild-type mice, indicating nongenetic factors influence Hdh expression. Striatal Hdh mRNA levels from an allele with a repeat expanded to 150 CAGs were diminished compared with wild-type and showed variation that might contribute to phenotypic variability in the Hdh(CAG)150 knock-in mouse model. To determine whether Hdh mRNA levels are tightly regulated, we assessed these levels in mice heterozygous for a deletion of the Hdh promoter. The loss of one allele reduced Hdh mRNA levels in most tissues, suggesting mechanisms to maintain Hdh mRNA levels are not in effect and should not impede therapies designed to destroy mutant huntingtin mRNA. Finally, we found a correlation between tissue mRNA levels and the susceptibility of the Hdh locus to Cre-mediated deletion. The two tissues with the highest levels of Hdh mRNA, testes and brain, were the only tissues susceptible to Cre-mediated recombination between loxP sites at Hdh locus. In contrast, the same Cre-expressing line caused recombination in every tissue for loxP sites at another genomic location. The pattern of Cre susceptibility at Hdh suggests a correlation between chromatin accessibility and high levels of Hdh expression in testes and brain.
Key words: Knock-out, Knock-in, Cre recombinase, Gene expression, Real-time PCR, Chromatin structure
HUNTINGTON’S disease (HD) is a late onset neurological disease caused by an expanded CAG repeat in the HD locus (24). Alleles with greater numbers of CAGs correlate with earlier onset and death of HD victims (24). For a given repeat size, however, there is a great amount of variability in age of onset, clinical severity, and age at death (2,7,15,41,45). There are many factors that have been proposed that might explain such interindividual variations, including differences in levels of HD gene expression (12,16). Several lines of evidence suggest higher levels of mutant HD gene product lead to greater pathology. For example, mice with higher amounts of HD transgene expression show earlier and more severe phenotype for a given repeat length (39). Homozygous knock-in mice with 110 or 150 CAGs exhibit an earlier onset of abnormalities than heterozygotes (30,51). In humans, however, the role of HD gene expression levels in disease pathology seems more complicated. Although, homozygous HD victims have similar ages of onset as heterozygotes with similar repeat lengths, homozygotes exhibited a more severe clinical course (35,44,50). Furthermore, immunocytochemical HD staining is greater in populations of neurons known to be sensitive to the effects of the mutation (16). These findings are consistent with the view that HD expression levels modulate pathology. Thus, one potential therapeutic strategy has been to design a method of reducing levels of mutant HD gene product (6,8,34,37,53).
HD gene expression might also change in response to internal or external stimuli. The HD promoter and its mouse homolog have binding sites for transcription factors AP2, Sp-1, and HIF-1 (12,23,29). Because these factors alter the transcript level of several loci in response to different environmental conditions, they are likely to act in a similar manner at the HD locus (17,22,25,26,31,47). Furthermore, rodent HD expression levels are controlled by developmental stage and by physiological state (4,21). For example, rat HD mRNA levels in the arcuate nucleus of the hypothalamus increases sevenfold after giving birth (21). Also chemical treatment alters Huntington’s disease homolog (Hdh) gene expression. The iron chelator deferoxamine mesylate increases Hdh protein levels fourfold in ES cells (23), and glutamate analog excitotoxins administered to mouse brain affect both Hdh mRNA and protein levels (9,46). The possibility of environmental control of HD gene expression raises hopes that reduction of expression therapy might be achieved without having to design new methods for delivering therapeutic agents to affected brain regions of HD victims.
The classical means of establishing the existence of such environmental factors relies on an assessment of phenotypic variability while controlling experimental and genetic variation. Experimental variation can be measured by repetition of an assay. Genetic variation can be controlled by assessing a large number of genetically identical individuals. In human populations, the study of monozygotic twins has revealed profound genetic influence in age of onset, clinical features, and age of death for HD (20). Such studies have not ruled out environmental influences that were shared by each twin pair. Furthermore, at least one monozygotic pair exhibited a number of differences in clinical features of HD (18). These twin studies did not report levels of HD gene product, a difficult task given differences that are known to occur due to handling of postmortem human tissues (16). In this study, we have taken advantage of an inbred strain of mice to provide large numbers of genetically identical subjects whose tissues were prepared in a controlled manner. Using quantitative real-time PCR (qRT-PCR) we have determined that mRNA levels of the mouse HD homolog (Hdh) in inbred C57BL/6 brains vary by up to threefold from mouse to mouse with less than one half of this variation coming from experimental sources. We further explore the potential mechanisms of regulation by determining Hdh mRNA levels from knock-out and knock-in Hdh alleles and by comparing tissue levels of Hdh mRNA to the tissue specificity of Cre-mediated deletions at the Hdh locus.
MATERIALS AND METHODS
Mouse Lines
All mice used in this study were housed in a pathogen-free colony with a 12-h light/dark cycle. For the determination of variation in the brains of inbred mice, 11 5-month-old male C57BL/6J mice (Jackson labs) were used. These males were part of a breeding colony, were housed separately for most of their lives (except when breeding), and they were combined into one cage for at least 1 week prior to sacrifice. Mice harboring the Hdh (CAG)150 allele and the Hdh Hprt allele (promoter and exon 1 deletion of Hdh) were described previously (10,30). To create the Hdh flox allele a gene-targeting construct was prepared containing the promoter and wild-type exon 1 of Hdh with the sequence 5′-AATTT CCTAA GGATA ACTTC GTATA ATGTA TGCTA TACGA AGTTA T-3′ into the EcoRI site just upstream of wild-type Hdh exon 1 and the sequence 5′-CTAGC CTAAG GATAA CTTCG TATAA TGTAT GCTAT ACGAA GTTAT-3′ into the SpeI site in intron 1. These constructs were used in the repeated targeting system for Hdh we described previously (10). Each added oligonucleotide has a Bsu36I site in addition to the loxP site, which was used to confirm gene targeting. Mice were made by injecting targeted ES cells into blasotcysts. Functionality was shown by mating mice with Hdh loxP sites to mice expressing Cre driven from a CMV promoter and confirming the deletion by Southern analysis (data not shown). The Cre recombinase gene was cloned by PCR from bacteriophage P1 DNA (a gift from NP Higgins). This sequence was modified by replacing the starting ATG with the synthetic oligonucleotide (GCCAA TATGG GATCG GCCCC AAAAA AGAAG AGAAA GGTAG AA) that contains a Kozak start site (underlined) and an NLS. The modified Cre was inserted into the pTre vector (Clontech) using EcoRI and XbaI restriction sites such that the minimal CMV promoter and mulitmerized tet operator sites of pTre could drive transcription of Cre. The transgene was removed from the plasmid backbone using XhoI and HindIII digests and injected into the pronuclei of 0.5-day-old C57BL/6 J embryos before being transferred to the oviducts of pseudopregnant foster mothers. The mice used in this study lacked the reverse tet repressor transgene and were not treated with doxycyline. PCR genotyping for the presence of a 900-bp band representing the Cre transgene was performed as follows: forward primer 5′-CTGAC CGTAC ACCAA AATTT G-3′ and reverse primer 5′-GATCT CCGGT ATTGA AACTC C-3′. PCR program: 94°C for 5 min, 94°C for 1 min, 52°C for 1 min, 72°C for 1 min, repeat from step 2 four times, 94°C for 30 s, 52°C for 1 min, 72°C for 1 min, repeat from step 6 25 times, 72°C for 2 min. Mice with loxP sites inserted into the R26 locus were purchased from Jackson Labs (Stock #003474) (43). PCR to genotype mice with loxP sites in R26 yields a band of 1 kb. Forward primer 5′-GCGA TCTTC CTGAG GCCGA TACTG-3′ and reverse primer 5′-TCCAC CACA TACAG GCCGT AGCGG TCGC-3′. PCR program: 94°C for 3 min, 94°C for 30 s, 55°C for 1 min, 72°C for 1 min, repeat from step 2 29 times, 72°C for 2 min.
Determination of Cre-loxP Deletions by PCR
Primers to test for recombination at the Hdh flox allele yield a band of 470 bp: forward primer 5′-GCCCA TGCTG ACTTG AATTT CA-3′ and reverse primer 5′-CAGGA CTGGG AACAT AGCTC-3′. PCR program: 94°C for 3 min, 94°C for 30 s, 53°C for 1 min, 72°C for 1 min, repeat from step 2 29 times, 72°C for 2 min.
Primers to test for recombination at the R26 locus yield a band of 440 bp: forward primer 5′-GGGGA GTGTT TGCAA TACCT TT-3′ and reverse primer 5′-CACGA CGTTG TAAAA CGACG G-3′. PCR program: 94°C for 3 min, 94°C for 34 s, 56°C for 45 s at 0.5°C/cycle, 72°C for 45 s, repeat from step 2 12 times, 94°C for 35 s, 54°C for 30 s, 72°C for 45 s, repeat from step 6 25 times, 72°C for 2 min.
PCR reactions were done in a total volume of 20 (μl. All reactions: 1 μl template DNA, 0.2 mM dNTPs, 250 ng primers. For R26 recombination: 10× Fisher Taq buffer, 1 U Fisher Taq, 1.5 mM MgCl2. For Cre transgene: 10× Fisher Taq buffer, 1 U Fisher Taq, 2.5 mM MgCl2. For recombination at the Hdh allele: 10x Fisher Taq buffer, 1 U Taq polymerase, 1.5 mM MgCl2, 1.25 M betaine.
Determination of Hdh mRNA Levels by Real-Time PCR
Organs were rapidly harvested from mice that were euthanized in a CO2 evacuated container, flash frozen on dry ice, and stored at −80°C. RNA was extracted using TRizol reagent (Life Technologies) by the manufacturer’s protocols. Reverse transcription reactions were performed on 5 μg of total RNA using the High Capacity Archival cDNA kit (Applied Biosystems) according to manufacturer’s instructions. Realtime PCR using the ABI7900 Prism followed Applied Biosystem’s protocols. Reactions were a total volume of 20 μl using the Taqman universal mix without ung (Applied Biosystems), and 1 μl of a 1:10 dilution of cDNA, except striatum preps, which had 1 (xl of 1:100 dilution of cDNA. The Hdh primers 5′ - GACCG TGTGA ATCAT TGTCT AACAA - 3′ and 5′-GATGC CCAAG AGTTT CTGAA ATTC-3′ were used to amplify the junction of exons 2 and 3. This fragment was detected by the Taqman MGB probe 5′-CAGTC TCTCA GAAAT T-3′ during the PCR reaction: step 1 50°C for 2 min, step 2 95°C for 10 min, step 3 95°C for 15 s, step 4 60°C for 1 min, steps 3 and 4 repeated 40 times. As a control, each sample was separately assessed for 18S rRNA (Applied Biosystems). Hprt primers 5′-AGGACCTCTC GAAGTGTTGGATAC-3′ and 5′-GGCATATCCAAC AACAAACTTC-3′ were used to amplify the junction of exons 7 and 8. The Taqman MGB probe used to detect this fragment was 5′-AGGCCAGACTTTGT TGG-3′. For the determination of brain C57BL/6J Hdh mRNA levels (Fig. 1), five reverse transcription reactions were replicated three times for a total of 15 assays of each RNA sample. The amount of Hdh mRNA relative to 18S rRNA in each sample was calculated and determined by the equation 2 MCt, where AACt is the difference between the Ct for 18s rRNA and Hdh mRNA. This level was expressed as percentage of the average for the highest mouse for that experiment. These were averaged over each replicate of the experiment. For the determination of Hdh in different organs (Figs. 3 and 4), each sample was assayed in duplicate on four different runs. Some (only 6%) of the duplicates that varied by more than 0.5 Ct units within a single run were excluded as wells with pipetting errors. The data in Figure 3 represent from 4 to 8 total replicates. The amount of Hdh mRNA relative to the maximum for each run was calculated and averaged over the 4 runs. Striatal mRNA levels (Fig. 2) were determined in the same manner as the determination for levels in different organs. All statistics were performed using Instat (Graph Pad Software).
Figure 1.
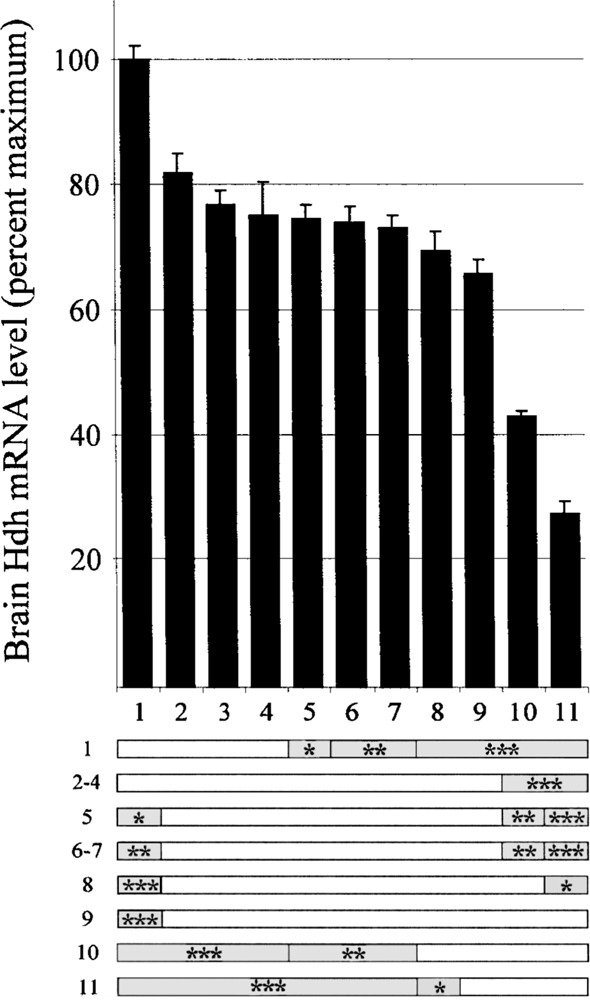
Variation in brain Hdh mRNA levels in 11 C57BL/6 mice. Top: Bars show the level of Hdh mRNA relative to the maximum (mouse #1 = 100%). The ID number of each mouse is shown below each bar. Error bars represent the SEM (n = 15 replicates per mouse). Bottom: Statistical comparison of Hdh mRNA levels from each mouse is represented by horizontal bars. Shaded areas within each bar indicate that a statistically significant difference was found for brain Hdh mRNA levels between mouse ID on left and mouse ID above (Kruskal-Wallis with Dunn’s post test, *p < 0.05, **p < 0.01, ***p < 0.001).
Figure 3.
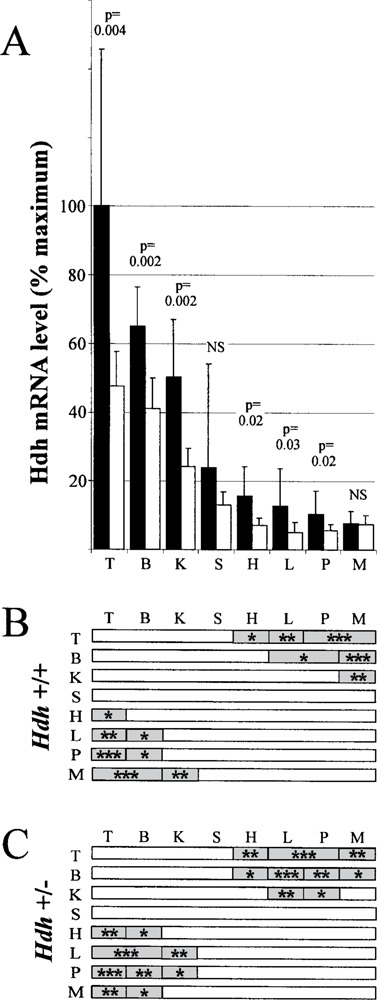
Mean and variation of relative Hdh mRNA levels in different tissues. (A) Black bars indicate mean level of Hdh mRNA for six wild-type mice (Hdh+/+) in eight different tissues relative to wild-type testes (maximum). Open bars indicate mean level of Hdh mRNA for six heterozygous promoter deletion mice (Hdh+/-) for each tissue relative to wild-type testes (maximum). T, testes; B, brain; K, kidney; S, spleen; H, heart; L, liver; P, pancreas; M, skeletal muscle. The error bars represent SD for the 4–6 measurements taken on each of six mice represented by the vertical bar (includes mouse-to-mouse and experimental variation). The entire figure represents 540 measurements of Hdh mRNA levels. Statistical comparison of Hdh+/+ and Hdh+/- mice for each tissue by the Mann-Whitney test yielded p values shown above bars (NS, not significantly different or p > 0.05). (B) Statistical comparison of Hdh mRNA levels from each tissue in Hdh+/+ mice is represented by horizontal bars. Shaded areas within each bar indicate that a statistically significant difference was found for Hdh mRNA levels between tissue on left and tissue label above bar (Kruskal-Wallis with Dunn’s post test, *p < 0.05, **p < 0.01, ***p < 0.001). (C) Same as (B), but for tissues in Hdh+/− mice.
Figure 4.
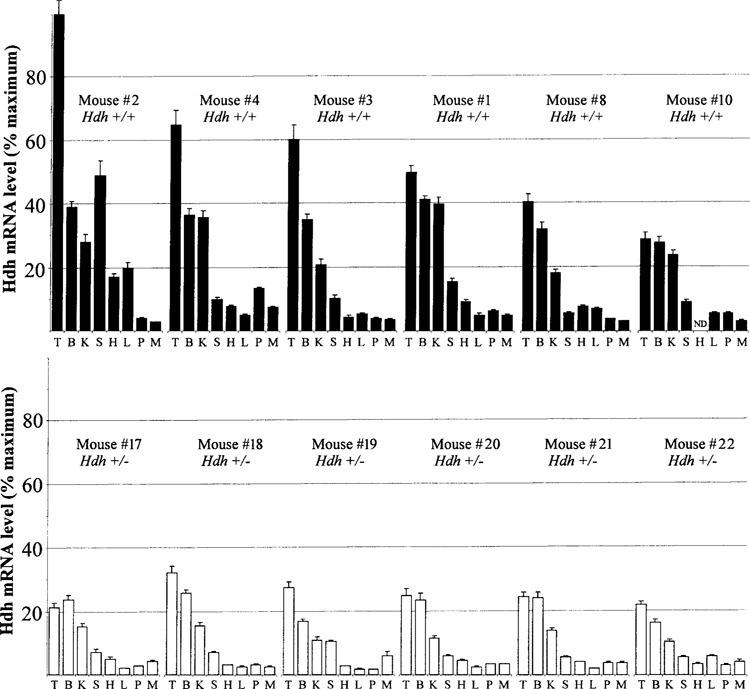
Hdh mRNA tissue levels in individual mice. Top: Bars represent Hdh mRNA level from one tissue of a single wild-type mouse as a percentage of the maximum (testes of wild-type mouse ID #2). Mouse ID numbers correspond to those in Figure 1. Error bars represent the SEM as calculated from 4–8 replicates on each tissue. Letters represent different tissues as described in the legend for Figure 3. These data are a different representation of the averaged data from Figure 3. Bottom: Same as top panel except bars indicate Hdh mRNA levels for tissues in Hdh+/− mice as a percentage of maximum (testes of wild-type mouse ID #2).
Figure 2.
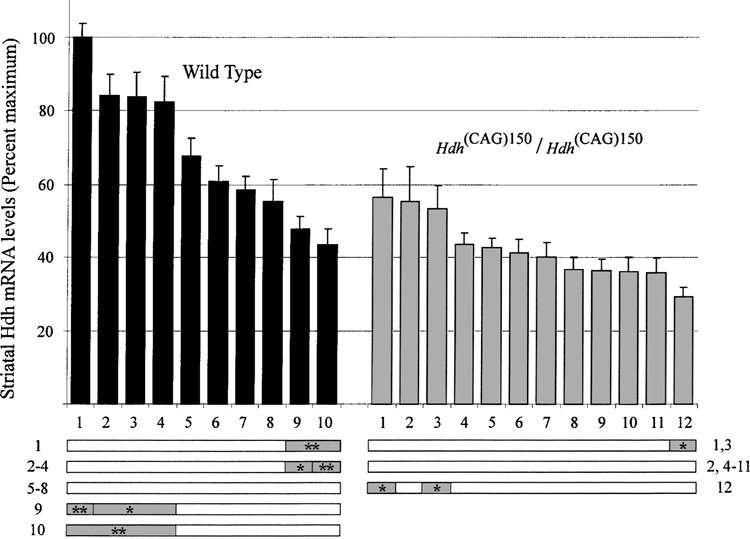
Variation in striatal Hdh mRNA levels. Top: Striatal Hdh mRNA levels relative to maximum wild-type mouse are shown for 10 wild-type (black bars) and 12 homozygous Hdh (CAG)150 mice (gray bars). Each wild-type mouse was assigned a number 1–10 and each mutant a number 1–12 (these numbers do not correspond to mouse numbers in Fig. 1). Error bars show the SEM. Bottom: Statistical comparison of Hdh mRNA levels from each mouse is represented by horizontal bars. Shaded areas within each bar indicate that a statistically significant difference was found for brain Hdh mRNA levels between mouse ID next to bar [left for wild-type mice, right for homozygous Hdh (CAG)150 mice] and mouse ID above (Kruskal-Wallis with Dunn’s post test, *p < 0.05, **p < 0.01, ***p < 0.001).
RESULTS
Assay Description and Validation
Relative levels of Hdh mRNA were determined by a qRT-PCR assay (Applied Biosystems). Briefly, this assay involves creation of cDNA using a random-primed reverse transcriptase reaction. PCR is used to specifically amplify Hdh cDNA by exonic primers flanking intron 2 of Hdh. The use of primers in exons separated by a 7.4-kb intron controls for the unwanted amplification of trace amounts of genomic DNA that may be present in RNA preparations. The amount of PCR product is monitored during each cycle of the reaction using a probe that hybridizes to the exon 2-3 junction in amplified Hdh cDNA. The probe contains a covalently attached fluorescent moiety and a quencher. During each cycle probe bound to the DNA being amplified is destroyed by the DNA-dependent exonuclease function of the thermostable polymerase. The resulting physical separation of the quencher allows fluorescence in proportion to the amount of amplified product. Because the probe only binds to sequences corresponding to Hdh, other sequences inadvertently amplified do not add to the total fluorescence. The cycle where the amount of fluorescence becomes greater than a threshold (Ct) is used to mathematically derive the relative amount of mRNA in each sample. As an internal control, a similar assay for 18S rRNA (Applied Biosystems) was performed on a separate aliquot of each sample. A standard curve for both the Hdh and 18S rRNA was linear for the following dilutions of cDNA: 1:10,000, 1:1000, 1:100, and 1:10 (R 2 = 0.99 for both). The log of RNA concentration versus the difference in the Ct value of 18S rRNA and of Hdh mRNA over these dilutions yielded a slope of 0.01, indicating that the relative efficiencies for these two PCR reactions were almost identical. The similar efficiencies allow the use of a comparative method where the amount of Hdh mRNA is normalized to the amount of 18S rRNA in each sample. In each experiment, the sample with the highest amount of Hdh mRNA was considered as 100% and all other samples are reported relative to that maximum.
Variation in Brains of Genetically Identical Mice
Brain Hdh mRNA levels were determined for 11 age-matched C57BL/6J male mice. Dissection time was kept to a minimum, and tissues were flash frozen to minimize RNA degradation. RNA was isolated and five separate reverse transcription reactions were performed on each sample. Hdh qRT-PCR and 18S qRT-PCRs were performed on each of the 55 cDNA samples in triplicate. Hdh mRNA levels were normalized to 18S rRNA levels for each replicate. The relative levels of Hdh mRNA for the 11 mice show significant variation (Fig. 1, top), with the lowest level being 28% of the highest. Many comparisons between these mice yielded statistically significant differences (Fig. 1, bottom).
As a control for nonspecific mRNA degradation and the possible presence of general PCR inhibitors, Hprt mRNA was monitored in a separate qRT-PCR assay for each of the 55 cDNA samples (data not shown). The expectation for general degradation or inhibition would be a correlation between mRNA levels for Hprt and Hdh. The levels did not correlate (R 2 = 0.25). In fact, the lowest Hdh expresser (ID# 11) was the highest Hprt expresser. Thus, variation in Hdh mRNA levels was not due to different levels of overall mRNA degradation or general PCR inhibitors in the RNA samples.
Experimental variation was measured by determining the variation in Hdh mRNA levels among the 15 repetitions of measurements for each mouse. On average the standard deviation of the repetitions within each mouse was 14% of the mean Hdh mRNA level for that mouse. We refer to this measure as the experimental coefficient of variation (CVexp). When all sources of variation (including interindividual variation) are included, the standard deviation across all mice is 30% of the mean Hdh mRNA level. We refer to this as the total coefficient of variation (CVtotal). The difference between CVexp and CVtotal shows that more than half of the total variation in these experiments is due to mouse-to-mouse differences in Hdh mRNA levels.
Striatal Levels and the Effect of Long CAG Repeats
The brain region with the greatest pathology in HD, the striatum, is also the brain region with the highest density of neuronal intranuclear inclusions (NIIs) in the Hdh (CAG)150 knock-in mouse model (30). Striatal Hdh mRNA in Hdh (CAG)150 homozygotes was reduced to 66% of wild-type levels. Wild-types average 58% and mutants average 38% of the highest expresser, wild-type mouse #1 from Figure 2 (p < 0.0003, Mann-Whitney). Hdh mRNA levels in Hdh (CAG)150 homozygotes was also variable (CVtotal = 27%, CVexp = 20%), although to a lesser extent than wild-type striatal Hdh levels (CVtotal = 35%, CVexp = 14%). Both young (10–19 weeks n = 7 wild-type, n = 5 mutant) and old (55–74 weeks n = 3 wild-type, n = 5 mutant) mice were analyzed, and no significant differences or trends in Hdh mRNA levels were observed for mice of different ages. Therefore, we combined both young and old mice for the data shown in Figure 2.
Effects of Heterozygous Promoter Deletion on Hdh mRNA Levels in Various Tissues
To determine the effect of gene dosage on Hdh mRNA levels, we compared the levels of Hdh mRNA in tissues of wild-type mice to levels in animals heterozygous for a deletion of the Hdh promoter and exon 1 [described previously (10,30)]. In wild-type mice Hdh levels were highest in the testes and brain, intermediate in kidney and spleen, and low in heart, liver, pancreas, and skeletal muscle (Fig. 3, n = 4–8 replicates). The heterozygous promoter deletion mice showed a similar distribution of Hdh mRNA. Loss of one allele caused reduction in Hdh mRNA of wild-type levels in all tissues except skeletal muscle. The reduction reached statistical significance for testes, brain, kidney, heart, liver, and pancreas, as shown in Figure 3. Excluding skeletal muscle, levels of Hdh mRNA in heterozygous promoter deletion animals ranged from 39% (liver) to 63% (brain) of wild-type levels with an average of 50%.
General environmental conditions might be expected to affect several tissues simultaneously. Therefore, multiple comparisons of each tissue were made to determine whether higher levels in one tissue of a mouse were a predictor of higher levels in another tissue of that same mouse. Figure 4 shows that mouse #2 had very high levels of Hdh mRNA in testes, brain, spleen, liver, and heart when compared with the same tissues of other mice. Mouse #4 had high levels in kidney, pancreas, and skeletal muscle but had relatively low levels in heart, liver, and spleen. These data suggest that there might be conditions that cause high levels of Hdh mRNA to be maintained in a few organs. Nevertheless, there does not seem to be a universal coordination in Hdh mRNA levels among the tissues analyzed.
Mouse-to-mouse variation in Hdh mRNA levels were very high in most tissues with the average across all tissues being CVtotal = 49.8% and CVexp = 14.2%. The heterozygous promoter deletion reduced the variation by approximately half of wild-type (heterozygote CVtotal = 29.3%, CVexp = 15.8%). As described in the preceding paragraph, a few mice are outliers with very high levels of Hdh mRNA in several tissues; these outliers might also account for the variation seen in different tissues in wild-type mice. The lack of such outliers in the heterozygous group might be due to a small number of subjects or to the inability of mice with only one allele to produce very high quantities of Hdh mRNA in most tissues. Variation was lowest in brain, suggesting a tighter regulation of Hdh mRNA levels in brain than in other tissues.
Tissue-Specific Deletion of an Hdh-loxP Allele by Ubiquitous Cre Recombinase
Cre-loxP technology has been suggested as a means to discriminate closed from open chromatin domains in vivo (40). To relate chromatin accessibility to Hdh expression, mice transgenic for Cre recom-binase were mated to a mouse with a knock-in of loxP sites flanking the promoter and exon 1 of Hdh [(10) and Materials and Methods]. As a control, the same Cre recombinase mouse line was also mated to a mouse having loxP sites at the ROSA26 (R26) locus (43). A genomic PCR assay was used to determine whether recombination had occurred at Hdh or the R26 locus in several tissues. As shown in Table 1, Cre was functional in all tissues at the R26 locus, but only caused Hdh deletions in the testes and brain. Thus, the two tissues expressing the highest level of Hdh mRNA were also the most permissive for deletion at Hdh locus.
TABLE 1.
FRACTION OF MICE SHOWING CRE RECOMBINASE-MEDIATED RECOMBINATION IN VARIOUS TISSUES
| Locus | Testes | Brain | Kidney | Spleen | Heart | Liver | Pancreas | Muscle |
|---|---|---|---|---|---|---|---|---|
| Hdh | 20/37 | 5/72 | 0/72 | 0/72 | 0/72 | 0/72 | 0/72 | 0/72 |
| R26 | 3/5 | 6/15 | 7/15 | 6/15 | 6/15 | 5/15 | 4/15 | 3/15 |
| p value* | NS | 0.0028 | <0.0001 | <0.0001 | <0.0001 | <0.0001 | 0.0006 | 0.0043 |
Founder line expressing Cre recombinase was the same for both Hdh and R26 targets.
Fisher exact test to determine if target locus influences the proportion of mice with recombination.
DISCUSSION
In this study we assessed levels of Hdh mRNA to better understand factors that might influence the production and/or the destruction of Hdh mRNA. Factors that create mouse-to-mouse variation in the level of a specific mRNA can be categorized as experimental, environmental, stochastic, or genetic. Using RNA isolated from the brains of 11 age-matched males from the inbred C57BL/6 line, a substantial amount of variation was found in Hdh mRNA levels. By comparison of repeated measures (15 repetitions) of each sample, we found the experimental variation to be approximately one half of the total variation. The use of genetically identical mice controls for genetic factors, leaving the other half of the variation as either environmental and/or stochastic.
Stochastic variation of gene expression has been reported within populations of cells (5). The experiment described here provides only an average level of Hdh mRNA level in the over 75 million neurons of the mouse brain (52). In situ studies of mouse brain have shown a widespread expression of Hdh mRNA and protein in neurons (4). This widespread expression would minimize the effect of extremely high expression in a few neurons when considering the overall average of brain Hdh mRNA levels. Thus, it is unlikely that stochastic changes in a few cells could account for the threefold difference in brain Hdh mRNA levels reported here. The expression difference must minimally occur in thousands of neurons, indicating such changes are coordinated. Stochastic differences might be coordinated by epigenetic factors established in neuronal precursors that are maintained through the many cell divisions in the developing brain.
Environmental influences might also explain a coordinated alteration in Hdh mRNA level. The mice used in this study, however, had seemingly similar environments. They were used as breeders in a pathogen-free colony, housed separately for most of their lives except when breeding, and then combined into one cage and housed for at least 1 week prior to the study. There were also no apparent physical differences between individuals. If environmental factors do contribute toward the observed variation, these factors are not obvious. Subtle factors, however, have been previously shown to alter the phenotype of an HD mouse model. For example, adding small objects to mouse cages has been shown to increase the life span of the transgenic HD model R6/2 (48). Although such stimuli were not provided for the mice in this study, differences in stimulation may have been present when the mice were housed separately. The mice in this study probably differ at the point of sacrifice in time since last meal, hormonal levels, activity levels, degree of restfulness, amount of anxiety, and several other unknown variables.
Because this assay only measures mRNA levels at one point in time, it is not clear whether some mice have persistently less Hdh mRNA than others. There may also be changes in the levels of Hdh mRNA from day to day or over longer periods that account for differences in Hdh mRNA levels. Further study would be needed to determine whether neuronal dysfunction in HD is due to the accumulation of damage from a series of toxic crises corresponding to transiently high HD mRNA levels.
Whether environmental or stochastic, the nature of the variation suggests more than one factor influences the regulation of Hdh mRNA levels. The distribution of levels shown in Figure 1 resembles a normal Gaussian curve, with one very high expresser (100%), eight middle range (60–80%), and two low expressers (28% and 43%). This type of variation is also present in the striatum of both wild-type and Hdh (CAG)150 homozygotes. The large number of middle range expressers argues against a bimodal type of curve that might be expected from a simple switch that could enhance or depress Hdh mRNA levels in large populations of brain cells. The Hdh (CAG)150 knock-in mouse model exhibits variation in age of onset and degree of abnormality. For example, approximately 1 in 10 mice carrying the Hdh (CAG)150 mutation show severe reduction in weight and exhibit convulsive spells suggestive of clonictonic type seizures (30). Further investigation of these mice will be needed to determine whether their abnormalities correlate with level of Hdh (CAG)150 gene product.
These data should serve as a guide for determination of numbers of mice to use in the assessment of mRNA levels in general. In our study 8 of 11 mice (ID #2–9, Fig. 1) were within a fairly tight middle range and the other three were outliers. If we take the probability of omitting an outlier in a study as 8 of 11, then in a trial of n mice the probability of having no outliers is (8/11)n. Thus, in a study of three mice the probability of having no outliers is 38% and with six mice this decreases to 15%. In experiments to establish a mean for comparisons of levels, the choice of an outlier would provide an inaccurate mean. Conversely, in experiments to determine whether a gene is variably expressed, missing outliers could make gene expression seem more constant. In one such study, Project Normal, the variance in thousands of genes was measured. Significant levels of variation were found in only a small percentage of mRNAs from different tissues of six C57BL/6 mice (38). Thus, the variation we are observing in Hdh mRNA levels seems to not be shared by most other genes. Although Hdh was not included in this important study (C. Pritchard and P. Neslon, personal communication), there is a good probability (15% based on the assumptions outlined above) that variation in Hdh mRNA levels would have been missed by the use of only six mice. The presence of outliers is also an important consideration when assessing transgenic mouse models of HD where transgene level is compared with endogenous mouse Hdh mRNA levels (33) and will be important in testing therapies designed to reduce HD mRNA levels (6,8,34,37,53).
Such reduction of expression strategies will also be influenced by how the cell regulates HD mRNA levels. Some genes are tightly regulated such that attempts to lower its expression might be thwarted by an endogenous feedback signal that results in an increase in transcription or mRNA stabilization. Such a mechanism might account for the similarity between levels of Hdh mRNA in skeletal muscle when we compared wild-type mice with mice heterozygous for a promoter deletion (Fig. 3). More importantly, we found that loss of one allele caused reductions in most organs, including the brain. These results complement a prior report where reduced HD protein levels were found in lymphoblastoid lines derived from individuals with a translocation through the HD gene (36). These data suggest that therapy designed to reduce brain HD mRNAs will not be complicated by endogenous counterbalancing measures.
One mechanism of gene regulation is the alteration of chromatin configuration, which can block access to proteins involved in transcription (19). Closed chromatin domains can block access to other proteins, which is the basis for some experimental probes of chromatin accessibility [e.g., DNAse I sensitivity assays (11)]. The use of Cre-loxP technology has been suggested as a means of discriminating closed and open chromatin domains in vivo (40). In an attempt to make an inducible adult knock-out of Hdh, we created mouse lines transgenic for Cre and a knock-in of loxP sites that flanked the wild-type Hdh promoter and exon 1 region. We found that the Cre line was slightly leaky in the absence of elements needed for induction (activator transgene and inducing agent). When the tissue distribution of Cre-mediated deletions was determined, it correlated with the tissue distribution of Hdh mRNA levels. Testes and brain had the highest levels of Hdh mRNA and were the only organs exhibiting Cre-loxP recombination at the Hdh locus. This same transgenic Cre line was able to recombine loxP sites at a different location, the R26 locus, in all tissues examined. The tissue specificity of recombination at the Hdh locus depends upon the transgenic Cre founder line. Other Cre-expressing lines result in Hdh deletions in many tissues (14). The difference might be due to different overall levels of Cre expression in the lines. Our Cre line might not produce enough recombinase to be effective in tissues where the Hdh locus is less accessible. Further characterization will be needed to determine the usefulness of our Cre lines in probing chromatin in vivo. The correlation among tissues with high levels of recombination at the Hdh locus and high Hdh mRNA levels is a step towards establishing such a method, which would be useful in assessing therapeutics designed to reduce expression of the HD gene by altering chromatin.
Our data also show that mice homozygous for long CAG repeats had reduced levels of Hdh mRNA. Although in HD patients mRNA levels from disease length alleles were comparable to levels from wild-type alleles, the assays were not reported as quantitative in nature (1). The effect in mice is likely exaggerated by the greater difference in repeat length in these mice [150 vs. 7 CAGs (3,28,30) compared with most patients (less than 60 vs. approximately 20 (15,27)). Alternatively, the toxic properties of the long repeat mutation might reduce expression of Hdh. The HD mutation affects the mRNA levels of several genes, and we cannot exclude the possibility that the mutation decreases the mRNA level of Hdh itself (32). Other possible mechanisms might include a difference in mRNA stability. Long CAG repeats form hairpin structures in RNA that might be weakly recognized by cellular systems designed to destroy double-stranded RNAs (13,42). Long CAG repeats might also cause a reduction in transcription of the Hdh gene. CAG repeats in DNA are known to bind tightly to histones (49), and this or some other unusual structural feature of the repeat may impede RNA polymerase. Further study of the mechanism by which long CAG repeats diminish the amount of Hdh mRNA might elucidate a mechanism amenable to pharmacological enhancement.
ACKNOWLEDGMENTS
We would like to thank Dr. Dipankar Manna, Andrew B. Crouse, and especially Dr. Kumar Pandya for critical comments on the manuscript, Dr. Tim Townes for use of his real-time PCR machine, and Jinxiang Ren for pronuclear injections. This work was funded by the Hereditary Disease Foundation’s Cure HD Initiative, NIH RO1 NS34492 (P.J.D.), and the Department of Biochemistry and Molecular Genetics of the University of Alabama at Birmingham.
REFERENCES
- 1. Ambrose C. M.; Duyao M. P.; Barnes G.; Bates G. P.; Lin C. S.; et al. Structure and expression of the Huntington’s disease gene: Evidence against simple in-activation due to an expanded CAG repeat. Somat. Cell Mol. Genet. 20:27–38; 1994. [DOI] [PubMed] [Google Scholar]
- 2. Andrew S. E.; Goldberg Y. P.; Kremer B.; Telenius H.; Theilmann J.; et al. The relationship between trinucleotide (CAG) repeat length and clinical features of Huntington’s disease. Nat. Genet. 4:398–403; 1993. [DOI] [PubMed] [Google Scholar]
- 3. Barnes G. T.; Duyao M. P.; Ambrose C. M.; McNeil S.; Persichetti F.; et al. Mouse Huntington’s disease gene homolog (Hdh). Somat. Cell Mol. Genet. 20:87–97; 1994. [DOI] [PubMed] [Google Scholar]
- 4. Bhide P. G.; Day M.; Sapp E.; Schwarz C.; Sheth A.; et al. Expression of normal and mutant huntingtin in the developing brain. J. Neurosci. 16:5523–5535; 1996. [DOI] [PMC free article] [PubMed] [Google Scholar]
- 5. Blake W.; Kaern M.; Cantor C.; Collins J. Noise in eukaryotic gene expression. Nature 422:633–637; 2003. [DOI] [PubMed] [Google Scholar]
- 6. Boado R. J.; Kazantsev A.; Apostol B. L.; Thompson L. M.; Pardridge W. M. Antisense-mediated down-regulation of the human huntingtin gene. J. Pharmacol. Exp. Ther. 295:239–243; 2000. [PubMed] [Google Scholar]
- 7. Britton J. W.; Uitti R. J.; Ahlskog J. E.; Robinson R. G.; Kremer B.; et al. Hereditary late-onset chorea without significant dementia: Genetic evidence for substantial phenotypic variation in Huntington’s disease. Neurology 45:443–447; 1995. [DOI] [PubMed] [Google Scholar]
- 8. Caplen N. J.; Taylor J. P.; Statham V. S.; Tanaka F.; Fire A.; et al. Rescue of polyglutamine-mediated cytotoxicity by double-stranded RNA-mediated RNA interference. Hum. Mol. Genet. 11:175–184; 2002. [DOI] [PubMed] [Google Scholar]
- 9. Carlock L.; Walker P. D.; Shan Y.; Gutridge K. Transcription of the Huntington disease gene during the quinolinic acid excitotoxic cascade. Neuroreport 6: 1121–1124; 1995. [DOI] [PubMed] [Google Scholar]
- 10. Cearley J. A.; Detloff P. J. Efficient repetitive alteration of the mouse Huntington’s disease gene by management of background in the tag and exchange gene targeting strategy. Transgenic Res. 10(6):479–488; 2001. [DOI] [PubMed] [Google Scholar]
- 11. Cockerill P. N. Identification of DNaseI hypersensitive sites within nuclei. Methods Mol. Biol. 130:29–46; 2000. [DOI] [PubMed] [Google Scholar]
- 12. Coles R.; Caswell R.; Rubinsztein D. C. Functional analysis of the Huntington’s-disease (HD) gene promoter. Hum. Mol. Genet. 7:791–800; 1998. [DOI] [PubMed] [Google Scholar]
- 13. Denli A. M.; Hannon G. J. RNAi: An ever-growing puzzle. Trends Biochem. Sci. 28:196–201; 2003. [DOI] [PubMed] [Google Scholar]
- 14. Dietrich P.; Dragatsis I.; Xuan S.; Zeitlin S.; Efstra-tiadis A. Conditional mutagenesis in mice with heat shock promoter-driven cre transgenes. Mamm. Genome 11:196–205; 2000. [DOI] [PubMed] [Google Scholar]
- 15. Duyao M.; Ambrose C.; Myers R.; Novelletto A.; Persichetti F.; et al. Trinucleotide repeat length instability and age of onset in Huntington’s disease. Nat. Genet. 4:387–392; 1993. [DOI] [PubMed] [Google Scholar]
- 16. Ferrante R. J.; Gutekunst C. A.; Persichetti F.; McNeil S. M.; Kowall N. W.; et al. Heterogeneous topographic and cellular distribution of huntingtin expression in the normal human neostriatum. J. Neurosci. 17: 3052–3063; 1997. [DOI] [PMC free article] [PubMed] [Google Scholar]
- 17. Gao B.; Chen J.; Johnson C.; Kunos G. Both the cyclic AMP response element and the activator protein 2 binding site mediate basal and cyclic AMP-induced transcription from the dominant promoter of the rat alpha 1B-adrenergic receptor gene in DDT1MF-2 cells. Mol. Pharmacol. 52:1019–1026; 1997. [DOI] [PubMed] [Google Scholar]
- 18. Georgiou N.; Bradshaw J. L.; Chiu E.; Tudor A.; O’Gorman L.; et al. Differential clinical and motor control function in a pair of monozygotic twins with Huntington’s disease. Mov. Disord. 14:320–325; 1999. [DOI] [PubMed] [Google Scholar]
- 19. Grewal S. I.; Moazed D. Heterochromatin and epigenetic control of gene expression. Science 301:798–802; 2003. [DOI] [PubMed] [Google Scholar]
- 20. Harper P. S. Genetic aspects of Huntington’s disease. In: Harper P. S., ed. Huntington’s disease. London: W. B. Saunders Company Ltd.; 1991:281–316. [Google Scholar]
- 21. Hebb M. O.; Denovan-Wright E. M.; Robertson H. A. Expression of the Huntington’s disease gene is regulated in astrocytes in the arcuate nucleus of the hypo-thalamus of postpartum rats. FASEB J. 13:1099–1106; 1999. [DOI] [PubMed] [Google Scholar]
- 22. Hewetson A.; Chilton B. S. An Sp1-NF-Y/progester-one receptor DNA binding-dependent mechanism regulates progesterone-induced transcriptional activation of the rabbit RUSH/SMARCA3 gene. J. Biol. Chem. 278:40177–40185; 2003. [DOI] [PubMed] [Google Scholar]
- 23. Hilditch-Maguire P.; Trettel F.; Passani L. A.; Auerbach A.; Persichetti F.; et al. Huntingtin: An iron-regulated protein essential for normal nuclear and perinuclear organelles. Hum. Mol. Genet. 9:2789–2797; 2000. [DOI] [PubMed] [Google Scholar]
- 24. Huntington’s Disease Collaborative Research Group. A novel gene containing a trinucleotide repeat that is expanded and unstable on Huntington’s disease chromosomes. Cell 72:971–983; 1993. [DOI] [PubMed] [Google Scholar]
- 25. Kachinskas D. J.; Phillips M. A.; Qin Q.; Stokes J. D.; Rice R. H. Arsenate perturbation of human kera-tinocyte differentiation. Cell Growth Differ. 5:1235–1241; 1994. [PubMed] [Google Scholar]
- 26. Koyama S.; Takagi H.; Otani A.; Oh H.; Nishimura K.; et al. Inhibitory mechanism of vascular endothelial growth factor (VEGF) by bucillamine. Br. J. Pharmacol. 137:901–909; 2002. [DOI] [PMC free article] [PubMed] [Google Scholar]
- 27. Kremer B.; Goldberg P.; Andrew S. E.; Theilmann J.; Telenius H.; et al. A worldwide study of the Hunt-ginton’s disease mutation. The sensitivity and specificity of measuring CAG repeats. N. Engl. J. Med. 330: 1401–1406; 1994. [DOI] [PubMed] [Google Scholar]
- 28. Lin B.; Nassir J.; MacDonald H.; Hutchinson G.; Graham R.; et al. Sequence of the murine Huntington disease gene: Evidence for conservation, and polymorphism in a triplet (CCG) repeat alternate splicing. Hum. Mol. Genet. 3:85–92; 1994. [DOI] [PubMed] [Google Scholar]
- 29. Lin B.; Nasir J.; Kalchman M. A.; McDonald H.; Zeisler J.; et al. Structural analysis of the 5′ region of mouse and human Huntington disease genes reveals conservation of putative promoter region and di- and trinucleotide polymorphisms. Genomics 25:707–715; 1995. [DOI] [PubMed] [Google Scholar]
- 30. Lin C. H.; Tallaksen-Greene S.; Chien W. M.; Cear-ley J. A.; Jackson W. S.; et al. Neurological abnormalities in a knock-in mouse model of Huntington’s disease. Hum. Mol. Genet. 10:137–144; 2001. [DOI] [PubMed] [Google Scholar]
- 31. Lin J. X.; Leonard W. J. The immediate-early gene product Egr-1 regulates the human interleukin-2 receptor beta-chain promoter through noncanonical Egr and Sp1 binding sites. Mol. Cell. Biol. 17:3714–3722; 1997. [DOI] [PMC free article] [PubMed] [Google Scholar]
- 32. Luthi-Carter R.; Andrew A.; Peters N. L.; Solano S. M.; Hollingsworth Z. R.; et al. Decreased expression of striatal signaling genes in a mouse model of Huntington’s disease. Hum. Mol. Genet. 9:1259–1271; 2000. [DOI] [PubMed] [Google Scholar]
- 33. Menalled L. B.; Chesselet M. F. Mouse models of Huntington’s disease. Trends Pharmacol. Sci. 23:32–39; 2002. [DOI] [PubMed] [Google Scholar]
- 34. Miller V. M.; Xia H.; Marrs G. L.; Gouvion C. M.; Lee G.; et al. Allele-specific silencing of dominant disease genes. Proc. Natl. Acad. Sci. USA 100:7195–7200; 2003. [DOI] [PMC free article] [PubMed] [Google Scholar]
- 35. Myers R. H.; Leavitt J.; Farrer L. A.; Jagadeesh J.; McFarlane H.; et al. Homozygote for Huntington’s disease. Am. J. Hum. Genet. 45:615–618; 1989. [PMC free article] [PubMed] [Google Scholar]
- 36. Persichetti F.; Carlee L.; Faber P. W.; McNeil S. M.; Ambrose C. M.; et al. Differential expression of normal and mutant Huntington’s disease gene alleles. Neurobiol. Dis. 3:183–190; 1996. [DOI] [PubMed] [Google Scholar]
- 37. Phylactou L. A.; Darrah C.; Wood M. J. Ribozyme-mediated trans-splicing of a trinucleotide repeat. Nat. Genet. 18:378–381; 1998. [DOI] [PubMed] [Google Scholar]
- 38. Pritchard C. C.; Hsu L.; Delrow J.; Nelson P. S. Project normal: Defining normal variance in mouse gene expression. Proc. Natl. Acad. Sci. USA 98: 13266–13271; 2001. [DOI] [PMC free article] [PubMed] [Google Scholar]
- 39. Reddy P. H.; Williams M.; Charles V.; Garrett L.; Pike-Buchanan L.; et al. Behavioral abnormalities and selective neuronal loss in HD transgenic mice expressing mutated full length HD-cDNA. Nat. Genet. 20: 198–202; 1998. [DOI] [PubMed] [Google Scholar]
- 40. Schwikardi M.; Droge P. Use of site-specific recombination as a probe of nucleoprotein complex formation in chromatin. Eur. J. Biochem. 268:6256–6262; 2001. [DOI] [PubMed] [Google Scholar]
- 41. Snell R. G.; MacMillan J. C.; Cheadle J. P.; Fenton I.; Lazarou L. P.; et al. Relationship between trinucleotide repeat expansion and phenotypic variation in Huntington’s disease. Nat. Genet. 4:393–397; 1993. [DOI] [PubMed] [Google Scholar]
- 42. Sobczak K.; de Mezer M.; Michlewski G.; Krol J.; Krzyzosiak W. J. RNA structure of trinucleotide repeats associated with human neurological diseases. Nucleic Acids Res. 31:5469–5482; 2003. [DOI] [PMC free article] [PubMed] [Google Scholar]
- 43. Soriano P. Generalized lacZ expression with the ROSA26 Cre reporter strain. Nat. Genet. 21:70–71; 1999. [DOI] [PubMed] [Google Scholar]
- 44. Squitieri F.; Gellera C.; Cannella M.; Mariotti C.; Cislaghi G.; et al. Homozygosity for CAG mutation in Huntington disease is associated with a more severe clinical course. Brain 126:946–955; 2003. [DOI] [PubMed] [Google Scholar]
- 45. Stine O. C.; Pleasant N.; Franz M. L.; Abbott M. H.; Folstein S. E.; et al. Correlation between the onset age of Huntington’s disease and length of the trinucleotide repeat in IT-15. Hum. Mol. Genet. 2:1547–1549; 1993. [DOI] [PubMed] [Google Scholar]
- 46. Tatter S. B.; Galpern W. R.; Hoogeveen A. T.; Isacson O. Effects of striatal excitotoxicity on huntingtin-like immunoreactivity. Neuroreport 6:1125–1129; 1995. [DOI] [PubMed] [Google Scholar]
- 47. Torigoe T.; Izumi H.; Ishiguchi H.; Uramoto H.; Murakami T.; et al. Enhanced expression of the human vacuolar H+-ATPase c subunit gene (ATP6L) in response to anticancer agents. J. Biol. Chem. 277:36534–36543; 2002. [DOI] [PubMed] [Google Scholar]
- 48. van Dellen A.; Blakemore C.; Deacon R.; York D.; Hannan A. J. Delaying the onset of Huntington’s in mice. Nature 404:721–722; 2000. [DOI] [PubMed] [Google Scholar]
- 49. Wang Y. H.; Amirhaeri S.; Kang S.; Wells R. D.; Griffith J. D. Preferential nucleosome assembly at DNA triplet repeats from the myotonic dystrophy gene. Science 265:669–671; 1994. [DOI] [PubMed] [Google Scholar]
- 50. Wexler N. S.; Young A. B.; Tanzi R. E.; Travers H.; Starosta-Rubinstein S.; et al. Homozygotes for Huntington’s disease. Nature 326:194–197; 1987. [DOI] [PubMed] [Google Scholar]
- 51. Wheeler V. C.; Gutekunst C. A.; Vrbanac V.; Lebel L. A.; Schilling G.; et al. Early phenotypes that presage late-onset neurodegenerative disease allow testing of modifiers in Hdh CAG knock-in mice. Hum. Mol. Genet. 11:633–640; 2002. [DOI] [PubMed] [Google Scholar]
- 52. Williams R. Mapping genes that modulate brain development: A quantitative genetic approach. In: Goffinet A.; Rakic P., eds. Mouse brain development. New York: Springer Verlag; 2000:21–49. [DOI] [PubMed] [Google Scholar]
- 53. Yen L.; Strittmatter S. M.; Kalb R. G. Sequence-specific cleavage of Huntingtin mRNA by catalytic DNA. Ann. Neurol. 46:366–373; 1999. [DOI] [PubMed] [Google Scholar]