



Abstract
Rubratoxin B (RB) is a mycotoxin with potential neurotoxic effects that have not yet been characterized. Based on existing evidence that RB interferes with mitochondrial electron transport to produce oxidative stress in peripheral tissues, we hypothesized that RB would produce oxidative damage to macromolecules in specific brain regions. Parameters of oxidative DNA damage and repair, lipid peroxidation, and superoxide dismutase (SOD) activity were measured across six mouse brain regions 24 h after administration of a single dose of RB. Lipid peroxidation and oxidative DNA damage were either unchanged or decreased in all brain regions in RB-treated mice compared with vehicle-treated mice. Concomitant with these decreased indices of oxidative macromolecular damage, SOD activity was significantly increased in all brain regions. Oxyguanosine glycosylase activity (OGG1), a key enzyme in the repair of oxidized DNA, was significantly increased in three brain regions—cerebellum (CB), caudate/putamen (CP), and cortex (CX)—but not in the hippocampus (HP), midbrain (MB), and pons/medulla (PM). The RB-enhanced OGG1 catalytic activity in these brain regions was not due to increased OGG1 protein expression, but was a result of enhanced catalytic activity of the enzyme. In conclusion, specific brain regions responded to an acute dose of RB by significantly altering SOD and OGG1 activities to maintain the degree of oxidative DNA damage equal to, or less than, that of normal steady-state levels.
Key words: Rubratoxin B, Oxidative stress, DNA damage and repair, Superoxide dismutase (SOD), Mouse brain regions
MYCOTOXINS are toxic fungal metabolites that are structurally diverse, common contaminants of the ingredients of animal feed and human food. These fungal products exhibit a range of pharmacological activities that have been utilized in development of mycotoxins or mycotoxin derivatives as antibiotics, growth promoters, and other kinds of drugs; still others have been developed as biological and chemical warfare agents (1). Bombs and ballistic missiles laden with biological agents, including mycotoxins, are believed to have been deployed by Iraq during Operation Desert Storm (23). In light of the excess incidence of amyotrophic lateral sclerosis in young Gulf War veterans (7), it is important not to forget the potential neurotoxic effects of low doses of myco-toxins. Although much is known about the lethal effects of the aflatoxins, little is known about the acute and long-term effects of rubratoxin B (RB) on the adult nervous system.
RB is a metabolite of the molds Penicillum rubrum and Penicillum purpurogenum. These molds commonly contaminate cereals and foodstuffs and grow on damp tents and fabrics. RB is not known to produce a serious health hazard in this naturally occurring form, but pure RB is a bisanhydride lactone with hepatotoxic (17) and teratogenic properties (10–12). Investigation of the effects of acute and chronic exposure to RB on the nervous system has been scarce, even though neuronal tissue appears to be very susceptible to the deleterious effect of RB in teratogenic studies (9).
RB has numerous biochemical actions including the inhibition of (Na+-K+)-ATPase (18), inhibition of the hepatic cytochrome P-450-dependent monooxygenase system (19), reduction of hepatic and renal nonprotein sulfhydryl content (6), and inhibition of gap junctional intercellular communication (16). It was found that RB caused shifts in the ultraviolet absorption spectra of DNA and RNA (21). The observed binding properties of RB can disrupt the integrity of DNA and RNA. RB has been shown to induce apoptosis (14,15) and internucleosomal fragmentation of DNA (14).
Studies with isolated mouse liver mitochondria revealed that RB disrupted mitochondrial respiration and depressed oxygen consumption (9). The principal site of action of RB in the mitochondrial electron transport system was found to be between cytochrome C1 and the termination of electron flow (9). Ochratoxin, a related mycotoxin, has been reported to alter mitochondrial respiration and oxidative phosphorylation through impairment of the mitochondrial membrane and inhibition of the succinate-dependent electron transfer activities of the respiratory chain (22).
The overall objective was to study RB neurotoxicity in the context of oxidative stress induced by inhibition of mitochondrial electron transport in brain tissues. Inhibition of oxidative phosphorylation would be expected to result in increased generation of oxyradicals and decreased production of ATP (8). We hypothesized that RB-induced alteration of oxidative processes would not be homogeneous across all brain regions but would reflect the capacity of distinct brain regions to upregulate antioxidative mechanisms and repair processes. Parameters of oxidative stress measured included lipid peroxidation (thiobarbituric acid-reactive substances or TBARS), superoxide dismutase (SOD) activity, oxidative DNA damage and repair in each of six brain regions: cerebellum (CB), cortex (CX), hippocampus (HP), midbrain (MB), caudate/putamen (CP), and pons/medulla (PM). Accumulation of 8-oxodG was chosen as an indicator of DNA damage, and activity of DNA glycosylase was used as an index of DNA repair.
MATERIALS AND METHODS
Materials
RB, SOD, xantine oxidase, ribonuclease T1, HEPES, dithiotreitol (DTT), bovine serum albumin, and acrylamide/bisacrylamide (19:1) mixture were purchased from Sigma (St. Louis, MO). TEMED was from BioRad Laboratories (Hercules, CA). Protease inhibitors and 8-oxoguanine DNA glycosylase (mOGG1) were from Boehringer Mannheim (Indianapolis, IN). Synthetic oligonucleotide containing 8-oxodG was from Trevigen (Gaithersburg, MD). [32P]ATP (7000 Ci/mmol) was from ICN Biomedical, Inc. (Costa Mesa, CA). Phosphorylation buffer, 3′-phosphate-free T4 polynucleotide kinase, RNase, proteinase K, nuclease P1, and alkaline phosphatase were from Roche Diagnostic Co. (Indianapolis, IN). G-25 Microcentrifuge Spin Column was from Shelton Scientific (Shelton, CT). mOGG1 antibody was from Alpha Diagnostic (San Antonio, TX). ECL Western blotting analysis system was from Amersham Biosciences (Piscataway, NJ). All other reagents were ACS grade and from Sigma Chemical Co.
Animals and Treatment
The animal protocol used in this study was approved by the University of South Florida (USF) IUCAC committee. The protocol was also reviewed and approved by the USF Division of Comparative Medicine, which is fully accredited by AAALAC International and managed in accordance with the Animal Welfare Regulations, the PHS Policy, the FDA Good Laboratory Practices, and the IACUC’s Policies. Male Swiss ICR mice (22 ± 2 g) were obtained from Jackson Laboratories (Bar Harbor, ME). They were housed five per cage at the temperature of 21 ± 2°C with 12-h light/dark cycle and free access to food and water. Mice were divided into experimental (n = 10) and control (n = 5) groups. Animals were injected with either RB dissolved in DMSO (5 mg/kg, IP) or vehicle. Mice were sacrificed with CO2 24 h after treatment. The brains were removed and immediately dissected in a petri dish on ice (4°C).
Isolation of Brain Regions
The brain was separated into six regions under a dissecting microscope in the following order. The cerebellar peduncles were cut first, and the brain stem was removed from the diencephalon. The ventral and dorsal parts of the midbrain (MB) were dissected at the level of the caudal end of the cerebral peduncles at the junction with the pons. The pons and medulla (PM) were separated together by cutting the ponto–medullary junction. The cerebral hemispheres were opened with a sagittal cut along the longitudinal tissue and the hippocampus (HP) was isolated, followed by caudate and putamen (CP). Finally, the cerebellum (CB) and cerebral cortex (CX) were harvested and all the samples were kept frozen at −70°C until assay.
Measurement of DNA Damage
Steady-state level of 8-oxodG was used as a marker of oxidative DNA damage. The procedure for DNA isolation was basically the same as reported previously (2). Approximately 150 mg of brain sample was used for extraction. Briefly, tissue was pulverized in liquid nitrogen, using mortar and pestle, sonicated in 10 mM ethylenediamine tetraacetic acid (EDTA), and centrifuged. The pellet was treated with DNAase-free RNAase followed by digestion with proteinase K. The protein fraction was separated from DNA by three consecutive organic extractions. The DNA was precipitated by ethanol and incubated overnight at −20°C. The ratio in absorbance at 260/280 nm was employed for qualification of DNA purity.
The purified DNA was digested with nuclease P1 followed by treatment with alkaline phosphatase. The mixture of deoxynucleosides was analyzed with HPLC using 5% methanol dissolved in 100 mM of sodium acetate (pH 5.2) as a mobile phase, and 8-oxodG was detected with an electrochemical detector (ESA Coulochem Model 5100A) at +0.4 V. 2-dG was detected at 260 nm in the same sample using a Perkin Elmer 785A Programmable Absorbance Detector (Perkin Elmer, Norwalk, CT) connected in series with the electrochemical detector. 8-oxodG level was expressed as ratio of 8-oxodG/2-dG. Data were recorded, stored, and analyzed on a PC Pentium computer using ESA 500 Chromatography Data System Software.
Assessment of OGG1 Activity
The extraction of OGG1 for enzymatic assay was performed as described previously (2). Briefly, brain tissue was pulverized in liquid nitrogen, using mortar and pestle. Homogenization buffer contained 20 mM Tris-base (pH 8.0), 1 mM EDTA, 1 mM DTT, 0.5 mM spermine, 0.5 mM spermidine, 50% glycerol, and protease inhibitors. Homogenates were rocked for 30 min after addition of 1/10 volume 2.5 M KCl and spun at 14,000 rpm for 30 min. The supernatant was aliquoted and specimens were kept frozen at −70°C until assay. Protein concentration was measured using the bicinchoninic acid (20).
OGG1 activity was measured by incision assay as previously described (2). To prepare 32P-labeled duplex oligonucleotide, 20 pmol of synthetic probe containing 8-oxodG (Trevigen, Gaithersburg, MD) was incubated at 37°C with [32P]ATP and polynucleotide T4 kinase. To separate the unincorporated free [32P]ATP, the reaction mixtures were spun through a G25 spin column. Complementary oligonucleotides were annealed in 10 mM Tris (pH 7.8), 100 mM KCl, 1 mM EDTA by heating the samples 5 min at 80°C and gradually cooling at room temperature.
Incision reaction (20 μl) contained 40 mM HEPES (pH 7.6), 5 mM EDTA, 1 mM DTT, 75 mM KCl, purified bovine serum albumin, 100 fmol of 32P-labeled duplex oligonucleotide, and protein extract (30 μg). The reaction mixture was incubated at 37°C for 2 h and placed on ice to terminate the reaction. Then 20 μl of loading buffer containing 90% formamide, 10 mM NaOH, and blue-orange dye was added to each sample. After 5 min of heating at 95°C the samples were resolved in a denaturing 20% polyacrylamide gel containing 7 M urea. The gel was visualized using Biorad-363 Phosphoimager System, and OGG1 incision activity was calculated as the amount of radioactivity in the band corresponding to the specific cleavage product over the total radioactivity in the lane.
Kinetic Study of OGG1 Incision Reaction
Reaction mixtures and conditions used for kinetic studies were identical to OGG1 incision activity assay, but amounts of the appropriate 32P-labeled oligonucleotide duplex were varied. The enzyme concentration and reaction time was adjusted to cleave no more than 10% of the substrate. Kinetic parameters were calculated using a Jandel SigmaPlot version 5.00 nonlinear fit routine. Three independent experiments were performed for each analysis.
Western Immunoblotting
The 8-oxoguanine DNA glycosylases extracted from different regions of brain were separated on a 12% SDS-PAGE and transferred onto a nitrocellulose membrane using a Biorad Semi-Dry Transblot technique. The membranes were blocked overnight at 4°C in a solution containing 5% dry milk and Tris-buffered saline (TBS) composed of 200 mM NaCl and 50 mM Tris-HCl (pH 7.4), and supplemented with 0.04% Tween-20. The membranes were rinsed in TBS-Tween mixture and incubated overnight at 4°C with mOGG1 antibody (Alpha Diagnostic, TX) using 1:1000 dilution by 1% dry milk prepared on TBS-Tween. After washing (3 × 10 min) with TBS-Tween at 4°C, the membranes were incubated with goat anti-mouse antibody (1:2000 dilution) conjugated to horseradish peroxidase (Santa Cruz Biotechnology, CA) for 1 h at room temperature. The blot was developed by ECL kit (Amersham Biosciences, Piscataway, NJ).
Native PAGE
OGG1 extracted from different regions of the brain was mixed with native buffer composed of 0.1 M Tris-HCl (pH 6.8), 30% glycerol, and 0.01% bromophenol blue and separated on a nondenaturing 10% polyacrylamide gel at 120 V. Gel was sliced by a razor blade along the lanes into sections 1 mm thick. A single 1-mm-thick section was homogenized with a Teflon hand homogenizer in 20 μl of incision reaction mixture and enzymatic activity of OGG1 was assayed as described above.
Lipid Peroxidation
Formation of lipid peroxide derivatives was evaluated by measuring thiobarbituric acid-reactive substances (TBARS) according to Cascio et al. (3). Briefly, the different regions of the brain were individually homogenized in ice-cold 1.15% KCl (w/v). Then 0.4 ml of the homogenates was mixed with 1 ml of 0.375% TBA, 15% TCA (w/v), 0.25 N HCl, and 6.8 mM butylated-hydroxytoluene (BHT), placed in a boiling water bath for 10 min, removed, and allowed to cool on ice. Following centrifugation at 3000 rpm for 10 min, the absorbance in the super-natants was measured at 532 nm. The amount of TBARS produced was expressed as nanomole TBARS per milligram of protein using malondialdehyde bis-(dimethyl acetal) for calibration.
SOD Assay
Determination of SOD activity in mouse brain regions was based on inhibition of nitrite formation in reaction of oxidation of hydroxylammonium with superoxide anion radical (5). Nitrite formation was generated in a mixture containing 25 μl xanthine (15 mM), 25 μl hydroxylammonium chloride (10 mM), 250 μl phosphate buffer (65 mM, pH 7.8), 90 μl distilled water, and 100 μl xanthine oxidase (0.1 U/ml) used as a starter of the reaction. Inhibitory effect of inherent SOD was assayed at 25°C during 20 min of incubation with 10 μl of brain tissue extracts. Determination of the resulting nitrite was performed upon the reaction (20 min at room temperature) with 0.5 ml sulfanilic acid (3.3 mg/ml) and 0.5 ml a-naphthyl-amine (1 mg/ml). Optical absorbance at 530 nm was measured with Ultrospec III spectrophotometer (Pharmacia, LKB). The results were expressed as units of SOD activity calculated per milligram of protein. The amount of protein in the samples was determined using bicinchoninic acid (20).
Statistical Analysis
The results were reported as mean ± SE for at least five different preparations, assayed in duplicate. For electrophoresis two different gels were run. The differences between samples were analyzed by the Student’s t-test, and a p < 0.05 was considered as statistically significant.
RESULTS
Administration of RB to mice (5 mg/kg body weight, IP) was chosen on the basis of a dose–toxicity curve (data not shown). That dose produced significant immobilization and decrease body temperature of animals. However, it resulted in no visible gross damage to brain but altered brain biochemistry. Namely, lipid peroxidation, indicated by TBARS levels, was decreased in all regions of the brain of the animals exposed to RB compared with control mice (Fig. 1). In HP, MB, and PM the TBARS levels were significantly (p < 0.05) different from the control. In the PM region, a 2.2-fold decrease in TBARS was observed.
Figure 1.
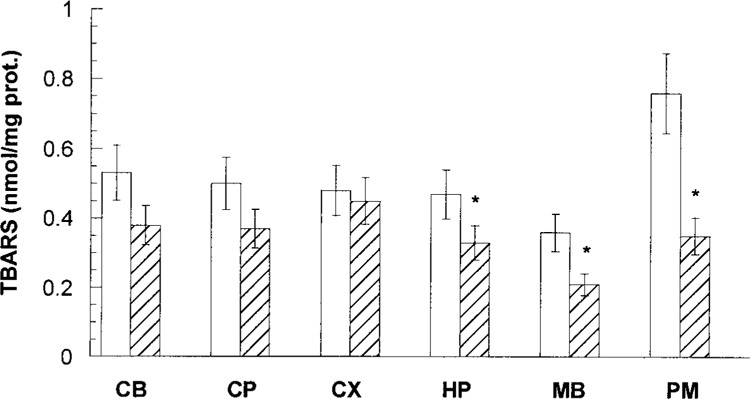
Content of TBARS in different regions of mouse brain exposed to RB (striped bars) in comparison with control (opened bars). All values represent mean ± SE. The significantly (p < 0.05) different levels of TBARS in comparison with control are indicated by asterisks.
Oxidative DNA damage, indicated by steady-state levels of 8-oxodG, showed a trend towards decreased levels across all brain regions (Table 1). Statistically significant differences in 8-oxod-dG were found only in the PM region, where levels were reduced to 30% below control. Oxidative damage in the MB was also distinctly decreased, but did not reach statistical significance.
TABLE 1.
EVALUATION OF OXIDATIVE DNA DAMAGE, OXIDATIVE DNA REPAIR (OGG1), AND SUPEROXIDE DISMUTASE ACTIVITIES ACROSS DIFFERENT REGIONS OF MOUSE BRAIN EXPOSED TO RB IN COMPARISON WITH CONTROL
| Brain Region | Animal Group | DNA Damage (ppm) | OGG1 Incision Activity (pM min1 mg prot1) | Activity of SOD (U/mg prot.) |
|---|---|---|---|---|
| CB | control | 18.4 ± 2.2 | 2.6 ± 0.2 | 42.5 ± 4.6 |
| RB intoxication | 16.7 ± 2.1 | 4.06 ± 0.55* | 63.8 ± 7.5* | |
| CP | control | 20.6 ± 3.8 | 3.05 ± 0.24 | 42.4 ± 2.7 |
| RB intoxication | 18.2 ± 1.8 | 4.27 ± 0.45* | 72.6 ± 6.1* | |
| CX | control | 20.7 ± 0.8 | 2.52 ± 0.4 | 34.8 ± 1.5 |
| RB intoxication | 20.1 ± 5.1 | 3.86 ± 0.32* | 64.5 ± 11.25* | |
| HP | control | 19.4 ± 1.2 | 2.86 ± 0.31 | 32.6 ± 3.2 |
| RB intoxication | 16.1 ± 1.9 | 3.42 ± 0.33 | 78.14 ± 12.1* | |
| MB | control | 26.9 ± 8.3 | 2.79 ± 0.22 | 48.6 ± 2.1 |
| RB intoxication | 20.2 ± 6.4 | 2.43 ± 0.19 | 112.5 ± 16.4* | |
| PM | control | 33.0 ± 2.4 | 3.4 ± 0.26 | 38.7 ± 3.8 |
| RB intoxication | 22.7 ± 0.9* | 3.0 ± 0.27 | 105.5 ± 14.8* |
Values represent mean ±. The extent of DNA damage was calculated from the amount of 8-oxodG (fmol) contained in 1 nmol of 2-dG and expressed as parts per million (ppm).
Significantly (p < 0.05) different compared with controls.
The decreased levels of oxidative DNA damage were associated with increased activity of the repair enzyme OGG1 (Table 1). There was a statistically significant increase in OGG1 activity in the CB, CP, and CX regions compared with the respective controls. In the HP the activity of OGG1 was higher than in control, though the difference did not reach statistical significance. Overall, the relative extent of DNA damage decreased linearly (Fig. 2) with relative activity of OGG1 (correlation factor was −0.9545). For both specific OGG1 and 8-oxodG relative indices were calculated as: relative indices = 100 × (VRB − VC)/VC, where VRB are values obtained in RB experiment and VC in control.
Figure 2.
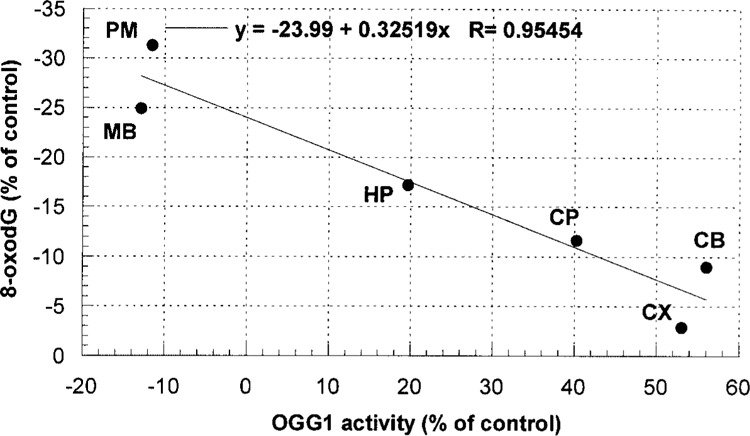
Relationship between relative indices of OGG1 activity and accumulation of 8-oxodG in various regions of mouse brain. Relative indices represent values normalized to the correspondent controls.
The results in Table 1 demonstrated upregulation of SOD activity in RB-treated animals compared with control. The extent of increased SOD activity in different regions of the brain revealed a negative correlation with the level of 8-oxodG. Namely, the association between 8-oxodG and SOD activity can be expressed by the linear equation with the correlation factor of −0.8521: 8-oxodG = −0.19 × (SOD) + 4.6.
Western blot analysis was carried out to elucidate the source of OGG1 activity (Fig. 3). It was found that protein expression levels of OGG1 were not significantly affected by RB exposure and there were no differences in regional levels of OGG1 when normalized to the total protein variations. One of the bands in the Western blot attributed to OGG1 matched the single band of pure enzyme. However, we found an additional band that was also labeled with OGG1 antibody. This band may be due to nonspecific binding with antibody or otherwise caused by existence of various isoforms of OGG1. To clarify this issue, we resolved OGG1 in native PAGE followed by cutting the gel into 1-mm strips and assaying the strips for OGG1 enzymatic (incision) activity. Figure 4 indicates the presence of two distinct bands with incision activity, which likely can be attributed to different isoforms of OGG1. Assaying the pure enzyme with the same procedure showed one single band possessing electrophoretic mobility identical to the major band of the tested sample (not shown).
Figure 3.
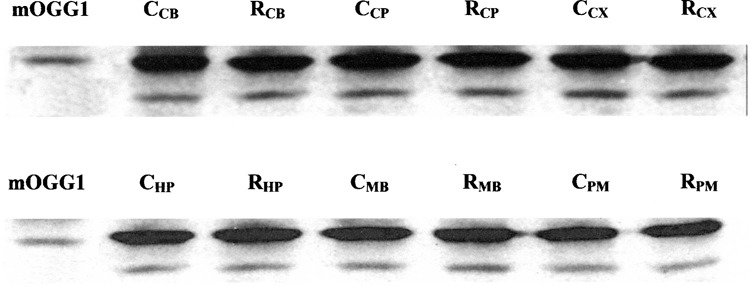
OGG1 expression in different regions of mouse brain. The Western blot lanes depicted by CCB–CPM array show the level of OGG1 in control mouse, and lanes from RCB to RPM represent OGG1 expression in the brain of RB-intoxicated animal. Pure enzyme presented as a positional marker for OGG1 identification.
Figure 4.
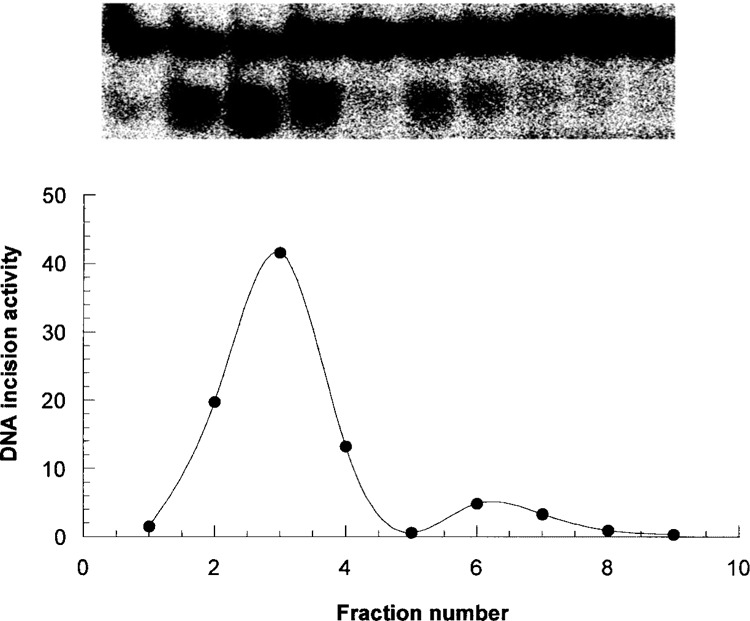
Determination of OGG1 on native PAGE. Enzymatic activity of OGG1 was assayed in every single fraction by using 32P-duplex oligonucleotide. Upper panel represents 32P-duplex oligonucleotide products visualized with Biorad-363 Phosphoimager System. Lower panel represent the averaged data of three experiments with OGG1 extracted from HP of control mouse. OGG1 activity was calculated as the percent of radioactivity in the band of specifically cleaved product over the total radioactivity in the lane.
The data are in agreement with kinetic behavior of OGG1 extracted from mouse brain. As can be seen from Figure 5, the oligonucleotide incision activity plotted against concentration reveals bimodal curves. The first part of incision activity reached saturation level in a range between 0 and 120 pM of substrate, but the second part needed higher concentrations of substrate (up to 500 pM). Computer modeling generated kinetic curves representing the experimental curve as a superposition of low- and high-saturated enzymatic isoforms. Separated incision activities were analyzed using Michaelis-Menten kinetics with the corresponding calculation of kinetic constants as shown in Table. 2.
Figure 5.
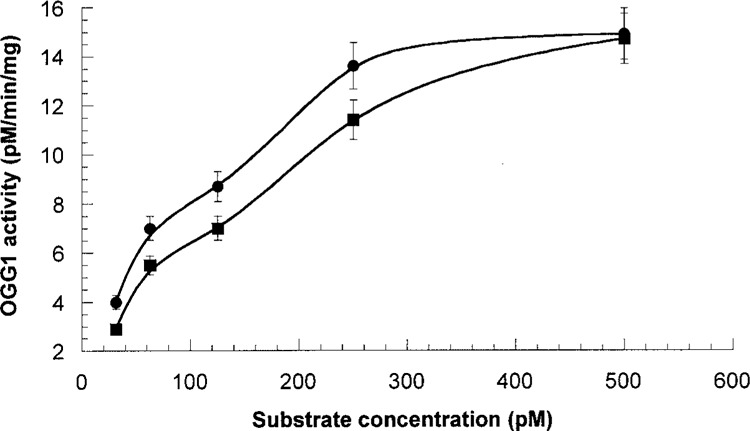
Kinetic behavior of OGG1 extracted from different regions of brain. Circles represent OGG1 obtained from CP of mouse exposed to RB. Squares represent OGG1 obtained from CP of control mouse. Data expressed by means of three replications.
TABLE 2.
KINETIC CHARACTERIZATION OF OGG1 ISOFORMS OBTAINED FROM CP OF CONTROL MOUSE AND FROM CP OF MOUSE SUBJECTED TO RB
| Isoform of OGG1 | Samples Tested | Kinetic Constants | ||
|---|---|---|---|---|
| K m (pM) | V max (pM min−1 mg−1) | V max/K m (min−1 mg−1) | ||
| High saturated | CP exposed to RB | 147.7 ± 12 | 20.1 ± 2.1 | 0.136 ± 0.01 |
| CP control | 312.9 ± 29 | 24.7 ± 2.6 | 0.078 ± 0.007 | |
| Low saturated | CP exposed to RB | 105.3 ± 9 | 17.7 ± 2 | 0.16 ± 0.02 |
| CP control | 140.5 ± 11 | 16.2 ± 1.5 | 0.11 ± 0.01 | |
DISCUSSION
Until the present report, the toxic effects of RB in adult brain had not been investigated. Administration of a single dose (5 mg/kg, IP) did not produce gross pathological changes in the brain, but resulted in paradoxically less oxidative damage to both lipids and DNA. In fact, the level of lipid peroxidation in the HP, MB, and PM was significantly less than that found in vehicle-treated controls. Similarly, RB did not increase oxidative DNA damage in any region of the brain after the injection but rather tended to lower the degree of damage. These results were unexpected in light of the putative pro-oxidant effects of the mycotoxin, but were explained by the robust upregulation of antioxidative and repair systems. RB treatment elicited an increase in activity of SOD, a major oxyradical scavenger, across all brain regions. In addition, measures of oxidative DNA repair were observed to increase in three of six brain regions following RB treatment.
Measurement of oxidative DNA damage revealed a trend towards decreased steady-state levels of 8-oxodG across all brain regions with a statistically significant decreased level in the PM. The DNA repair response assessed from the change in OGG1 activity was significantly increased in three brain regions (CX, CB, CP) but it is noteworthy that maintenance of normal steady-state levels of 8-oxodG was facilitated by the greatly enhanced SOD activity in regions of the brain where OGG1 did not increase.
The index of DNA damage utilized in this study was 8-oxodG, a major premutagenic DNA lesion generated from the reaction of oxyradicals with guanosine. Repair of this DNA lesion involves DNA N-glycosylases that hydrolyze the N-glycosylic bond between the 8-oxoG and deoxyribose, releasing the free base and leaving an apurinic/apyrimidinic (AP) site in DNA. Such AP sites are cytotoxic and mutagenic, and must be further processed. Some DNA glycosylases also have an associated AP lyase activity that cleaves the phosphodiester bond 3′ to the AP site (13). Formamidopyrimidine glycosylase (fpg, also named fapy-DNA glycosylase) is a prokaryotic protein originally identified in E. coli that catalyzes the excision of damaged purine bases such as 8-oxodG and 2,6-diamino-4-hydroxy-5-N-methylforma-midopyrimidine from double-stranded DNA. Two distinct homologues of fpg were identified in yeast, OGG1 and OGG2 (8-oxo-guanine glycosylase). The counterpart of yeast OGG1 has been identified in eukaryotes, and in particular human brain (hOGG1). hOGG1 has been cloned and shares 50% homology with mouse 8-oxoguanine glycosylase (mOGG1) (4,13). In the present report, the role of the brain’s DNA response to RB focused on the activity and regulation of the mammalian base excision repair enzyme OGG1.
In addition to the enzymatic assay, the expression of OGG1 protein was measured by Western im-munobloting. However, the detection of a second band with molecular weight essentially different from mOGG1 required more careful characterization. Separation of DNA glycosylases with native PAGE followed by assays of incision activity in various portions of gel disclosed heterogeneity of enzyme activity. Thus, enzymatic incision activity of tested extracts from mouse brain was comprised of two distinct isoforms of OGG1.
A detailed characterization of the isoforms of DNA glycosylase was performed by enzymatic kinetic analysis. Calculation of kinetic constants showed that RB treatment caused an increase in catalytic efficacy in both isoforms of OGG1. The response to RB-induced oxidative DNA damage was to enhance OGG1 catalytic activity (V max/K m) by a factor of 1.74. RB also increased affinity of OGG1 for the substrate that was demonstrated by decrease in magnitudes of the Michaelis-Menten constant (K m).
The augmentation of SOD activities in all brain regions and the increased affinity and catalytic activity of OGG1 elicited by RB treatment maintained 8-oxodG levels equal to, or below, the levels found in control animals. In the hippocampus, the levels of oxidative DNA damage following RB treatment was 2.7-fold less than that found in control mice. A similar phenomenon in mouse brain has been reported following treatment with the pro-oxidant diethylmaleate (DEM) (2). A single treatment with DEM elicited a significant increase in the activity of OGG1 in three brain regions with low basal levels of activity. There was no change in the activity of OGG1 in those regions with high basal levels of activity (HP, CP, and MB). This protective response elicited by pro-oxidants such as DEM and RB demonstrate efficient homeostatic mechanisms that maintain a healthy redox status in brain tissues.
The capacity to regulate OGG1 may be important for maintaining genomic integrity in the face of oxi-dative stress, but endogenous antioxidant defenses also played a role in the brain’s response to RB. In fact, the magnitude of the increases in SOD activity across all regions of the brain was greater than the observed increases in OGG1 activity. There was a correlation between OGG1 and SOD activities in different regions of the brain, suggesting that both enzymes may be regulated by a common signal triggered by oxidative stress.
The mechanisms underlying the vulnerability of the brain to different neurotoxicants are complex, but we hypothesize that the capacity to regulate and repair oxidative DNA damage, and to modulate endogenous antioxidant enzymes, are important determinants of a brain region’s susceptibility to RB. In the present study, which focused on a single time point 24 h after injection with RB, it was not the intent to determine the earliest signals for triggering and amplifying SOD and OGG1 activities. We imposed the limitation of a single time point for this study to focus on the differential response across brain regions. The robust antioxidant response and enhanced OGG1 catalytic activity in some regions resulted in much lower levels of oxidized base in those brain regions, providing a clue as to the selective vulnerability of specific neuronal populations located in those regions.
The data presented here clearly raise many questions that drive ongoing and future investigations. To further characterize the regulation of OGG1 in response to RB and similar neurotoxicants, it will be important to discover whether the earliest changes in SOD and OGG1 activity (3–6 h after exposure) are due to modification in catalytic activities of the protein and to what extent the response requires up-regulation of SOD and OGG1 mRNA and protein expression. Just as importantly, the effects of RB on viability of specific populations of neurons (e.g., dopaminergic neurons, striatal neurons) in the specific brain regions will need to be investigated and correlated with measures of oxidative DNA damage and repair. Finally, studies with graded doses of RB will determine whether RB can produce a rigid-akinetic parkinsonian syndrome similar to that produced by other mitochondrial toxicants such as rotenone.
ACKNOWLEDGMENT
This study was supported by VA Merit Grant and DOD grant USAMRMC 03281031.
REFERENCES
- 1. Bennett J. W.; Klich M. Mycotoxins. Clin. Microbiol. Rev. 16:497–516; 2003. [DOI] [PMC free article] [PubMed] [Google Scholar]
- 2. Cardozo-Pelaez F.; Stedeford T. J.; Brooks P. J.; Song S.; Sanchez-Ramos J. R. Effects of diethylmale-ate on DNA damage and repair in the mouse brain. Free Radic. Biol. Med. 33:292–298; 2002. [DOI] [PubMed] [Google Scholar]
- 3. Cascio C.; Guarneri R.; Russo D.; De Leo G.; Guarneri M.; Piccoli F.; Guarneri P. Pregnenolone sulfate, a naturally occurring excitotoxin involved in delayed retinal cell death. J. Neurochem. 74(6):2380–2391; 2000. [DOI] [PubMed] [Google Scholar]
- 4. Dianov G.; Bischoff C.; Piotrowski J.; Bohr V. A. Repair pathways for processing of 8-oxoguanine in DNA by mammalian cell extracts. J. Biol. Chem. 273: 33811–33816; 1998. [DOI] [PubMed] [Google Scholar]
- 5. Elstner E. F.; Heupel A. Inhibition of nitrite formation from hydroxylammoniumchloride: A simple assay for superoxide dismutase. Anal. Biochem. 70:616–620; 1976. [DOI] [PubMed] [Google Scholar]
- 6. Engelhardt J. A.; Carlton W. W.; Carlson G. P.; Hayes A. W. Reduction of hepatic and renal nonprotein sulfhydryl content and increased toxicity of rubratoxin B in the Syrian hamster and Mongolian gerbil. Toxicol. Appl. Pharmacol. 96:85–92; 1988. [DOI] [PubMed] [Google Scholar]
- 7. Haley R. W. Excess incidence of ALS in young Gulf War veterans. Neurology 61:750–756; 2003. [DOI] [PubMed] [Google Scholar]
- 8. Hasegawa E.; Takeshige K.; Oishi T. MPP+ induces NADH-dependent superoxide formation and enhances NADH-dependent lipid peroxidation in bovine heart submitochondrial particles. Biochem. Biophys. Res. Commun. 170:1049–1055; 1990. [DOI] [PubMed] [Google Scholar]
- 9. Hayes A. W. Action of rubratoxin B on mouse liver mitochondria. Toxicology 6:253–561; 1976. [DOI] [PubMed] [Google Scholar]
- 10. Hood R. D.; Innes J. E.; Hayes A. W. Effects of ru-bratoxin B on prenatal development in mice. Bull. Environ. Contam. Toxicol. 10:200–207; 1973. [DOI] [PubMed] [Google Scholar]
- 11. Hood R. D. Effects of concurrent prenatal exposure to rubratoxin B and T-2 toxin in the mouse. Drug Chem. Toxicol. 9:185–190; 1986. [DOI] [PubMed] [Google Scholar]
- 12. Koshakji R. P.; Wilson B. J.; Harbison R. D. Effect of rubratoxin B on prenatal growth and development in mice. Res. Commun. Chem. Pathol. Pharmacol. 5: 584–592; 1973. [PubMed] [Google Scholar]
- 13. Krokan H. E.; Standal R.; Slupphaug G. DNA glyco-sylases in the base excision repair of DNA. Biochem. J. 325:1–16; 1997. [DOI] [PMC free article] [PubMed] [Google Scholar]
- 14. Nagashima H.; Goto T. Rubratoxin B induces apopto-sis in HL-60 cells in the presence of internucleosomal fragmentation. Mycotoxins 46:17–22; 1998. [Google Scholar]
- 15. Nagashima H.; Ishizaki Y.; Nishida M.; Morita I.; Murota S.; Goto T. Rubratoxin B induces apoptosis in p53-null cells. Mycotoxins 46:35–37; 1998. [Google Scholar]
- 16. Nagashima H.; Nishida M.; Ishizaki Y.; Morita I.; Murota S.; Goto T. Cytological effects of rubratoxin B: Morphological change and gap junctional intercellular communication. In: Funatsu K.; Shirai Y.; Matsushita T., eds. Animal cell technology: Basis & applied aspects, vol. 8 Dordrecht: Kluwer Academic Publishers; 1997:571–575. [Google Scholar]
- 17. Natori S.; Sakaki S.; Kurata H.; Udagawa S. I.; Ichinoe M. Production of rubratoxin B by Penicillium purpurogenum Stoll. Appl. Microbiol. 19:613–617; 1970. [DOI] [PMC free article] [PubMed] [Google Scholar]
- 18. Phillips T. D.; Hayes A. W.; Ho I. K.; Desaiah D. Effects of rubratoxin B on the kinetics of cationic and substrate activation of (Na+-K+)-ATPase and p-nitro-phenyl phosphatase. J. Biol. Chem. 253:3487–3493; 1978. [PubMed] [Google Scholar]
- 19. Siraj M. Y.; Hayes A. W. Inhibition of the hepatic cytochrome P-450-dependent monooxygenase system by rubratoxin B in male mice. Toxicol. Appl. Pharmacol. 48:351–359; 1979. [DOI] [PubMed] [Google Scholar]
- 20. Smith P. K.; Krohn R. I.; Hermanson G. T.; Mallia A. K.; Gartner F. H.; Provenzano M. D.; Fujimoto E. K.; Goeke N. M.; Olson B. J.; Klenk D. C. Measurement of protein using bicinchoninic acid. Anal. Biochem. 150:76–85; 1985. [DOI] [PubMed] [Google Scholar]
- 21. Watson S. A.; Hayes A. W. Evaluation of possible sites of action of rubratoxin B-induced polyribosomal disaggregation in mouse liver. J. Toxicol. Environ. Health 2(3):639–650; 1997. [DOI] [PubMed] [Google Scholar]
- 22. Wei Y. H.; Lu C. Y.; Lin T. N.; Wei R. D. Effect of ochratoxin A on rat liver mitochondrial respiration and oxidative phosphorylation. Toxicology 36:119–130; 1985. [DOI] [PubMed] [Google Scholar]
- 23. Zilinskas R. A. Iraq’s biological weapons. The past as future?. JAMA 278:418–424; 1997. [PubMed] [Google Scholar]