

Abstract
Obesity is a global public health problem, with about 315 million people worldwide estimated to fall into the WHO-defined obesity categories. Traditional herbal medicines may have some potential in managing obesity. Botanical dietary supplements often contain complex mixtures of phytochemicals that have additive or synergistic interactions. The dried fruit rind of Garcinia cambogia, also known as Malabar tamarind, is a unique source of (−)-hydroxycitric acid (HCA), which exhibits a distinct sour taste and has been safely used for centuries in Southeastern Asia to make meals more filling. Recently it has been demonstrated that HCA-SX or Super Citrimax, a novel derivative of HCA, is safe when taken orally and that HCA-SX is bioavailable in the human plasma as studied by GC-MS. Although HCA-SX has been observed to be conditionally effective in weight management in experimental animals as well as in humans, its mechanism of action remains to be understood. We sought to determine the effects of low-dose oral HCA-SX on the body weight and abdominal fat gene expression profile of Sprague-Dawley rats. We observed that at doses relevant for human consumption dietary HCA-SX significantly contained body weight growth. This response was associated with lowered abdominal fat leptin expression while plasma leptin levels remained unaffected. Repeated high-density microarray analysis of 9960 genes and ESTs present in the fat tissue identified a small set (∼1% of all genes screened) of specific genes sensitive to dietary HCA-SX. Other genes, including vital genes transcribing for mitochondrial/nuclear proteins and which are necessary for fundamental support of the tissue, were not affected by HCA-SX. Under the current experimental conditions, HCA-SX proved to be effective in restricting body weight gain in adult rats. Functional characterization of HCA-SX-sensitive genes revealed that upregulation of genes encoding serotonin receptors represent a distinct effect of dietary HCA-SX supplementation.
Key words: Herbal, Obesity, Leptin, Rat, Serotonin
OBESITY is a global public health problem, with about 315 million people worldwide estimated to fall into the WHO-defined obesity categories with a body mass index of 30 or above (3). In the United States, in 1999, 27% of adults had a body mass index >30 kg m−2, almost double the prevalence of 20 years earlier. The estimated mortality from obesity-related diseases in the United States is approximately 300,000 annually and growing. In the future, mortality related to obesity is expected to exceed that of smoking (25). The quality of life of the obese is markedly reduced, and the costs to health care systems are great. In spite of the rising numbers of people who are overweight and obese, medical treatment of obesity is currently where medical treatment of hypertension was in the 1950s, with only two Food and Drug Administration-approved medications for chronic weight loss and maintenance, sibutramine and orlistat (39). Over the past decade, there has been a tremendous increase in the understanding of the molecular and neural mechanisms that control food intake and body weight. Yet obesity cases are rising at alarming rates (50).
Botanical dietary supplements often contain complex mixtures of phytochemicals that have additive or synergistic interactions. For example, the tea catechins include a group of related compounds with effects that are demonstrable beyond those that are seen with epigallocatechin gallate, the most potent catechin. Traditional herbal medicines may have some potential in managing obesity. Several ethnobotanical studies found herbal treatments for diabetes, and similar surveys, termed bio-prospecting, for obesity treatments may be productive (9). Beyond increasing thermogenesis, there are other biological rationales for the actions of several different alternative medical and herbal approaches to weight loss. For example, several supplements and herbs claim to result in nutrient partitioning so that ingested calories will be directed to muscle, rather than fat. These include an herb (Garcinia cambogia) and a lipid, which is the product of bacterial metabolism (conjugated linoleic acid). Moreover, a series of approaches attempted to physically affect gastric satiety by filling the stomach. Fiber swells after ingestion and has been found to result in increased satiety (9).
Although the market is replete with natural products aimed at weight management, scientific evidence examining such products is scanty at best. Although Americans spend $30 billion per year on weight loss aids, the adequacy of our regulatory and monitoring capability as a society is a matter of serious concern (9,46). When the significance of scientific evidence is dwarfed by money or politics, the net result is exposure of the general public to unsafe dietary supplements (48). A classical example of such case is ephedra, a popular natural weight loss ingredient known to be associated with life-threatening side effects (1, 22,44,48). Recently, the FDA has issued a consumer alert indicating plans to prohibit the sale of ephedra-containing dietary supplements in the US (http://www.fda.gov/oc/initiatives/ephedra/december2003/advisory.html). Scientific investigations of herbal and alternative therapies represent a potentially important source for new discoveries in obesity treatment and prevention (9). Herbal products for weight reduction in motivated patients may be effective to treat clinically significant obesity. The consistency, safety, and efficacy of a bioavailable active herbal product remain important factors in the consideration of such therapy (45).
The dried fruit rind of Garcinia cambogia (family Gut-tiferae), also known as Malabar tamarind, is a unique source of (–)-hydroxycitric acid (HCA), which exhibits a distinct sour taste and has been used for centuries in Southeastern Asia to make meals more filling (41). Recently it has been demonstrated that HCA is safe when taken orally (42,43) and that HCA-SX is bioavailable in the human plasma as studied by GC-MS (18). Although HCA-SX has been observed to be conditionally effective in weight management in experimental animals (43) as well as in humans (20,32,47), its mechanism of action remains to be understood. We sought to determine the effects of low-dose oral HCA-SX on the body weight and abdominal fat gene expression profile of Sprague-Dawley rats.
MATERIAL AND METHODS
HCA-SX
A natural, highly water-soluble, calcium-potassium salt of 60% HCA extract from Garcinia cambogia and commercially known as Super Citrimax HCA-600-SXS (HCA-SX) was obtained from InterHealth Nutraceuticals (Benicia, CA) (26,27,32,42,43). HCA-SX samples were stored in a dry, cool place at room temperature (18–25°C). HCA-SX contains 60% (–)-hydroxycitric acid in its free form, 1.0% (–)-hydro-xycitric acid in its lactone form, 10% calcium, 15% potassium, 0.5% sodium, 0.05% total phytosterols, 0.3% total protein, 4.5% moisture, and 8.5% soluble dietary fiber (by difference). HCA-SX also contains 0.1% magnesium, 0.03% iron, and trace amounts of manganese, copper, zinc, selenium, total fat, and total sugar. HCA-SX provides approximately 150 calories per 100 g (42).
Animals and Supplementation Protocol
Rats (8 weeks old; Sprague-Dawley; Harlan, Indianapolis, IN) were randomly divided into the following two groups. i) The HCA-SX group was fed a standard rat chow (Harlan) and had free access to water ad libitum. Additionally, this group was supplemented for 8 weeks with a daily (5 day/week) gavage of 10 mg/kg body weight of HCA-SX dissolved in water. ii) The control group was fed a standard rat chow (Harlan) and had free access to water ad libitum. Additionally, this group was supplemented for 8 weeks with a matching volume of water. All rats were maintained under standard conditions at 22 ± 2°C with 12:12-h dark/light cycles. All animal protocols were approved by the Institutional Lab Animal Care and Use Committee (ILACUC) of the Ohio State University, Columbus, OH. The weight of each rat was recorded every week. At the end of eighth week of supplementation, rats were killed and plasma samples were collected for leptin ELISA assay and abdominal fat was collected for gene expression studies. Samples were snap frozen in liquid nitrogen and stored in –80oC.
Affymetrix GeneChip Probe Array Analysis
Total RNA was extracted by pulverizing the abdominal fat in liquid N2 followed by extraction using Trizol (Gibco BRL) (13,35,36). Further cleanup of RNA was performed using the RNeasy kit (Qiagen). The quality of RNA was checked using an Agilent 2100 bioanalyzer. Targets for microarray hybridization were prepared according to previously described protocols (35). The samples were hybridized for 16 h at 45°C to GeneChip Test-2 arrays to assess sample quality. Once sample quality was verified to be acceptable, the targets were hybridized to Rat Genome arrays (U230A) in conditions listed above for Test-2 arrays. The arrays were washed, stained with streptavidin-phycoerythrin and then were scanned with the GeneArray scanner. All procedures related to micro-array analysis were conducted in our own laboratory and facilities.
Data Analysis
Raw data were collected and analyzed using the Affymetrix Microarray Suite 5.0 (MAS) and Data Mining Tool 2.0 (DMT) software as described previously (36). Additional processing of data was performed using the dChip software (14). A detailed analysis scheme has been illustrated in Figure 3. Statistical (t-test) and comparison analyses were the two approaches utilized to identify differentially expressed genes (36). The t-test was performed using DMT on absolute files generated from MAS. Genes that significantly (p < 0.05) changed (increased or decreased) in the HCA-SX group compared with the control group were selected. Next, the dChip (v 1.3, Harvard University) software was used to further filter genes using the following criteria: i) fold change >0.5; ii) t-test, p < 0.05; and iii) present call in all experimental (HCA-SX) samples for upregulated genes, and present call in all baseline (control) samples for downregulated genes. Using comparison analysis in MAS, nine pairwise comparisons were generated from replicates of both control and HCA-SX groups. Average fold-changes were calculated for both up- and down-regulated genes.
Figure 3.
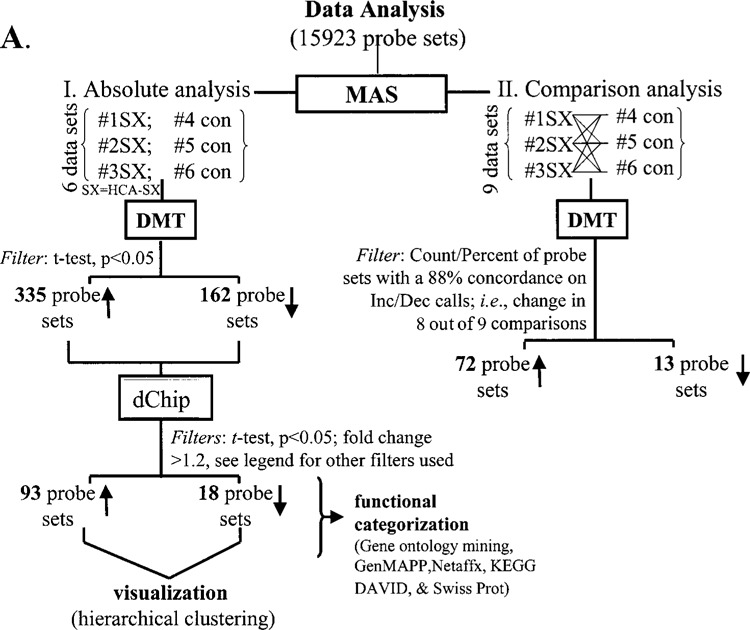
GeneChip™ data analysis scheme. The illustrated approach was used to identify differentially expressed genes in animals supplemented or not with HCA-SX as described in the legend of Figure 1. Data processing was primarily performed using Microarray Suite v 5.0 (MAS) and Data Mining Tool v 2.0 (DMT) software. Additional data filtration was performed using dChip with following criteria: I) fold change >1.2; II) t-test, p < 0.05; and III) present call in all HCA-SX supplemented animals for upregulated genes, vice versa present call in all baseline control animals for downregulated genes. Details of software and other resources for data analysis have been provided in Materials and Methods. ↑, increase and ↓, decrease in response to HCA-SX supplementation.
Importantly, genes with 88% (8 out of 9 pairs) concordance in pairwise comparisons were selected. For data visualization, genes filtered using the statistical (t -test) approach were subjected to hierarchical clustering using dChip (v 1.3) software. Functional categorization and pathway construction were performed using the following software/Web resources: Gene Ontology Data Mining Tool (Affymetrix), KEGG (Kyoto Encyclopedia of Genes and Genomes), Gen-MAPP (5), DAVID (Database for Annotation, Visualization, and Integrated Discovery Verification) and LocusLink (Swiss-Prot) as described previously (36). Select microarray data were verified using quantitative real-time PCR assay.
Real-Time Reverse-Transcription and Polymerase Chain Reaction (RT-PCR)
Expression levels of leptin, glut-1, glut-4, and GAPDH mRNA were independently determined using real-time RT-PCR as described previously (36). In brief, total RNA (5 μg) was reverse transcribed into cDNA using oligo-dT primer and Superscript II. RT-generated DNA was quantified by real-time PCR assay using double-stranded DNA binding dye SYBER Green-I as described previously (36). The primer sets used for individual genes are listed in Table 1.
TABLE 1.
PRIMERS USED FOR REAL-TIME PCR
| mRNA | Primer Sequence 5′ to 3′ |
|---|---|
| Leptin | GGTTCCTGTGGCTTTGGTCCTATCT |
| GTCTGGTCCATCTTGGACAAACTCA | |
| Glut-1 | CTGTCGGGCATCAATGCTGTGT |
| CCAAAGATGGCCACGATACTCAGAT | |
| Glut-4 | AAGAGAGCGTCCACTGTCCTTGCT |
| GAGACCAACGTGAAGACGGTATTGA | |
| LNC2 | GGCTGTCGCTACTGGATCAGAACA |
| ATCGGACAGCCCCTTGGTTCTT | |
| PGDS | GTTCCCGGACAGTACACCTACAACA |
| CCTGGTCCTTGCTAAAGGTGATGAA | |
| AldB | TCCGAACGCTGTGCTCAGTACA |
| TGGCAGTGCTCTAGGTCATGGTCT |
LNC2, lipocalin 2; PDGS, prostaglandin D synthase; AldB, aldolase B.
Leptin ELISA Assay
Leptin levels in plasma of rats supplemented or not with HCA-SX after 8 weeks of supplementation were determined using a commercially available ELISA kit per manufacturer’s instructions (Biodesign Inc, Saco, ME).
Statistical Analyses
The effect of HCA-SX supplementation on body weight, obesity-related mRNA, and plasma leptin levels was analyzed using the Statistical Package for Social Sciences (SPSS; Chicago, IL). The t-test was applied to compare HCA-SX supplemented or control groups. A value of p < 0.05 was considered statistically significant. Statistics related to DNA micro-array data processing are described above in the Data Analysis section.
RESULTS
Feeding of low-dose HCA-SX for 6 weeks resulted in a modest yet significant decrease in body weight of the HCA-SX-fed rats compared with the placebo-fed group. This difference in body weight held steady during the subsequent 2 weeks (Fig. 1A). During daily gavage, all experimental rats were examined for early removal criteria such as self-mutilation, guarding, vocalization, hunched posture, inactivity, lethargy, rough hair coat, lack of righting reflex, weight loss of more than 20%, lesions, bleeding, and anorexia for >24 h. None of the animals in the study exhibited such signs.
Figure 1.

Body weights and plasma leptin levels following dietary supplementation of HCA-SX. (A) Body weight (kg) of male Sprague-Dawley rats supplemented intragastric with HCA-SX (10 mg/kg body weight) once every day, 5 times a week for 8 weeks. The rats had free access to regular diet and water ad libitum. Control group was gavaged with matching volumes of water and were given regular diet and water ad libitum. Body weights of each rat were recorded every week. Data shown are mean ± SD (n = 7 in each group). *p < 0.05 compared with the control group. #p = 0.06 compared with the control group. (B) plasma leptin levels in HCA-SX-supplemented or nonsupplemented rats after 8 weeks. Plasma leptin levels were measured using ELISA. Data are mean ± SD (n = 7).
Leptin, the product of the obese gene, is thought to play an important role in regulating body weight by signaling the size of the adipose tissue mass (19). Although plasma leptin does correlate with body mass index, the levels of plasma leptin vary from one person to the other having the same body mass index. This suggests that there are differences in its secretion rate from fat (19). We have observed that plasma leptin values spanned across a large range for rats of the same group. Although the mean leptin value tended to be lower in HCA-SX-fed rats, the difference was not significant (Fig. 1B). Recently it has been demonstrated that although in states of energy balance leptin concentration is linearly related to fat mass, acute modulation of leptin concentration during energy imbalance is not mediated by fat flux (23).
Adipose tissue performs complex metabolic and endocrine functions. Among the endocrine products produced by adipose tissue are tumor necrosis factor-α, interleukin-6, acylation-stimulating protein, and leptin. Insulin and glucocorticoid function synergistically as long-term regulators of leptin expression in the adipose tissue (37). While HCA-SX feeding did not significantly influence plasma leptin concentration, leptin gene expression in the abdominal fat of HCA-SX-fed rats was significantly lower (Fig. 2). The transcriptional activity of adipocyte glucose transporters, especially glut-4, is markedly upregulated under conditions of obesity (8). HCA-SX feeding-associated reduction of body weight was not associated with any significant change in glut-1 or glut-4 gene expression in the fat tissue.
Figure 2.
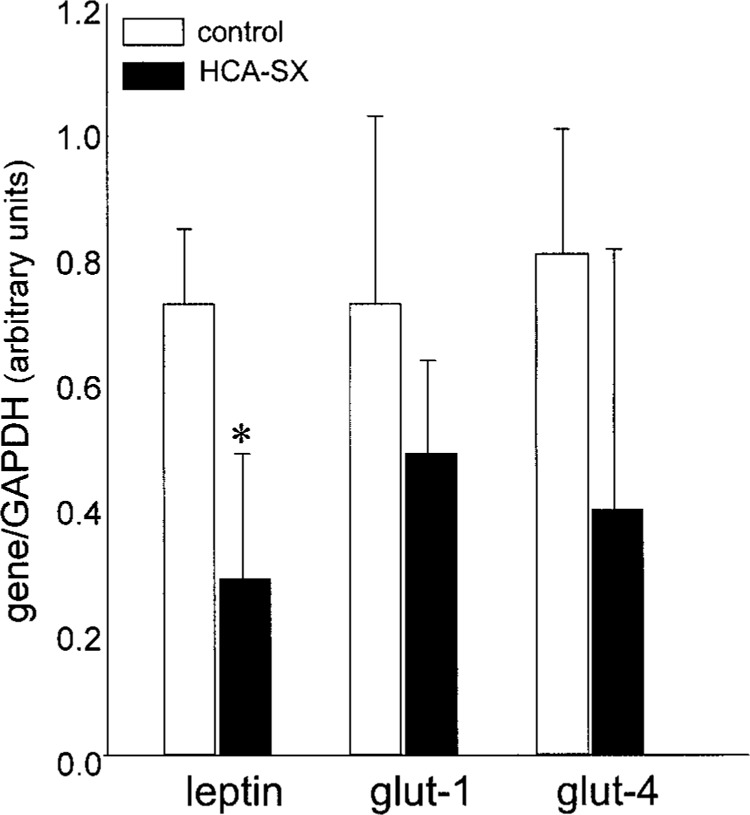
Abdominal fat gene expression of leptin, glut-1, and glut-4 following 8 weeks of dietary HCA-SX supplementation. Male Sprague-Dawley rats supplemented with HCA-SX (10 mg/ kg body weight) once every day, 5 times a week for 8 weeks (n = 7). The rats had free access to regular diet and water ad libitum. The control group was gavaged with matching volumes of water and was given regular laboratory diet and water ad libitum. At the end of 8 weeks, rats were killed and abdominal adipose tissue was collected. Real-time RT-PCR was performed from RNA isolated from abdominal fat for quantification of leptin, glut-1, and glut-4 mRNA. Data shown are mean ± SD (n = 3). *p < 005, significantly different compared with the control group.
To obtain a comprehensive understanding of the genome-wide effects of low-dose HCA-SX feeding on abdominal fat gene expression profile, we conducted a DNA microarray analysis. As indicated above, HCA-SX feeding did not cause any overt behavioral changes in the treated rats compared with placebo-fed controls. It was clear, however, that after 6 weeks of feeding, the HCA-SX group had a significantly lower body weight. Thus, we sought to compare the adipose tissue transcriptome of HCA-SX and control rats. The objective was to identify sets of dietary HCA-SX-sensitive genes that would help us understand the mechanisms implicated in HCA-SX-induced body weight control. Data were collected from three independent cases so that appropriate data treatment could be possible. The data analysis design is illustrated in Figure 3 and was modeled on the basis of our previously published study (36). Out of 15,923 probe sets screened, 9960 genes and ESTs were present in abdominal fat tissue. A total of 34.83% of all probe sets reported an absent call. Dietary HCA-SX supplementation at a dose of 10 mg per kg body weight corresponds to a 500 mg daily dose for an average person weighing 50 kg. Gavage of rats with HCA-SX or the vehicle for 8 consecutive weeks resulted in altered expression profile of a very small cluster of genes in the adipose tissue, as demonstrated in Figure 3. HCA-SX feeding resulted in a statistically significant effect that included the induction of 93 genes and downregulation of 18 genes. dChip-assisted visualization of the raw data collected from each case illustrated that the observed effect was very tight in replicates (Fig. 4).
Figure 4.

Cluster images illustrating genes sensitive to HCA-SX supplementation. Male Sprague-Dawley rats supplemented with HCA-SX (10 mg/kg body weight) once every day, 5 times a week for 8 weeks (n = 7). The rats had free access to regular diet and water ad libitum. The control group was gavaged with matching volume of water and was given regular diet and water ad libitum. At the end of 8 weeks, rats were killed and abdominal adipose tissue was collected. GeneChip microarray analysis was performed on the RNA extracted from the abdominal adipose tissue. For a clear graphic display of HCA-SX-sensitive genes, t-test was performed on data from control animals (4, 5, & 6) and from animals in the HCA-SX-supplemented groups (1, 2, & 3). Each of the six lanes represents data from one animal. The genes that significantly (p < 0.05) changed between the two groups compared were selected and subjected to hierarchial clustering using dChip software as described in Figure 3. Red to green gradation in color represents higher to lower expression signal. (A) Upregulated or (B) downregulated genes in response to HCA-SX supplementation compared with placebo group.
To validate our DNA microarray results, the expression of select HCA-SX-sensitive genes was independently determined using real-time PCR. Using this approach, we typically find that the microarray approach underestimates the magnitude of change while reliably detecting the direction of change (36). We observed a consistent trend in the current study. Three HCA-SX-sensitive genes were selected for realtime PCR verification of microarray outcome. HCA-SX supplementation upregulated prostaglandin D synthase (PDS), aldolase B (AldB), and lipocalin (LCN2) genes in abdominal fat tissue. Outcome of microarray and real-time PCR analyses were consistent (Fig. 5). To obtain an understanding of how the HCA-SX-sensitive genes are related with respect to signaling pathways, the candidate genes were mapped onto known pathways related to fat metabolism. GenMAPP, KEGG, and Gene Ontology tools were used to reconstruct the pathways. The relevant signaling pathways that were derived using this approach identified the serotonin receptors as a key target of HCA-SX supplementation (Fig. 6). The functional categories of HCA-SX-sensitive genes identified using this approach are listed in Tables 2 and 3. Importantly, HCA-SX supplementation selectively influenced only approximately 1% of all genes screened in the adipose tissue. The affected candidates did not reveal any overt pattern of stress or toxicity response. Vital genes transcribing for mitochondrial/nuclear proteins and which are necessary for fundamental support of the tissue were not affected by HCA-SX (Table 4). This observation, taken together with the observation that HCA-SX-supplemented rats presented themselves in a form comparable to that of the controls, lends further support to the contention that at the dosage used HCA-SX was safe (43).
Figure 5.

Real-time PCR validation of GeneChip microarray expression analysis. Expression levels of select HCA-SX-sensitive genes were independently determined using real-time PCR. For comparison, the GeneChip expression values were proportionately adjusted to fit to the scale with real-time PCR data. RNA samples used in GeneChip assay were utilized for the real-time PCR analysis. PDGS, prostaglandin D synthase; AldB, aldolase B; LNC2, lipocalin 2.
Figure 6.

Mapping of GeneChip expression data onto existing pathways. To obtain insights into the effects of HCA-SX supplementation, results of GeneChip analysis were mapped onto known pathways associated with energy metabolism and obesity. GenMAPP and KEGG were used as the database for existing pathways. Several of the genes that were upregulated following HCA-SX supplemented were found to overlap with the monoamine G-protein-coupled receptors (GPCR) pathway. Genes shown with arrows were upregulated in the HCA-SX-supplemented group compared with the control groups. Gi/Go, Gq/G11, and Gs pathways: GPCRs have been shown to stimulate signaling cascade through a number of linear pathways that are initiated by s, Gi/Go, Gq/11, or Gs proteins.
TABLE 2.
GENES UPREGULATED FOLLOWING HCA-SX SUPPLEMENTATION
| Gene Name | FC Average | FC SD | Function |
|---|---|---|---|
| Prostaglandin D synthase* | 19.6 | 6.9 | lipid metabolism |
| PDZ domain containing 1 | 14.3 | 2.8 | serotonin receptor signaling |
| Aldolase B* | 12.8 | 1.7 | carbohydrate metabolism |
| Tumor-associated calcium signal transducer 1* | 11.4 | 2.5 | other |
| Asialoglycoprotein receptor 1 | 10.8 | 3.4 | other |
| Preproenkephalin, related sequence | 10.5 | 2.4 | neuropeptide signaling |
| Protease, serine, 8 (prostasin) | 9.8 | 3.8 | enzyme |
| Fructose-1,6-bisphosphatase 1 | 9.2 | 0.8 | glycolysis |
| CD24 antigen* | 0.1 | 4.0 | other |
| Tektin 1 | 8.6 | 1.8 | cytoskeletal |
| Lipocalin 2 | 8.0 | 0.8 | transporter |
| Gonadotropin-regulated long chain acyl-CoA synthetase* | 7.9 | 0.8 | other |
| Low-density lipoprotein receptor-related protein 2* | 6.3 | 1.4 | lipid metabolism |
| Serum amyloid P-component* | 4.9 | 0.6 | other |
| ATPase Na+/K+ transporting beta 1 polypeptide* | 4.9 | 0.5 | transporter |
| Solute carrier family 27 (fatty acid transporter)* | 3.9 | 0.3 | lipid transporter |
| Lipopolysaccharide binding protein | 3.5 | 0.3 | lipid transporter |
| Secretin receptor | 3.3 | 0.5 | other |
| Mucin and cadherin-like* | 2.9 | 0.1 | other |
| Solute carrier family 7, member 9* | 2.7 | 0.4 | transporter |
| Rat submaxillary gland S1 kallikrein mRNA | 2.7 | 0.3 | other |
| Solute carrier family 9* | 2.6 | 0.1 | transporter |
| Tissue-type transflutaminase* | 2.5 | 0.2 | enzyme |
| Sodium channel, nonvoltage-gated 1* | 2.3 | 0.3 | ion channel |
| Glutathione S-transferase, mu 5* | 2.2 | 0.3 | xenobiotic metabolism |
| Voltabe-dependent calcium channel | 1.9 | 0.2 | ion channel |
| Cytochrome P450, subfamily 2E, polypeptide 1* | 1.8 | 0.1 | xenobiotic metabolism |
| Heat-responsive protein 12* | 1.6 | 0.1 | other |
| Kidney-specific membrane protein | 1.6 | 0.4 | other |
| ATPase, Na+K+ transporting, alpha 1* | 1.3 | 0.3 | transporter |
| Kynurenine aminotransferase 2* | 1.3 | 0.1 | enzyme |
| Solute carrier family 3, member 1 | 1.2 | 0.1 | transporter |
| ATPase Na+K+ transporting, alpha 1* | 1.0 | 0.2 | transporter |
| Ceruloplasmin | 0.9 | 0.2 | iron binding |
| Gap junction membrane channel protein alpha 4* | 0.9 | 0.1 | cell communication |
| Tissue-type transglutaminase* | 0.8 | 0.0 | enzyme |
| Peptidylprolyl isomerase C-associated protein* | 0.7 | 0.1 | receptor |
| Ceruloplasmin | 0.7 | 0.1 | iron binding |
| Transmembrane 4 superfamily member 3 | 0.6 | 0.1 | other |
| Small inducible cytokine subfamily A11 | 0.5 | 0.0 | cytokine |
| 5-Hydroxytryptamine (serotonin) receptor 2A† | 1.3 | 0.2 | serotonin receptor |
| 5-Hydroxytryptamine (serotonin) receptor 3a† | 1.3 | 0.3 | serotonin receptor |
| 5-Hydroxytryptamine (serotonin) receptor 2B† | 1.3 | 0.2 | serotonin receptor |
| 5-Hydroxytryptamine (serotonin) receptor 4† | 2.5 | 0.3 | serotonin receptor |
| 5-Hydroxytryptamine (serotonin) receptor 7† | 5.9 | 4.4 | serotonin receptor |
FC, fold change; SD, standard deviation.
Gene common in analysis I and II (see Fig. 3).
Obesity-related genes identified using Mann-Whitney test.
TABLE 3.
GENES DOWNREGULATED FOLLOWING HCA-SX SUPPLEMENTATION
| Average | SD | Function | ||
|---|---|---|---|---|
| 1371046_at | beta II spectrin-short isoform mRNA, partial cds | 0.6 | 0.2 | structural |
| 1375057_at | C151_RAT platelet endothelial tetraspan antigen 3 | 0.4 | 0.0 | cell contact |
| 1386865_at | SPARC-like 1 | 0.4 | 0.1 | structural |
| 1387769_a_at | inhibitor of DNA binding 3 | 0.3 | 0.1 | cell cycle |
| 1388924_at | ficolin 2 precurcor | 0.2 | 0.1 | sugar binding |
| 1389986_at | synaptic vesicle glycoprotein 2b | 1.6 | 0.4 | calcium binding |
| 1390706_at | nonerythrocyte beta-spectrin mRNA, partial cds | 0.2 | 0.0 | structural |
TABLE 4.
MAJOR GENES TRANSCRIBING FOR MITOCHONDRIAL/NUCLEAR PROTEINS THAT WERE NOT AFFECTED BY HCA-SX SUPPLEMENTATION
| Cytochrome oxidase subunit VIc |
| Cytochrome oxidase biogenesis protein |
| Mitochondrial aconitase |
| Pyruvate dehydrogenase phosphatase isoenzyme 1 |
| Glucose-6-phosphate dehydrogenase |
| Nuclear receptor subfamily 1, group H, member 4 |
| Histone H3.3 |
| Histone |
DISCUSSION
A large number of herbal dietary supplements available in the marketplace to address weight management lack scientific data related to safety, efficacy, and underlying mechanisms. Although it remains to be proven in large-scale clinical trials that herbal supplements represent a safe and efficient tool against obesity, public interest in these solutions is substantial. The fact that obesity is under strong genetic control has been well established (16). Thus, investigating the genetic basis of the effects of herbal supplements on weight management represents a powerful tool to identify underlying mechanisms as well as to determine possible health safety-related issues associated with the consumption of the specific supplement. DNA microarray is specifically suited to address genome-wide changes in gene expression profile in response to any given therapeutic regimen (17). This study represents the first effort to investigate the effects of a widely consumed herbal supplement, HCA-SX, on body weight and gene expression profile in abdominal fat tissue. Abdominal fat status is known to be responsible for some of the key adverse health implications of obesity (24).
The current work presents two striking findings. First, that oral low-dose HCA-SX is effective in controlling weight gain in adult rats. Second, that HCA-SX supplementation affected only 1% of all genes screened in the adipose tissue. These observations support that HCA-SX taken orally at modest doses does contain body weight gain by affecting a specific set of genes. Of the three genes randomly selected to verify the versatility of the microarray analysis, prostaglandin (PG) D synthase (PGDS) catalyzes the isomerization of PGH2 to PGD2 in the presence of sulfhydryl compounds. PGDS is present in adipocytes (12). Two distinct types of PGDS have been identified: one is the lipocalin-type PGDS (L-PGDS), and the other is the hematopoietic PGDS (H-PGDS). PGD2 is a major PG produced in the central nervous system and is involved in the regulation of sleep and pain responses. It is also actively produced by mast cells, basophils, and Th2 cells, acting as an allergic mediator. PGD2 is further dehydrated to produce PGJ2, delta12-PGJ2, and 15-deoxy-delta(12,14)-PGJ2, the last being a ligand for the nuclear receptor peroxisome proliferator-activated receptor (PPAR)-γ. PPAR signaling is known to cause metabolic changes ultimately leading to obesity (40).
In the past 20 years or so, the complementary disciplines of bioinformatics and protein crystallography have identified a family of ligand binding proteins that seem to display a similarity of function and a similarity of both primary and tertiary structure. Pervais and Brew have suggested the collective name “lipocalin” (derived from the greek words “lipos,” meaning fat, and “calyx,” meaning cup) for this family (28–31). Members of the lipocalin family are characterized by several common molecular-recognition properties: the ability to bind a range of small hydro-phobic molecules, binding to specific cell-surface receptors, and the formation of complexes with soluble macromolecules. One or more of these properties mediates the varied biological functions of the lipocalins. In the past, the lipocalins have been classified as transport proteins; however, it is now clear that the lipocalins exhibit great functional diversity, with roles in retinol transport, invertebrate cryptic coloration, olfaction and pheromone transport, and prosta-glandin synthesis. The lipocalins have also been implicated in the regulation of cell homeostasis and the modulation of the immune response, and, as carrier proteins, to act in the general clearance of endogenous and exogenous compounds. Lipocalin 2 is induced in response to adipocyte differentiation (11). Conventional treatment of obesity reduces fat in mature adipocytes but leaves them with lipogenic enzymes capable of rapid resynthesis of fat, a likely factor in treatment failure (49). Commitment to terminal differentiation resists inducible adipocyte proliferation (15). Hormones regulate gene expression of aldolase B, an important enzyme for glucose and fructose metabolism. Insulin, dexamethasone, and high concentration of glucose increased aldolase B mRNA abundance while glucagon strongly suppressed aldolase B gene expression (10). Glucagon is known to reduce the risk for obesity (21) and, indeed, tissue from obese rats exhibits lower aldolase activity (4). Tissue AldB activity is known to be sensitive to dietary alterations. For example, fasting decreases AldB expression while refeeding elevates it. Higher levels of AldB expression in HCA-SX-supplemented rats indicate that this group was not fasting.
Drugs to treat obesity can be divided into three groups: those that reduce food intake; those that alter metabolism; and those that increase thermogenesis. Monoamines acting on noradrenergic receptors, serotonin receptors, dopamine receptors, and histamine receptors can reduce food intake (2). On the basis of the serotonin hypothesis of appetite control, serotonin signaling is expected to reduce appetite and, consequently, body weight. Indeed, direct stimulation of serotonin receptors constitutes an approach for obesity management (6). To obtain insights into the effects of HCA-SX supplementation on specific known pathways of adipose tissue metabolism, results of GeneChip analysis were mapped onto known pathways associated with energy metabolism and obesity. GenMAPP and KEGG were used as the database for existing pathways. Several of the genes that were up-regulated following HCA-SX supplementation were found overlapping with the monoamine G-protein-coupled receptors pathway. Specifically, serotonin receptor expression was consistently upregulated in response to HCA-SX supplementation. This observation is consistent with previous findings supporting a serotonergic role of HCA-SX. HCA-SX has been shown to promote serotonin release from isolated rat brain cortex (26).
There is considerable evidence that cortisol secretion is associated with obesity. The regulation of the 5-hydroxytryptamine receptor 2A (5-HT2A) gene plays an essential role in body weight management because it is involved in the control of cortisol secretion. Polymorphism of the 5-HT2A gene causes abdominal obesity in humans (33,34). Stimulation of serotonergic receptors reduces feeding and perhaps enhances the satiating effect of food (38). While selective serotonin receptor agonists may serve as anorectic drugs and prove useful in the treatment of obesity, potential side effects remain a concern. For example, the receptor agonist mCPP has been reported to induce anxiety and nausea in humans, actions that would clearly limit its therapeutic utility (7). Thus, identification of safe dietary means to upregulate serotonin receptor function represents an important development in body weight management. In summary, we observed that at doses relevant for human consumption dietary HCA-SX significantly contained increase in body weight. This response was associated with lowered abdominal fat leptin expression while plasma leptin levels remained unaffected. Repeated high-density microarray analysis of 9960 genes and ESTs present in the fat tissue identified a small set (—1% of all genes screened) of specific genes sensitive to dietary HCA-SX. Other genes, including vital genes transcribing for mitochondrial/ nuclear proteins and which are necessary for fundamental support of the tissue, were not affected by HCA-SX. Under the current experimental conditions, HCA-SX proved to be effective in restricting body weight gain in adult rats. Functional characterization of HCA-SX-sensitive genes revealed that upregulation of genes encoding serotonin receptors represent a distinct effect of dietary HCA-SX supplementation. Unbiased screening of a large number of genes in the current work lends support to the previously reported observation that the serotonergic pathway is a target of dietary HCA-SX supplementation (27).
ACKNOWLEDGMENT
We thank Mr. David Luedeke for technical assistance.
REFERENCES
- 1. Anonymous. Working to get ephedra banned. Consumer Reports 68:6; 2003. [PubMed] [Google Scholar]
- 2. Bray G. A. A concise review on the therapeutics of obesity. Nutrition 16:953–960; 2000. [DOI] [PubMed] [Google Scholar]
- 3. Caterson I. D.; Gill T. P. Obesity: Epidemiology and possible prevention. Best Pract. Res. Clin. Endocrinol. Metab. 16:595–610; 2002. [DOI] [PubMed] [Google Scholar]
- 4. Chanussot F.; Ulmer M.; Ratanasavanh R.; Max J. P.; Debry G. Influence of diet composition on obesity, hyperlipemia and liver steatosis in Zucker fa/fa rats pair-fed with Zucker Fa/–rats. Int. J. Obes. 8:259–270; 1984. [PubMed] [Google Scholar]
- 5. Dahlquist K. D.; Salomonis N.; Vranizan K.; Lawlor S. C.; Conklin B. R. GenMAPP, a new tool for viewing and analyzing microarray data on biological pathways. Nat. Genet. 31:19–20; 2002. [DOI] [PubMed] [Google Scholar]
- 6. Davis R.; Faulds D. Dexfenfluramine. An updated review of its therapeutic use in the management of obesity. Drugs 52:696–724; 1996. [DOI] [PubMed] [Google Scholar]
- 7. Dourish C. T. Multiple serotonin receptors: Opportunities for new treatments for obesity? Obes. Res. 3(Suppl. 4):449S–462S; 1995. [DOI] [PubMed] [Google Scholar]
- 8. Hainault I.; Hajduch E.; Lavau M. Fatty genotype-induced increase in GLUT4 promoter activity in transfected adipocytes: Delineation of two fa-responsive regions and glucose effect. Biochem. Biophys. Res. Commun. 209:1053–1061; 1995. [DOI] [PubMed] [Google Scholar]
- 9. Heber D. Herbal preparations for obesity: Are they useful? Prim. Care 30:441–463; 2003. [DOI] [PubMed] [Google Scholar]
- 10. Ito J.; Kuzumaki T.; Otsu K.; Iuchi Y.; Ishikawa K. Hormonal regulation of aldolase B gene expression in rat primary cultured hepatocytes. Arch. Biochem. Biophys. 350:291–297; 1998. [DOI] [PubMed] [Google Scholar]
- 11. Jessen B. A.; Stevens G. J. Expression profiling during adipocyte differentiation of 3T3-L1 fibroblasts. Gene 299:95–100; 2002. [DOI] [PubMed] [Google Scholar]
- 12. Jowsey I. R.; Murdock P. R.; Moore G. B.; Murphy G. J.; Smith S. A.; Hayes J. D. Prostaglandin D2 synthase enzymes and PPARgamma are co-expressed in mouse 3T3-L1 adipocytes and human tissues. Prostaglandins Other Lipid Mediat. 70:267–284; 2003. [DOI] [PubMed] [Google Scholar]
- 13. Khanna S.; Roy S.; Bagchi D.; Bagchi M.; Sen C. K. Upregulation of oxidant-induced VEGF expression in cultured keratinocytes by a grape seed proanthocyanidin extract. Free Radic. Biol. Med. 31:38–42; 2001. [DOI] [PubMed] [Google Scholar]
- 14. Li C.; Wong W. H. Model-based analysis of oligonucleotide arrays: Expression index computation and outlier detection. Proc. Natl. Acad. Sci. USA 98:31–36; 2001. [DOI] [PMC free article] [PubMed] [Google Scholar]
- 15. Liu K.; Guan Y.; MacNicol M. C.; MacNicol A. M.; McGehee R. E. Jr. Early expression of p107 is associated with 3T3-L1 adipocyte differentiation. Mol. Cell. Endocrinol. 194:51–61; 2002. [DOI] [PubMed] [Google Scholar]
- 16. Liu Y. J.; Araujo S.; Recker R. R.; Deng H. W. Molecular and genetic mechanisms of obesity: Implications for future management. Curr. Mol. Med. 3:325–340; 2003. [DOI] [PubMed] [Google Scholar]
- 17. Liu-Stratton Y. J.; Roy S.; Sen C. K. DNA micro-array technology in nutraceutical and food safety. Toxicology (in press). [DOI] [PubMed] [Google Scholar]
- 18. Loe Y. C.; Bergeron N.; Rodriguez N.; Schwarz J. M. Gas chromatography/mass spectrometry method to quantify blood hydroxycitrate concentration. Anal. Biochem. 292:148–154; 2001. [DOI] [PubMed] [Google Scholar]
- 19. Maffei M.; Halaas J.; Ravussin E.; Pratley R. E.; Lee G. H.; Zhang Y.; Fei H.; Kim S.; Lallone R.; Ranganathan S. Leptin levels in human and rodent: Measurement of plasma leptin and ob RNA in obese and weight-reduced subjects. Nat. Med. 1:1155–1161; 1995. [DOI] [PubMed] [Google Scholar]
- 20. Mattes R. D.; Bormann L. Effects of (–)-hydroxycitric acid on appetitive variables. Physiol. Behav. 71:87–94; 2000. [DOI] [PubMed] [Google Scholar]
- 21. McCarty M. F. Vegan proteins may reduce risk of cancer, obesity, and cardiovascular disease by promoting increased glucagon activity. Med. Hypotheses 53: 459–485; 1999. [DOI] [PubMed] [Google Scholar]
- 22. Meadows M. Public health officials caution against ephedra use. Health officials caution consumers against using dietary supplements containing ephedra. The stimulant can have dangerous effects on the nervous system and heart. FDA Consumer 37:8–9; 2003. [PubMed] [Google Scholar]
- 23. Murgatroyd P. R.; Fruhbeck G.; Goldberg G. R.; Jebb S. A.; Leahy F. E.; Moore M. S.; Prentice A. M. Leptin does not respond to 48 h fat deposition or mobilization in women. Int. J. Obes. Relat. Metab. Disord. 27:457–462; 2003. [DOI] [PubMed] [Google Scholar]
- 24. Nieves D. J.; Cnop M.; Retzlaff B.; Walden C. E.; Brunzell J. D.; Knopp R. H.; Kahn S. E. The atherogenic lipoprotein profile associated with obesity and insulin resistance is largely attributable to intra-abdominal fat. Diabetes 52:172–179; 2003. [DOI] [PubMed] [Google Scholar]
- 25. O’Brien P. E.; Dixon J. B. The extent of the problem of obesity. Am. J. Surg. 184:4S–8S; 2002. [DOI] [PubMed] [Google Scholar]
- 26. Ohia S. E.; Awe S. O.; LeDay A. M.; Opere C. A.; Bagchi D. Effect of hydroxycitric acid on serotonin release from isolated rat brain cortex. Res. Commun. Mol. Pathol. Pharmacol. 109:210–216; 2001. [PubMed] [Google Scholar]
- 27. Ohia S. E.; Opere C. A.; LeDay A. M.; Bagchi M.; Bagchi D.; Stohs S. J. Safety and mechanism of appetite suppression by a novel hydroxycitric acid extract (HCA-SX). Mol. Cell. Biochem. 238:89–103; 2002. [DOI] [PubMed] [Google Scholar]
- 28. Pervaiz S.; Brew K. Homology of beta-lactoglobulin, serum retinol-binding protein, and protein HC. Science 228:335–337; 1985. [DOI] [PubMed] [Google Scholar]
- 29. Pervaiz S.; Brew K. Composition of the milks of the bottlenose dolphin (Tursiops trucatus) and the Florida manatee (Trichechus manatus latirostris). Comp. Biochem. Physiol. A Comp. Physiol. 84:357–360; 1986. [DOI] [PubMed] [Google Scholar]
- 30. Pervaiz S.; Brew K. Purification and characterization of the major whey proteins from the milks of the bottlenose dolphin (Tursiops truncates), the Florida manatee (Trichechus manatus latirostris), and the beagle (Canis familiaris). Arch. Biochem. Biophys. 246:846–854; 1986. [DOI] [PubMed] [Google Scholar]
- 31. Pervaiz S.; Brew K. Homology and structure–function correlations between alpha 1-acid glycoprotein and serum retinol-binding protein and its relatives. FASEB J. 1:209–214; 1987. [DOI] [PubMed] [Google Scholar]
- 32. Preuss H. G.; Bagchi D.; Bagchi M.; Sanyasi Rao C. V.; Stayanarayana S.; Dey D. K. Efficacy of a novel , natural extract of (-)-hydroxycitric acid (HCA-SX) and a combination of HCA-SX, niacin-bound chromium and Gymnema sylvestre extract in weight management in human volunteers. Nutr. Res. (in press). [DOI] [PubMed] [Google Scholar]
- 33. Rosmond R.; Bouchard C.; Bjorntorp P. 5-HT2A receptor gene promoter polymorphism in relation to abdominal obesity and cortisol. Obes. Res. 10:585–589; 2002. [DOI] [PubMed] [Google Scholar]
- 34. Rosmond R.; Bouchard C.; Bjorntorp P. Increased abdominal obesity in subjects with a mutation in the 5-HT(2A) receptor gene promoter. Ann. NY Acad. Sci. 967:571–575; 2002. [DOI] [PubMed] [Google Scholar]
- 35. Roy S.; Khanna S.; Bentley K.; Beffrey P.; Sen C. K. Functional genomics: High-density oligonucleotide arrays. Methods Enzymol. 353:487–497; 2002. [DOI] [PubMed] [Google Scholar]
- 36. Roy S.; Khannam S.; Wallace W. A.; Lappalainen J.; Rink C.; Cardounel A. J.; Zweier J. L., Sen C. K. Characterization of perceived hyperoxia in isolated primary cardiac fibroblasts and in the reoxygenated heart. J. Biol. Chem. 278:47129–47135; 2003. [DOI] [PubMed] [Google Scholar]
- 37. Russell C. D.; Petersen R. N.; Rao S. P.; Ricci M. R.; Prasad A.; Zhang Y.; Brolin R. E.; Fried S. K. Leptin expression in adipose tissue from obese humans: Depot-specific regulation by insulin and dexamethasone. Am. J. Physiol. 275:E507–515; 1998. [DOI] [PubMed] [Google Scholar]
- 38. Samanin R.; Garattini S. Pharmacology of ingestive behaviour. Therapie 51:107–115; 1996. [PubMed] [Google Scholar]
- 39. Schurgin S.; Siegel R. D. Pharmacotherapy of obesity: An update. Nutr. Clin. Care 6:27–37; 2003. [PubMed] [Google Scholar]
- 40. Seedorf U.; Assmann G. The role of PPAR alpha in obesity. Nutr. Metab. Cardiovas. Dis. 11:189–194; 2001. [PubMed] [Google Scholar]
- 41. Sergio W. A natural food, the Malabar Tamarind, may be effective in the treatment of obesity. Med. Hypotheses 27:39–40; 1988. [DOI] [PubMed] [Google Scholar]
- 42. Shara M.; Ohia S. E.; Schmidt R. E.; Yasmin T.; Zardetto-Smith A.; Kincaid A.; Bagchi M.; Chatterjee A.; Bagchi D.; Stohs S. J. Physico-chemical properties of a novel (–)-hydroxycitric acid extract and its effect on body weight, selected organ weights, hepatic lipid peroxidation and DNA fragmentation, hematology and clinical chemistry, and histopathological changes over a period of 90 days. Mol. Cell. Biochem. (in press). [DOI] [PubMed] [Google Scholar]
- 43. Shara M.; Ohia S. E.; Yasmin T.; Zardetto-Smith A.; Kincaid A.; Bagchi M.; Chatterjee A.; Bagchi D.; Stohs S. J. Dose- and time-dependent effects of a novel (–)-hydroxycitric acid extract on body weight, hepatic and testicular lipid peroxidation, DNA fragmentation and histopathological data over a period of 90 days. Mol. Cell. Biochem. 254:339–346; 2003. [DOI] [PubMed] [Google Scholar]
- 44. Shekelle P. G.; Hardy M. L.; Morton S. C.; Maglione M.; Mojica W. A.; Suttorp M. J.; Rhodes S. L.; Jungvig L.; Gagne J. Efficacy and safety of ephedra and ephedrine for weight loss and athletic performance: A meta-analysis. JAMA 289:1537–1545; 2003. [DOI] [PubMed] [Google Scholar]
- 45. Sindler B. H. Herbal therapy for management of obesity: Observations from a clinical endocrinology practice. Endocr. Pract. 7:443–447; 2001. [DOI] [PubMed] [Google Scholar]
- 46. Spake A. Natural hazards. Tonic or toxic? Americans are gobbling up nature’s remedies for everything from obesity to depression. US News World Rep. 130:42–49; 2001. [PubMed] [Google Scholar]
- 47. Westerterp-Plantenga M. S.; Kovacs E. M. The effect of (-)-hydroxycitrate on energy intake and satiety in overweight humans. Int. J. Obes. Relat. Metab. Disord. 26:870–872; 2002. [DOI] [PubMed] [Google Scholar]
- 48. Wolfe S. M. Medicine. Ephedra—scientific evidence versus money/politics. Science 300:437; 2003. [Erratum appears in Science 21;300(5621):905; 2003] [DOI] [PubMed] [Google Scholar]
- 49. Zhou Y. T.; Wang Z. W.; Higa M.; Newgard C. B.; Unger R. H. Reversing adipocyte differentiation: Implications for treatment of obesity. Proc. Natl. Acad. Sci. USA 96:2391–2395; 1999. [DOI] [PMC free article] [PubMed] [Google Scholar]
- 50. Zigman J. M.; Elmquist J. K. Minireview: From anorexia to obesity—the yin and yang of body weight control. Endocrinology 144:3749–3756; 2003. [DOI] [PubMed] [Google Scholar]