

Abstract
Study Design.
A prospective cohort study.
Objective.
The aim of the present study was first to compare monthly measurements of low back pain (LBP) with quarterly and yearly retrospective measurements of LBP, and second to investigate possible bias effects for recall bias of LBP.
Summary of Background Data.
LBP is a subjective experience often measured by a single rating of recalled pain over a certain time interval. However, retrospectively reported pain may be subject to recall bias.
Methods.
The agreement between monthly measurements of LBP and quarterly and yearly retrospective measurements of LBP was evaluated by Spearman rank order correlation coefficients, intraclass correlation coefficients, and Bland-Altman plots. Bias effects for recall bias were investigated by a linear regression model.
Results.
There were no statistical significant differences in mean values of monthly measurements of LBP compared with quarterly and yearly retrospective measurements of LBP on a group level. However, the Bland-Altman plots revealed that within individuals, the difference between monthly measurements of LBP and quarterly and yearly retrospective measurements of LBP was highly variable. For both quarterly and yearly recall, social support from colleagues and average LBP days were significantly associated with the recall bias.
Conclusion.
The agreement of pain recall among workers in the current study seems to be good on a group level, but both between and within individuals, the difference between monthly and quarterly and yearly retrospective measurements was quite high. Factors that impacted the recall bias were social support from colleagues and average LBP days over the recall period.
Level of Evidence: 3
Keywords: health care workers, reliability, repeated measurements, text messages, workplace
Low back pain (LBP) is the most significant contributor to years lived with disability.1,2 Accordingly, LBP is one of the most common reasons for activity limitation, sick leave, and work disability.3,4 LBP is highly prevalent among the working population,5 and it has been estimated that approximately 26% to 37% of LBP may be attributable to work-related risk factors.5,6 Therefore, LBP is among the most important outcomes in epidemiologic studies of work-related musculoskeletal disorders.
LBP is a multi-factorial subjective experience mainly accessible through self-report. LBP can be quantified in many ways and the choice of specific measurements has been widely discussed.7,8 Usually, measurements include intensity [on either a visual analogue scale (VAS)9 or a numeric rating scale (NRS)10] and/or duration of discomfort or pain by a single rating of recalled pain over a certain time interval, for example, the past week or 3, 6, or 12 months.7,11 However, retrospectively reported pain may be subject to recall bias.
Several studies have investigated pain recall by investigating the agreement between two different measures of pain. The majority has been within a clinical setting (primarily chronic pain patients).12,13 Moreover, the recall period varies considerably (1 day to 3 months)12–15 and so does the conclusion on agreement between the measures of pain. Some studies found that people are good at recalling previous LBP (pain intensity),12,14 others concluded that recall is inaccurate or systematically biased.13,15 Previous reported biasing factors include individual characteristics such as gender,16 age,17 and pain catastrophizing.18 Moreover, factors in the psychosocial work environment19 are also found to affect the agreement between different measures of pain. A consistent finding in earlier studies is that current status of pain including maximum pain intensity20 influence the memory of pain episodes.17,21
Although the prevalence of LBP is high in certain occupational groups,5 working populations generally differ from chronic pain patients by having less severe and more heterogeneous pain. If patients with high severity are not able to provide accurate information on their pain, it might also be important to recognize the magnitude of such a phenomenon among those who are less affected by their symptoms. Two studies on pain recall bias in workplace populations have been identified.21 One study found retrospective assessment of musculoskeletal pain intensity (for a period of 3 months) to be reliable.21 The other study found that prior musculoskeletal symptoms are poorly remembered after some years, and the recall is strongly influenced by current symptoms.17
The definition of a recall period for obtaining information about LBP has been particularly difficult to reach consensus on. However, it has been recommended to use “in the past four weeks” as a standard optimal time frame for recall of pain.8 Many previous studies have relied on yearly assessments of LBP.17,22 Such a high time span may particularly be prone to recall bias. A possible solution for minimizing the risk of recall bias, but still obtaining a representative measure, could be to assess pain more frequently (e.g., monthly) over a period (e.g., 3 months or 1 year) rather than using a single assessment of pain.
Therefore, the aim of the present study was first to compare the correlation and the agreement between monthly measurements of LBP and quarterly and yearly retrospective measurements of LBP, and second to investigate possible bias factors for recall bias of LBP.
MATERIALS AND METHODS
This study is embedded in a pragmatic stepped wedge cluster randomized controlled trial (RCT), which has been described previously.23 The RCT has been approved by the Danish Data Protection Agency and the Ethics Committee for the regional capital of Denmark (journal number H-4-2012-115). The RCT was designed as a multi-faceted workplace intervention consisting of participatory ergonomics, physical training, and cognitive behavioral training (CBT) aiming at reducing LBP and its consequences among nurses’ aides.23
Participants
The setting for the trial was eldercare workplaces (nursing homes and home care) in a larger municipality in Denmark. To be eligible for participation, employment more than 20 hours a week and being 18 to 65 years of age was a criterion. The exclusion criteria were unwillingness to participate, long-term sick-listed, or not being permanently employed. Written informed consent was obtained from the participants.
Outcomes
LBP was Measured as Duration (Days) of Pain in the Lower Back Each Month by Text Messages.
The question posed was “During the previous month, how many days have you had low back pain?” Retrospectively, we asked the participants about duration (days) of pain the previous 3 months and previous year in an electronic questionnaire: “During the previous [three months/twelve months], how many days have you had low back pain?” The questions did only measure LBP and not LBP with radiating pain.
Possible bias effects were measured at 1-year follow-up by electronic questionnaire. Psychosocial work environment factors were measured by the Copenhagen Psychosocial Questionnaire (COPSOQ) (influence at work, social support from supervisors, and social support from colleagues) and converted into a scale ranging from 0 to 100, with 100 representing the highest degree of the measured dimension of the psychosocial work environment.24,25 Fear avoidance was measured using two items concerning fear avoidance from the short form of the Örebro Musculoskeletal Pain Screening Questionnaire. Each item was measured using a 0 to 10 Likert scale with 0 indicating strongly disagree and 10 indicating strongly agree.26 This questionnaire has not been validated in Danish. For current pain, we used text messages where we had information on pain days (previous month) and pain intensity (i.e., worst pain the preceding month on a 0–10 numeric rank scale). We also looked at average pain days throughout the past 3 months and the past year, respectively.
Procedures
From workplace registrations, we collected information about demographics and work-related factors. At baseline, the participants answered a questionnaire for describing other baseline characteristics (e.g., ethnicity, self-rated health,27 smoking, LBP previous year).11
The setup of the software (SMS Track system)28 for the text message survey was designed for the study in close collaboration with researchers. Every month (on a Monday), the respondents received an automated text message to their private mobile phone, which they were expected to answer by using a text message. A reminder was sent on Wednesday if an answer had not been received. If answers were still missing, we called the participant by phone to get their response. The electronic questionnaire was answered by the participants at their workplace during a follow-up session after the trial ended.
For the current study, eligible participants had to have complete answers on both monthly text messages and retrospective questionnaire. To be included in the analysis for investigation of factors that bias the recall, the participants had to have full answers on both independent and dependent variables.
Statistical Analysis
Statistical analyses were performed in IBM SPSS Statistics for Windows, version 21, Armonk; NY: IBM Corp. Average pain over 1 year was calculated as the mean of the last 12 text messages and the average pain over 3 months was calculated as the mean of the last three text messages. Spearman rank order correlation coefficients were computed, and scatter plots were visualized. Intraclass correlation coefficients (ICCs) are used to compare the consistency between two measures intended to measure the same construct using the same scale by taking variability and mean level into account.29 Therefore, single measures ICCs (two-way mixed models with absolute agreement) were used to assess agreement between retrospective questionnaire recall and text messages. Interpreting the significance of ICCs has been recommended as follows: <0.40 = Poor; 0.40 to 0.59 = Fair; 0.60 to 0.74 = Good; and ≥0.75 = Excellent.30 A sensitivity analysis was conducted with exclusion of those with no pain (0 days with pain in all measurements).
Bland-Altman plots were also constructed to assess the agreement between the retrospective questionnaire and the text messages.31 For this, the differences between average LBP measured by text messages and retrospective LBP measured by questionnaire were plotted against the means of the two measurements for each individual and the limits of agreement were calculated (±1.96 SD).
For investigating possible bias effects for recall bias, a linear regression model was developed with the differences between average LBP measured by text messages and retrospective LBP as the dependent variable treated as a continuous variable. Two models were developed: 1) a crude model with each of the possible bias effects tested individually as independent variables, and 2) a model including demographics and personal factors (fear avoidance) and psychosocial work environment factors (influence at work, social support from supervisors and from colleagues).
RESULTS
There were 339 participants who completed the questionnaire with retrospective measurement of LBP. A total of 282 participants (83%) answered the final 3 months of text messages. Finally, 206 participants (61%) answered all 12 months of text messages and are therefore included in the analyses (see Figure 1). There were no significant differences in age and gender or LBP the previous year between those initially included in the text message survey (N = 590) and those included in the analysis for 12 months (N = 206) and 3 months (N = 282), respectively.
Figure 1.
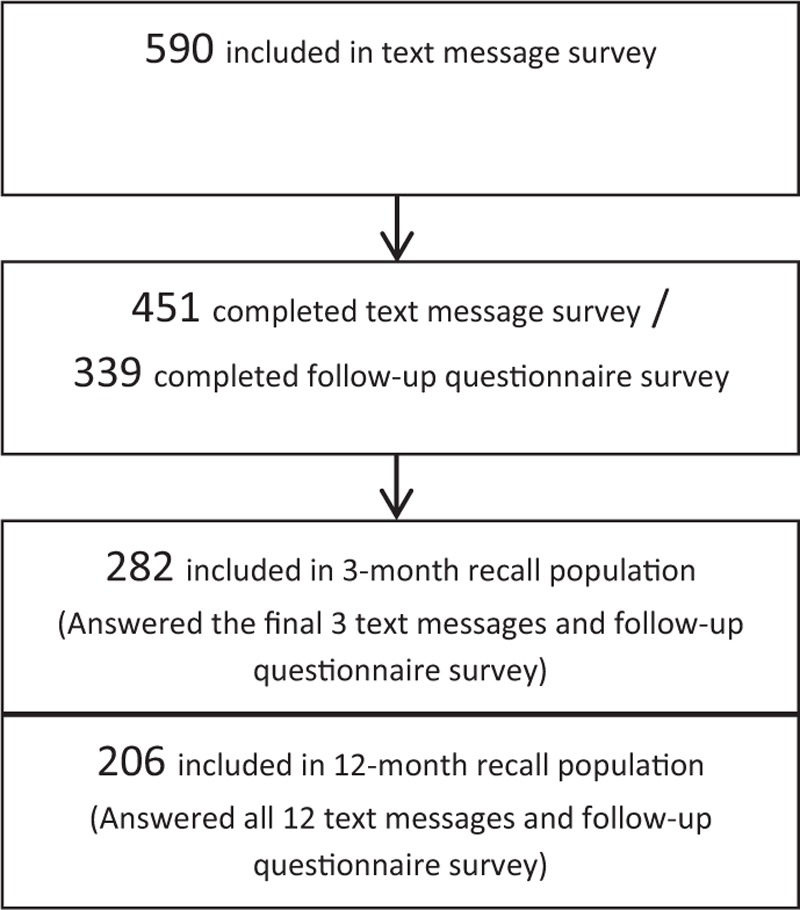
The flow diagram shows the initial 590 participants included in the text message survey. Of those, 451 completed the text message survey and 339 completed the questionnaire with retrospective measurement of LBP. The final study population consists of 282 participants who answered the final 3 months of text messages and the retrospective questionnaire and 206 participants who answered all 12 months of text messages and the retrospective questionnaire.
The study populations consisted of mostly females (94–95%) and most were nurses’ aides (88–89%). At baseline, the average age was 48 years, most of them (89–91%) were born in Denmark and 22% to 23% reported no LBP in the year before the text message survey. The LBP intensity was between 2.3 and 2.5 (Table 1).
TABLE 1.
Baseline Characteristics of the 3-month Recall Population and the 12-month Recall Population
| Population 3 mo (n = 282) | Population 12 mo (n = 206) | |
| Age, yrs | 48 (8.9) | 48 (9.2) |
| Gender (female) | 265 (94%) | 196 (95%) |
| Ethnicity (born in Denmark) | 250 (89%) | 187 (91%) |
| Low back pain previous year | ||
| 0 d | 64 (23%) | 45 (22%) |
| 1–7 d | 90 (32%) | 68 (33%) |
| 8–30 d | 70 (25%) | 51 (25%) |
| 31–90 d | 21 (7%) | 18 (9%) |
| >90 d | 20 (7%) | 13 (6%) |
| Every day | 14 (5%) | 10 (5%) |
| LBP intensity (0–10) | 2.5 (2.8) | 2.3 (2.8) |
| Smokers | 77 (27%) | 56 (27%) |
| Body mass index, kg/m2 | 27 (5.7) | 27 (5.7) |
| Job seniority | ||
| 0–1 yrs | 21 (7%) | 16 (8%) |
| 2–10 yrs | 107 (38%) | 81 (39%) |
| >10 yrs | 128 (45%) | 91 (44%) |
| Type of workplace | ||
| Home care | 149 (53%) | 105 (51%) |
| Nursing homes | 100 (36%) | 78 (38%) |
| Work shift | ||
| Day shift | 241 (86%) | 178 (86%) |
| Evening/night | 37 (13%) | 25 (12%) |
| Type of work | ||
| Nurses’ aides | 250 (89%) | 183 (88%) |
| Service workers | 32 (11%) | 23 (11%) |
| Education | ||
| Unskilled | 16 (6%) | 13 (6%) |
| Low skilled | 185 (66%) | 129 (63%) |
| High skilled | 75 (27%) | 60 (29%) |
Data are presented as mean (SD) or n (%).
For the 12 months measurements, there was a difference in mean values of LBP measured by text messages and the retrospective question. This corresponded to a nonsignificant over-reporting in the retrospective measurements of 1.88 (48.6) days compared with the text messages (Table 2). For 3 months measurements, there was a difference in mean values of LBP measured by text messages and retrospectively that corresponded to an over-reporting in retrospective measurements of 1.65 (14.4) days compared with the text messages. This difference was borderline significant (P = 0.056) (Table 2). In the sensitivity analysis excluding those without pain, the results remained more or less the same, although the mean values of differences in LBP days became slightly higher [12 months mean difference = 2.45 (58.1) days and 3 months mean difference = 2.13 (18.6) days] (data not shown). The bias (mean difference) is also shown in the Bland-Altman plots. In addition to this, the wide limits of agreements for both 3 months’ (−26.6; 29.9 days) and 12 months’ (−93.4; 97.2 days) reporting of LBP indicate a large interindividual variation between the two measures (Figure 2). In addition to the wide limits of agreement, the figures show that there are some outliers. That is, there are some outliers that are over-reporting their pain and some outliers that are under-reporting their pain.
TABLE 2.
Mean, Differences, Correlations, and ICCs of Low Back Pain Days Measured Monthly by Text Messages and Retrospectively at 12 and 3 Months, Respectively
| Retrospective Mean (SD) | Text Messages Mean (SD) | Difference Mean (SD) | 95% CI | P | Correlation | P | ICC | 95% CI | |
| LBP d (12 mo) (n = 206) | 45.1 (81.8) | 43.2 (66.2) | 1.88 (48.6) | −4.86 to 8.63 | 0.583 | r = 0.77 | 0.000 | 0.88 | 0.84 to 0.91 |
| LBP d (3 mo) (n = 286) | 12.6 (23.4) | 10.9 (18.6) | 1.65 (14.4) | −0.04 to 3.33 | 0.056 | r = 0.74 | 0.000 | 0.87 | 0.82 to 0.90 |
The columns show the retrospective mean, the mean of the text messages, the differences in means and their 95% confidence intervals and P values, the correlations and their P values, and the intraclass correlations (ICCs) and their 95% confidence intervals of low back pain days measured monthly by text messages and retrospectively at 12 and 3 months, respectively.
CI indicates confidence interval; ICC, intraclass correlation coefficients; LBP, low back pain; SD, standard deviation.
Figure 2.
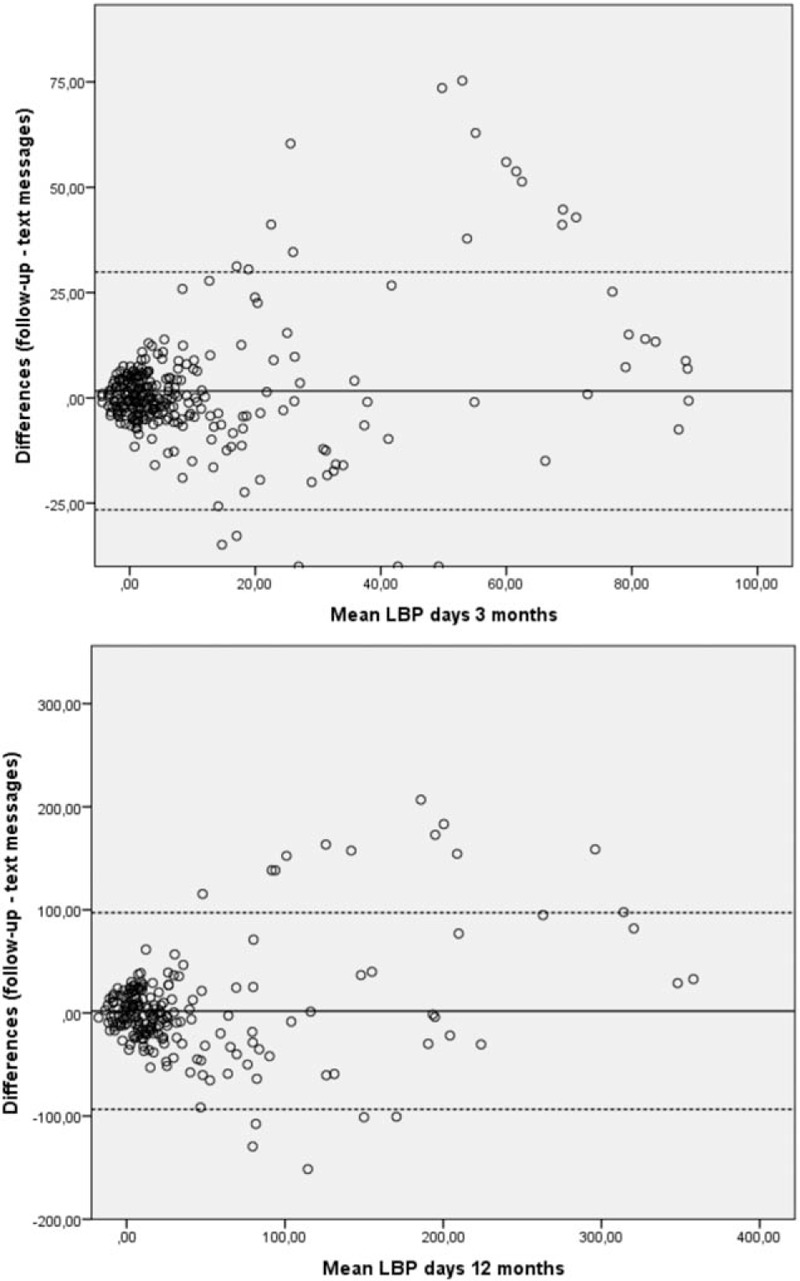
Bland-Altman plots displaying the means of 3 and 12 months reporting of low back pain (LBP), respectively, plotted against the differences between average LBP measured by text messages and retrospective LBP measured by questionnaire. Mean difference is presented as the middle horizontal line and the limits of agreement (±1.96 SD) as the dashed lines.
The correlations between LBP measured by text messages and retrospectively at both 3 and 12 months were high [r = 0.74 (P = 0.000) and r = 0.77 (P = 0.000)] and significant. The ICCs for LBP measured by text messages and retrospectively at both 3 and 12 months were also high [r = 0.88 (95% confidence interval, 95% CI: 0.84–0.91) and r = 0.87 (95% CI: 0.82–0.90)] and significant (Table 2).
Tables 3 and 4 summarize the results of the linear regressions investigating possible bias factors for the recall bias. For both 3 and 12 months recall, social support from colleagues and average LBP days were significantly associated with the recall bias. In the univariate model, average LBP days had the highest explained variance (R2 = 0.12) for the recall bias, whereas all other factors had rather low explained variance (R2 = 0.01–0.04).
TABLE 3.
Possible Bias Factors for the Differences in Measurements of Low Back Pain (LBP) at 3-month Recall Period
| Model 1* | Model 2† | |||||||||||
| Factor | N | B | Std. Error | 95% CI | P | R2 | N | B | Std. Error | 95% CI | P | R2 |
| Age | 282 | 0.07 | 0.10 | −0.12 to 0.27 | 0.48 | 0.01 | 252 | 0.08 | 0.10 | −0.12 to 0.29 | 0.41 | 0.05 |
| Gender | 282 | −4.32 | 3.60 | −11.40 to 2.76 | 0.23 | 0.01 | 252 | −6.36 | 4.10 | −14.43 to 1.71 | 0.12 | 0.05 |
| Fear avoidance 1 (0–10) | 270 | −0.01 | 0.25 | −0.50 to 0.49 | 0.98 | 0.01 | 252 | −0.21 | 0.30 | −0.80 to 0.37 | 0.47 | 0.05 |
| Fear avoidance 2 (0–10) | 266 | 0.20 | 0.25 | −0.28 to 0.68 | 0.41 | 0.01 | 252 | 0.28 | 0.28 | −0.28 to 0.84 | 0.33 | 0.05 |
| Influence at work | 279 | 0.02 | 0.04 | −0.06 to 0.09 | 0.68 | 0.01 | 252 | 0.03 | 0.04 | −0.05 to 0.11 | 0.45 | 0.05 |
| Social support from supervisor | 271 | −0.02 | 0.04 | −0.10 to 0.06 | 0.60 | 0.01 | 252 | −0.08 | 0.05 | −0.18 to 0.01 | 0.08 | 0.05 |
| Social support from colleagues | 270 | 0.13 | 0.05 | 0.03 to 0.24 | 0.01 | 0.02 | 252 | 0.19 | 0.06 | 0.07 to 0.31 | 0.00 | 0.05 |
| LBP present pain, d (4 wks) | 282 | 0.05 | 0.13 | −0.21 to 0.30 | 0.70 | 0.01 | 252 | 0.07 | 0.14 | −0.21 to 0.35 | 0.62 | 0.05 |
| LBP present intensity (0–10) | 280 | −0.24 | 0.33 | −0.89 to 0.41 | 0.47 | 0.01 | 250 | −0.26 | 0.37 | −0.98 to 0.46 | 0.47 | 0.05 |
| Average LBP, d (3 mo) | 282 | 0.25 | 0.04 | 0.17 to 0.33 | <0.00 | 0.12 | 252 | 0.28 | 0.04 | 0.19 to 0.36 | <0.00 | 0.19 |
The bias factors that were investigated were measured at 1-year follow-up by electronic questionnaire [gender, age, and psychosocial work environment factors (influence at work, social support from supervisors and from colleagues], and by text messages [current pain status (days and intensity) and fear avoidance beliefs and average low back pain].
*Univariate model.
†Adjusted for age, gender, fear avoidance, influence at work, social support from supervisor, and social support from colleagues.
TABLE 4.
Possible Bias Factors for the Differences in Measurements of Low Back Pain (LBP) at 12-month Recall Period
| Model 1* | Model 2† | |||||||||||
| Factor | N | B | Std. Error | 95% CI | P | R2 | N | B | Std. Error | 95% CI | P | R2 |
| Age | 202 | 0.15 | 0.37 | −0.59 to 0.88 | 0.69 | 0.01 | 186 | −0.01 | 0.38 | −0.77 to 0.75 | 0.98 | 0.06 |
| Gender | 202 | −9.59 | 15.80 | −40.74 to 21.55 | 0.54 | 0.01 | 186 | −11.00 | 16.64 | −43.84 to 21.85 | 0.51 | 0.06 |
| Fear avoidance 1 (0–10) | 201 | 0.99 | 0.96 | −0.91 to 2.88 | 0.31 | 0.01 | 186 | −0.25 | 1.14 | −2.49 to 1.99 | 0.83 | 0.06 |
| Fear avoidance 2 (0–10) | 198 | 1.70 | 0.93 | −0.14 to 3.54 | 0.07 | 0.02 | 186 | 1.81 | 1.07 | −0.30 to 3.92 | 0.09 | 0.06 |
| Influence at work | 201 | 0.07 | 0.15 | −0.21 to 0.36 | 0.64 | 0.01 | 186 | 0.08 | 0.15 | −0.23 to 0.38 | 0.62 | 0.06 |
| Social support from supervisor | 194 | 0.25 | 0.17 | −0.08 to 0.58 | 0.14 | 0.01 | 186 | 0.02 | 0.19 | −0.36 to 0.39 | 0.92 | 0.06 |
| Social support from colleagues | 192 | 0.62 | 0.22 | 0.19 to 1.05 | 0.00 | 0.04 | 186 | 0.60 | 0.24 | 0.12 to 1.07 | 0.01 | 0.06 |
| LBP present pain, d (4 wks) | 202 | 1.01 | 0.57 | −0.12 to 2.13 | 0.08 | 0.02 | 186 | 1.06 | 0.58 | −0.08 to 2.20 | 0.07 | 0.08 |
| LBP present intensity (0–10) | 201 | 0.60 | 1.43 | −2.21 to 3.42 | 0.67 | 0.01 | 185 | 0.51 | 1.49 | −2.43 to 3.45 | 0.73 | 0.06 |
| Average LBP, d (12 mo) | 202 | 0.24 | 0.05 | 0.14 to 0.33 | <0.00 | 0.12 | 186 | 0.26 | 0.05 | 0.16 to 0.35 | <0.00 | 0.20 |
The bias factors that were investigated were measured at 1-year follow-up by electronic questionnaire [gender, age, and psychosocial work environment factors (influence at work, social support from supervisors and from colleagues)], and by text messages [current pain status (days and intensity) and fear avoidance beliefs and average low back pain].
*Univariate model.
†Adjusted for age, gender, fear avoidance, influence at work, social support from supervisor, and social support from colleagues.
DISCUSSION
The main findings of this study were that the correlation between monthly and quarterly and yearly retrospective measures of pain among workers seems to be good on a group level. On group level, there were small nonsignificant differences in agreement, but there were large interindividual variation. Factors that impacted the recall bias were social support from colleagues and average LBP days over the recall period.
As there were small nonsignificant differences in mean values of monthly measurements of LBP compared with quarterly and yearly retrospective measurements of LBP, the agreement between measures of pain in the current study can be interpreted to be generally good on a group level. However, the differences corresponded to an over-reporting at 12 months of 4% and at 3 months of 15%. It seems like the shorter recall time (3 months) is more difficult to recall than the longer recall time (12 months). This is in contrast to what other studies have found12,13,21 and the finding needs further investigations to clarify if this is a trend also in longer recalls than 12 months and in shorter recalls than 3 months.
The relatively small nonsignificant average differences between monthly measurements of LBP and quarterly and yearly retrospective measurements suggest that retrospective assessments up to 12 months can capture quite reliable data on LBP at group level. However, within individuals, the difference between monthly measurements of LBP and quarterly and yearly retrospective measurements of LBP was highly variable and subject to error. In this study, the limits of agreement of the Bland-Altman plots were extremely wide, (−26.6 to 29.9 days of LBP for 3 months and −93.4 to 97.2 days of LBP for 12 months). Such high values could potentially lead to a great risk of misclassification of acute, subacute, and chronic pain. For instance, the limits of agreement for 12 months exceed the number of days with pain that is usually considered chronic pain (12 weeks).32 Using retrospective assessment instead of more frequent assessments to measure change in LBP could therefore result in a high number of individuals being incorrectly classified as having significantly improved or worsened. But this needs to be investigated in future studies. The high variability in the differences between monthly measurements of LBP and retrospective measurements of LBP confirms that even over relatively short time intervals, retrospective assessments of LBP may not be appropriate to individual levels of LBP or changes in LBP over time.
Theoretical and empirical work has suggested that retrospective ratings are affected by the peak- and end-heuristics, that is, they emphasize the most intense part of the experience and the ending of the experience.33,34 In contrast to previous studies in both clinical and workplace settings, we did not find that current LBP status (present pain days and pain intensity) impacted the recall of LBP.17,19–21 However, we found that the average pain throughout the recall period had the strongest association with the recall bias. An interesting finding was that higher social support from colleagues was significantly associated with the recall bias in LBP. It could be that social support from colleagues makes you talk more about your pain and thereby increase the awareness of pain and thus lead to an over-reporting of symptoms. Overall, the statistical model was only able to explain a limited part of the recall bias (R2 = 0.19). It is therefore necessary with further studies to investigate other factors for recall bias to better understand this phenomenon.
As LBP is one of the most important outcomes in epidemiologic studies of musculoskeletal disorders, it is important to have a reliable measure. The findings of our study indicate that LBP days measured retrospectively at 3 months and at 1 year may not be appropriate to measure LBP at the individual level. In particular for measuring changes in LBP over time, the retrospective assessment cannot be recommended. Instead, more frequent measures of LBP for determining individual levels and changes in LBP over time should be recommended. Furthermore, our results also indicate that for minimizing bias, information about social support from colleagues and average LBP days should be measured and adjusted for.
Our study has some limitations. First, the study is comparing two types of retrospective assessments of LBP. We compare monthly retrospective measurements of LBP (measured by text messages) with quarterly and yearly retrospective measurements of LBP (measured by electronic questionnaire). Thus, there is a risk that both measurements are impacted by recall bias. A study design using daily records of pain would most likely have given us a more precise pain assessment than the monthly measurements. With the relatively high number of participants excluded from the analysis due to missing answers, there is a risk of sample bias. However, those who did not fully answer the monthly text messages or did not answer the follow-up questions did not differ from our study population. We do not expect that the possible difference in the symptom status at follow-up between the participants and nonparticipants would have biased our main results. Another strong limitation is the use of nonvalidated questionnaires.
The strengths of our study involve the different ways we evaluated the agreement between the measurements. We did not only rely on the correlations, but we also evaluated the agreement with ICCs and more in detail within individuals by use of the Bland-Altman plots. It is also a strength that we were able to evaluate the agreement between both quarterly and yearly retrospective assessment of LBP as well as recall bias factors. We consider our study population to be homogenous with respect to educational level and type of work, which can be considered a strength. As this is a workplace setting, the study population consisted of mainly healthy persons. However, most individuals reported LBP of some degree during the study period. Nevertheless, individuals without LBP could have inflated the results. However, when individuals with no complaints were left out of the analysis, the results remained more or less the same.
CONCLUSION
The agreement between pain measures among workers seems to be good on a group level, but within individuals, the difference between monthly measurements of LBP and quarterly and yearly retrospective measurements was quite high and highly variable. Using quarterly and yearly retrospective assessment may therefore not be appropriate to measure individual levels of LBP or changes in LBP over time. We therefore recommend more frequent measures of LBP. Factors that impacted the recall bias of LBP were social support from colleagues and average LBP days. This finding is interesting and should be investigated further.
Key Points
The accuracy of quarterly and yearly pain recall among workers seems to be good on a group level.
Using quarterly and yearly retrospective assessments may not be appropriate to measure LBP over time on an individual level.
Frequent measures of LBP are needed to measure LBP on an individual level.
Clinicians and researchers should take this into account when using LBP as an outcome measure.
Footnotes
The manuscript submitted does not contain information about medical device(s)/drug(s).
The Danish Working Environment Research Fund (journal number 201100813) and the national Prevention Fund (journal number 11-2-1a-113) funds were received in support of this work.
No relevant financial activities outside the submitted work.
References
- 1.Vos T, Flaxman AD, Naghavi M, et al. Years lived with disability (YLDs) for 1160 sequelae of 289 diseases and injuries 1990–2010: a systematic analysis for the Global Burden of Disease Study 2010. Lancet 2013; 380:2163–2196. [DOI] [PMC free article] [PubMed] [Google Scholar]
- 2.Murray CJ, Vos T, Lozano R, et al. Disability-adjusted life years (DALYs) for 291 diseases and injuries in 21 regions, 1990–2010: a systematic analysis for the Global Burden of Disease Study 2010. Lancet 2013; 380:2197–2223. [DOI] [PubMed] [Google Scholar]
- 3.Lidgren L. The bone and joint decade 2000–2010. Bull World Health Organ 2003; 81:629. [PMC free article] [PubMed] [Google Scholar]
- 4.Buchbinder R, Blyth FM, March LM, et al. Placing the global burden of low back pain in context. Best Pract Res Clin Rheumatol 2013; 27:575–589. [DOI] [PubMed] [Google Scholar]
- 5.Driscoll T, Jacklyn G, Orchard J, et al. The global burden of occupationally related low back pain: estimates from the Global Burden of Disease 2010 study. Ann Rheum Dis 2014; 73:975–981. [DOI] [PubMed] [Google Scholar]
- 6.Punnett L, Prüss-Utün A, Nelson DI, et al. Estimating the global burden of low back pain attributable to combined occupational exposures. Am J Ind Med 2005; 48:459–469. [DOI] [PubMed] [Google Scholar]
- 7.Chapman JR, Norvell DC, Hermsmeyer JT, et al. Evaluating common outcomes for measuring treatment success for chronic low back pain. Spine (Phila Pa 1976) 2011; 36:S54–S68. [DOI] [PubMed] [Google Scholar]
- 8.Dionne CE, Dunn KM, Croft PR, et al. A consensus approach toward the standardization of back pain definitions for use in prevalence studies. Spine (Phila Pa 1976) 2008; 33:95–103. [DOI] [PubMed] [Google Scholar]
- 9.Hawker GA, Mian S, Kendzerska T, et al. Measures of adult pain: Visual analog scale for pain (vas pain), numeric rating scale for pain (nrs pain), mcgill pain questionnaire (mpq), short-form mcgill pain questionnaire (sf-mpq), chronic pain grade scale (cpgs), short form-36 bodily pain scale (sf-36 bps), and measure of intermittent and constant osteoarthritis pain (icoap). Arthritis Care Res 2011; 63:S240–S252. [DOI] [PubMed] [Google Scholar]
- 10.Jensen MP, Karoly P, Braver S. The measurement of clinical pain intensity: a comparison of six methods. Pain 1986; 27:117–126. [DOI] [PubMed] [Google Scholar]
- 11.Kuorinka I, Jonsson B, Kilbom A, et al. Standardised Nordic questionnaires for the analysis of musculoskeletal symptoms. Appl Ergon 1987; 18:233–237. [DOI] [PubMed] [Google Scholar]
- 12.Jamison RN, Raymond SA, Slawsby EA, et al. Pain assessment in patients with low back pain: comparison of weekly recall and momentary electronic data. J Pain 2006; 7:192–199. [DOI] [PubMed] [Google Scholar]
- 13.Giske L, Sandvik L, Røe C. Comparison of daily and weekly retrospectively reported pain intensity in patients with localized and generalized musculoskeletal pain. Eur J Pain 2010; 14:959–965. [DOI] [PubMed] [Google Scholar]
- 14.Bolton JE. Accuracy of recall of usual pain intensity in back pain patients. Pain 1999; 83:533–539. [DOI] [PubMed] [Google Scholar]
- 15.Carey TS, Garrett J, Jackman A, et al. Reporting of acute low back pain in a telephone interview| identification of potential biases. Spine (Phila Pa 1976) 1995; 20:787–790. [PubMed] [Google Scholar]
- 16.McGorry RW, Webster BS, Snook SH, et al. Accuracy of pain recall in chronic and recurrent low back pain. J Occup Rehab 1999; 9:169–178. [Google Scholar]
- 17.Miranda H, Gold JE, Gore R, Punnett L. Recall of prior musculoskeletal pain. Scand J Work Environ Health 2006; 32:294–299. [DOI] [PubMed] [Google Scholar]
- 18.Lefebvre JC, Keefe FJ. Memory for pain: the relationship of pain catastrophizing to the recall of daily rheumatoid arthritis pain. Clin J Pain 2002; 18:56–63. [DOI] [PubMed] [Google Scholar]
- 19.Linton SJ. Memory for chronic pain intensity: correlates of accuracy. Percept Mot Skills 1991; 72:1091–1095. [DOI] [PubMed] [Google Scholar]
- 20.Pallegama RW, Ariyasinghe S, Perera ED, et al. Influence of catastrophizing and personality traits on recalled ratings of acute pain experience in healthy young adults. Pain Med 2017; 18:49–60. [DOI] [PubMed] [Google Scholar]
- 21.Brauer C, Thomsen JF, Loft IP, et al. Can we rely on retrospective pain assessments? Am J Epidemiol 2003; 157:552–557. [DOI] [PubMed] [Google Scholar]
- 22.Maul I, Läubli T, Klipstein A, et al. Course of low back pain among nurses: a longitudinal study across eight years. Occup Environ Med 2003; 60:497–503. [DOI] [PMC free article] [PubMed] [Google Scholar]
- 23.Rasmussen CD, Holtermann A, Mortensen OS, et al. Prevention of low back pain and its consequences among nurses’ aides in elderly care: a stepped-wedge multi-faceted cluster-randomized controlled trial. BMC Public Health 2013; 13:1088. [DOI] [PMC free article] [PubMed] [Google Scholar]
- 24.Bjorner JB, Pejtersen JH. Evaluating construct validity of the second version of the Copenhagen Psychosocial Questionnaire through analysis of differential item functioning and differential item effect. Scand J Public Health 2010; 38:90–105. [DOI] [PubMed] [Google Scholar]
- 25.Pejtersen JH, Kristensen TS, Borg V, et al. The second version of the Copenhagen Psychosocial Questionnaire. Scand J Public Health 2010; 38:8–24. [DOI] [PubMed] [Google Scholar]
- 26.Linton SJ, Nicholas M, MacDonald S. Development of a short form of the Örebro Musculoskeletal Pain Screening Questionnaire. Spine 2011; 36:1891–1895. [DOI] [PubMed] [Google Scholar]
- 27.Ware JE, Kosinski M, Dewey JE, Gandek B. SF-36 health survey: Manual and interpretation guide. 2nd ed; Lincoln, R.I.; QualityMetric; Boston, Mass.: Health Assessment Lab, 2000. [Google Scholar]
- 28.SMS-Track. Available at: https://www.sms-track.com. Accessed July 29, 2013. Ref Type: Electronic Citation. [Google Scholar]
- 29.Stone AA, Broderick JE, Shiffman SS, et al. Understanding recall of weekly pain from a momentary assessment perspective: absolute agreement, between-and within-person consistency, and judged change in weekly pain. Pain 2004; 107:61–69. [DOI] [PubMed] [Google Scholar]
- 30.Cicchetti D, Bronen R, Spencer S, et al. Rating scales, scales of measurement, issues of reliability: resolving some critical issues for clinicians and researchers. J Nerv Ment Dis 2006; 194:557–564. [DOI] [PubMed] [Google Scholar]
- 31.Bland JM, Altman D. Statistical methods for assessing agreement between two methods of clinical measurement. Lancet 1986; 327:307–310. [PubMed] [Google Scholar]
- 32.van Tulder MW, Koes B, Malmivaara A. Outcome of non-invasive treatment modalities on back pain: an evidence-based review. Eur Spine J 2006; 15:S64–S81. [DOI] [PMC free article] [PubMed] [Google Scholar]
- 33.Schneider S, Stone AA, Schwartz JE, et al. Peak and end effects in patients’ daily recall of pain and fatigue: a within-subjects analysis. J Pain 2011; 12:228–235. [DOI] [PMC free article] [PubMed] [Google Scholar]
- 34.Fredrickson BL. Extracting meaning from past affective experiences: the importance of peaks, ends, and specific emotions. Cognit Emot 2000; 14:577–606. [Google Scholar]