

Abstract
Background
Fermentation is a widely used method of natural food preservation that has consequences on the nutritional value of the transformed food. Fermented dairy products are increasingly investigated in view of their ability to exert health benefits beyond their nutritional qualities.
Objective
To explore the mechanisms underpinning the health benefits of fermented dairy intake, the present study followed the effects of milk fermentation, from changes in the product metabolome to consequences on the human serum metabolome after its ingestion.
Methods
A randomized crossover study design was conducted in 14 healthy men [mean age: 24.6 y; mean body mass index (in kg/m2): 21.8]. At the beginning of each test phase, serum samples were taken 6 h postprandially after the ingestion of 800 g of a nonfermented milk or a probiotic yogurt. During the 2-wk test phases, subjects consumed 400 g of the assigned test product daily (200 g, 2 times/d). Serum samples were taken from fasting participants at the end of each test phase. The serum metabolome was assessed through the use of LC-MS–based untargeted metabolomics.
Results
Postprandial serum metabolomes after milk or yogurt intake could be differentiated [orthogonal projections to latent structures discriminant analysis (OPLS-DA) Q2 = 0.74]. Yogurt intake was characterized by higher concentrations of 7 free amino acids (including proline, P = 0.03), reduced concentrations of 5 bile acids (including glycocholic acid, P = 0.04), and modulation of 4 indole derivative compounds (including indole lactic acid, P = 0.01). Fasting serum samples after 2 wk of daily intake of milk or yogurt could also be differentiated based on their metabolic profiles (OPLS-DA Q2 = 0.56) and were discussed in light of the postprandial results.
Conclusion
Metabolic pathways related to amino acids, indole derivatives, and bile acids were modulated in healthy men by the intake of yogurt. Further investigation to explore novel health effects of fermented dairy products is warranted.This trial was registered at clinicaltrials.gov as NCT02230345.
Keywords: metabolomics, dairy, yogurt, milk, postprandial, indole derivatives, bile acids, fermentation, gluconic acid, healthy men
Introduction
Fermentation of milk was first used by cattle herders as a way to extend storage life, facilitate transportability, and, by reducing lactose content, improve digestibility (1). Today, ∼20–40 kg of fermented dairy products are consumed per person each year in Western countries, of which ∼40% is represented by yogurt (2, 3). During fermentation, the proteolytic and lipolytic activities of lactic acid bacteria (LAB), as well as the conversion of milk carbohydrates to alcohols, carbon dioxide, and organic acids, cause major changes in the product's final composition and organoleptic properties. Consequently, these foods have been extensively evaluated for their role in health. In particular, the beneficial effects of yogurt have been investigated for more than a century (4) and include immune function modulation, lowering of circulating cholesterol, and improvements in a range of gastrointestinal conditions such as lactose intolerance, constipation, diarrheal diseases, colon cancer, inflammatory bowel disease, Helicobacter pylori infection, and allergies (5–7). However, the mechanisms underpinning these potential properties are not yet well-established, although many compounds that result from the bioactivity of LAB have been associated with the reported health benefits of yogurt, such as conjugated linoleic acid (8), sphingolipids (9), or bioactive peptides (10, 11). Moreover, the health qualities of yogurt may rely not only on the production of bioactive metabolites during milk fermentation, but also on both the activity of the LAB in the gut and the modulation of the host intestinal microbiota (12).
The use of untargeted metabolomics in dietary interventions is a promising approach as the method can give a snapshot of the metabolic activity of a subject at a specific time point after the ingestion of a test food (13–15). However, to date, few nutritional intervention studies investigating fermented dairy intake have used metabolomics (16–21). The primary aim of the present study is to evaluate the metabolic response of healthy men to the ingestion of a fermented dairy product with the use of an untargeted metabolomics approach. The impact of fermentation on the milk metabolome is investigated, as is that of fermented milk ingestion on the serum metabolome, both postprandially and fasting after short-term daily intake.
Methods
Subjects
The subjects were healthy adult men (n = 14) aged 24.6 ± 4.7 y (mean ± SD) and with a BMI (in kg/m2) of 21.8 ± 1.8 (mean ± SD) (Supplemental Table 1). None of the subjects had evidence of intolerance or adverse reactions to dairy products. Details regarding exclusion criteria and the inclusion visit are given by Burton et al. (22). One subject was excluded from all analyses due to suspected noncompliance with dietary instructions that was detected during microbiota analysis (22). Another subject withdrew before completing the final test day due to acute illness (Supplemental Figure 1). Before entering the study, all subjects provided written informed consent. The study was conducted in accordance with the Declaration of Helsinki as revised in 1983 and received ethical approval from the Commission Cantonale d’Ethique de la Recherche sur l’Etre Humain (CER-VD, approval number 392/13, Vaud, Switzerland). The study was registered at clinicaltrials.gov as NCT02230345.
Test products
The fermented test product was a yogurt produced by fermentation of milk with classical yogurt starter cultures and the widely used probiotic Lactobacillus rhamnosus Gorbach-Goldin (LGG) (23). Starter cultures consisted of a mix of Lactobacillus delbrueckii ssp. bulgaricus and Streptococcus thermophilus and were obtained from Chr. Hansen A/S, Denmark (Thermophilic Yoflex). The probiotic LGG was obtained from the Culture Collection of the University of Goteborg, Sweden (CCUG 34,291). The nonfermented dairy control was a chemically acidified milk obtained by the addition of 2% glucono-δ-lactone (GDL, ≥99.0%, Jungbunzlauer AG, Switzerland). The addition of 2% GDL to milk mimics the slow pH reduction occurring during fermentation and allows the final product to have a color, texture, and pH similar to a mild semiliquid yogurt. All the milk used in the study was provided by Emmi (Mittelland Molkerei AG, Switzerland) from a single production batch. Details of product preparation, nutritional composition, and biochemical analyses are given in the Supplemental Methods and Supplemental Table 2.
Study design
The intervention study used a randomized, double-blind, and crossover design (Figure 1). The postprandial response to the acute intake of milk or yogurt was assessed at the beginning of each intervention phase. During this test day, participants ingested a single 800-g dose of milk or yogurt within 15 min and serum was sampled postprandially up to 6 h (fasting, then 15, 30, 60, 90, 120, 180, 240, 300, and 360 min). The dose of 800 g, although uncommon in normal dietary situations, was chosen to amplify the postprandial effect of dairy intake, thereby facilitating the identification of the metabolites and metabolic pathways that are most likely to change after normal chronic intake. Such an acute approach has been previously used to characterize postprandial lipidemia after dairy intake (24) or to identify postprandial biomarkers of dairy intake (25). During the following 2 wk, subjects were instructed to consume 400 g of the assigned test product daily (200 g morning and evening) and fasting serum was taken at the end of the 2-wk period to evaluate the effect of short-term intake on the fasting serum metabolome. During the 3-wk run-in and 2-wk washout periods, participants consumed 400 g of nonacidified (normal) milk per day (200 g morning and evening). Dietary intake was semicontrolled during all phases of the study with specific guidance given on portions of fermented foods, alcohol intake, and coffee intake. Participants were instructed to exclude all dairy products from their diet except those provided. Before each test day, participants followed a 3-d controlled diet by only consuming food provided by the investigators (22).
FIGURE 1.

Overview of study design. Participants were assigned randomly to group 1 or group 2 in a crossover design to test the acute and short-term intake of acidified milk and yogurt. At the beginning of each test phase, serum samples were taken 6 h postprandially after the ingestion of 800 g of a nonfermented milk or a probiotic yogurt. During the 2-wk test phases, subjects consumed 400 g of the assigned test product daily (200 g, 2 times/d). Serum samples were taken from fasting participants at the end of each test phase. A washout period separated each test phase and a run-in preceded the beginning of the study. Subjects consumed 400 g of regular milk/d during the run-in and washout periods.
Untargeted metabolomics
Serum and products samples were kept at −80°C before being analyzed with the use of the same protocol. To limit ion-suppression, phospholipids were removed from the samples by the Phree filter (Phenomenex Inc., Torrance, CA). An ultra-high-pressure LC system, coupled to a quadrupole time-of-flight mass spectrometer, was applied for untargeted metabolomics analysis (UltiMate 3000, Thermo Fisher Scientific, Waltham, MA, coupled to a maXis 4G+, Bruker Daltonik GmbH, Bremen, Germany). The mass spectrometer electrospray interface was operating in positive ion mode and spectra were recorded from m/z 75 to m/z 1500. In light of the large number of samples to be measured and the better coverage of the metabolome in the positive mode (26), positive mode was favored over negative mode. Details regarding sample preparation and LC-MS protocol are given in the Supplemental Methods. Mass-spectrometer signal drift was assessed with the regular injection of a quality control sample (QC) consisting of either a pool of all serum samples or all products samples. Contaminants were accounted for by the injection of a blank (ultrafiltered water). For metabolite identification, the Human Metabolome Database (27), the MassBank of North America (28), the National Institute of Standards and Technology database (NIST v14), and Metlin (29) were used with a 5 ppm accuracy threshold. Identities of selected metabolites were confirmed by performing collision-induced dissociation (5–70 eV collision energies) and/or with the injection of standards. Standards were either purchased separately or obtained from the Mass Spectrometry Metabolite Library kit (MSMLS, IROA Technologies, LLC, Bolton, MA; Gainesville, FL). If absent from the MSMLS kit, bile acid (BA) identities were confirmed with the injection of a bile salt extract solution. All solvent, reagents, and standards were purchased from Sigma-Aldrich Chemie GmbH (Buchs, Switzerland). As the analysis is semi-quantitative, the concentrations mentioned in the text refer to relative concentrations, determined from the metabolites' peak area (arbitrary unit).
Data processing and statistical analysis
Progenesis QI (v.2.3.6198.24128, NonLinear Dynamics Ltd., Newcastle upon Tyne, United Kingdom) was used for retention time correction, peak-picking, deconvolution, and normalization with default settings (default automatic sensitivity and without minimum peak width). Signal drift correction was performed with R (v.3.1.2; R Foundation for Statistical Computing, Vienna, Austria) via the QC-based robust locally estimated scatterplot smoothing signal correction method (30). Metabolites with poor repeatability, i.e., detected in <50% of QCs and with a relative standard deviation (RSD) >30% in the QC samples, were removed. Also, features that had a median in the QC samples that was <3 times higher than the median calculated for the blanks were excluded. For each metabolite, nonparametric analysis of longitudinal data (nparLD) was performed to test the hypothesis that a time effect exists postprandially (nparLD R package, 0.05 as P significance cutoff) (31). A hierarchical clustering analysis was then conducted on this final dataset to group metabolites based on their postprandial kinetics (amap and dendextend R packages, clustering by Spearman's distance measure and Ward linkage). Five clusters were chosen based on the visual differences in the postprandial responses.
Orthogonal projections to latent structures discriminant analysis (OPLS-DA, SIMCA-P software v.14.0, Umetrics, Umeå, Sweden) was conducted to differentiate milk from yogurt, or serum after milk intake from serum after yogurt intake. The dataset was scaled through the use of the unit variance method to make all metabolites equally important and to limit the over-influence of metabolites with manyfold changes. The incremental AUC was used for postprandial data (MESS R package). Quality of the models was evaluated by the goodness-of-fit parameter (R2Y) and the predictive ability parameter (Q2, calculated by 12-fold cross-validation). Subsequently, to rule out any random separation of the sample groups, permutation tests with 999 random permutations were carried out (32). Finally, the most discriminatory metabolites were selected based on variable importance in projection (VIP) scores. Both VIPtot (VIP scores for the predictive and orthogonal components) and VIPpred (VIP scores for the predictive component) were calculated (33). VIPtot > 1 was used as the minimum threshold value for variable selection. VIPpred, VIPtot, as well as the Jack-Knife 95% confidence intervals (VIPtot_CI) are indicated in Supplemental Table 3. In addition to the multivariate approach, a univariate analysis was performed, as the 2 methods have been shown to be complementary (34). A paired Wilcoxon’s signed rank test was conducted on each metabolite to compare the products, the postprandial serum, and the fasting serum. Multiple comparisons were adjusted by Benjamini Hochberg's correction (P = 0.05 as the threshold for significance). The Kolmogorov-Smirnov test was used to compare the mass distributions of discriminating metabolites (R 3.1.2).
Results
A total of 2302 unique metabolites were detected in the test products or serum and used for further statistical analysis. Figure 2 summarizes the parts of the metabolome that are shared between the different types of sample.
FIGURE 2.
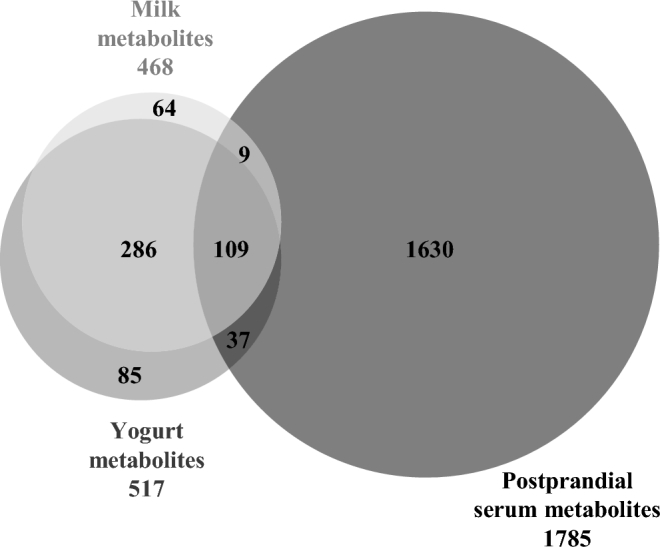
Shared metabolites between milk, yogurt, and postprandial serum of healthy men, assessed by LC-MS–based metabolomics.
Products metabolome
A higher number of metabolites was measured in yogurt compared with milk, in line with the expected release of new metabolites during fermentation. Sixteen percent of the milk metabolome (73 metabolites) was no longer detected in yogurt, whereas 24% of the yogurt metabolome was not present in milk (122 new metabolites). Nevertheless, 395 metabolites remained present in both products, representing 84% and 76% of the milk and yogurt metabolome, respectively. The multivariate analysis confirmed the clear difference between the 2 product metabolomes (Figure 3A). The OPLS-DA model showed goodness-of-fit and high prediction ability (R2Y = 0.98, Q2 = 0.98), both indicators being higher than the corresponding values from the permutation test (Supplemental Figure 2). Among the 590 metabolites measured in milk and/or yogurt, 432 (73%) could discriminate milk from yogurt (VIPtot > 1 or P < 0.05). Comparison of the mass distribution of the discriminatory metabolites (m/z, Figure 4A) revealed that metabolites with higher concentrations in milk (i.e., decreased during fermentation) had a significantly lower mass distribution compared with metabolites with higher concentrations in yogurt (i.e., produced during fermentation) (one-sided Kolmogorov-Smirnov test, P = 5.46 × 10⁻³).
FIGURE 3.

Differentiation of dairy products and serum samples of healthy men after milk or yogurt intake through the use of untargeted LC-MS metabolomics. OPLS-DA scores plot derived from (A) milk and yogurt samples, (B) postprandial serum after milk and yogurt intake (800 g), and (C) fasting serum after 2 wk of daily intake (400 g/d) of milk or yogurt. OPLS-DA, orthogonal projections to latent structures discriminant analysis; Q2, predictive ability parameter; R2Y, goodness-of-fit parameter; t[1], OPLS-DA predictive component; to[1], OPLS-DA orthogonal component.
FIGURE 4.
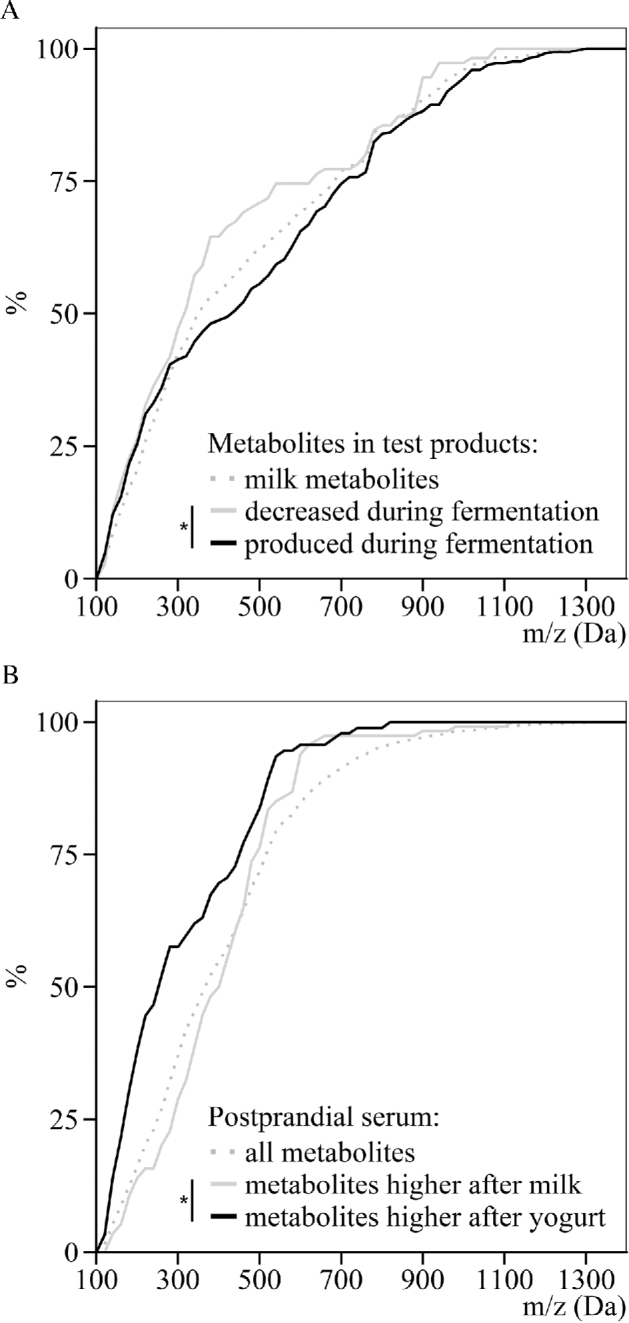
Differentiation of the size distribution of metabolites in dairy products and serum samples of healthy men after milk or yogurt intake through the use of untargeted LC-MS metabolomics. (A) Cumulative mass distribution of all milk metabolites, metabolites that decreased during fermentation, or metabolites that were produced during fermentation (OPLS-DA VIPtot > 1 or P < 0.05). (B) Cumulative mass distribution of all serum metabolites, metabolites with higher postprandial serum concentration after milk intake, or metabolites with higher postprandial serum concentration after yogurt intake (OPLS-DA VIPtot > 1 or P < 0.05). * P < 0.01, Kolmogorov-Smirnov test between the 2 indicated distributions. OPLS-DA, orthogonal projections to latent structures discriminant analysis; VIPtot, variable importance in projection for the predictive and orthogonal components.
Postprandial serum metabolome: general trends
A total of 1785 metabolites were detected in serum. The nparLD analysis showed that approximately half of the serum metabolome (51%, 906 metabolites) showed a dynamic response to the acute intake of milk and/or yogurt, 29% (524 metabolites) after the intake of milk and yogurt, 13% (231 metabolites) after the intake of milk only, and 9% (151 metabolites) after the intake of yogurt only. The remaining metabolites (49%, 879 metabolites) did not display significant postprandial kinetics.
The 906 metabolites presenting a significant postprandial kinetic response were then used to build an OPLS-DA model to differentiate postprandial serum after milk intake from postprandial serum after yogurt intake. The model was shown to be reliable (R2Y = 0.97, Q2 = 0.74) with a clear separation between the 2 treatments (Figure 3B and Supplemental Figure 3). Based on VIPtot scores and P values, 282 metabolites (31%) were selected as discriminant, i.e., presenting a different postprandial response depending on whether milk or yogurt was ingested (VIPtot > 1 or P < 0.05). Figure 5 shows the postprandial kinetics of these 282 serum metabolites after the intake of milk and yogurt. Further details regarding their retention times, neutral masses, adducts, and identification suggestions are given in Supplemental Table 3. Hierarchical clustering analysis could distinguish 5 main groups of metabolites. Two hundred and thirty-six metabolites increased postprandially (clusters 1, 2, 4, and 5), including 116 with a higher response after yogurt intake (clusters 1, 2, and a few of cluster 4). A group of 46 features decreased postprandially (cluster 3), the decrease of these metabolites being less pronounced after yogurt intake with a return to baseline concentrations after 6 h. The Kolmogorov-Smirnov distribution test on mass distributions showed that the metabolites having a higher response after yogurt intake (clusters 1 and 2) had a significantly lower mass distribution than the metabolites having a higher response after milk intake (clusters 4 and 5) (m/z, P = 4.41 × 10⁻⁶, Figure 4B).
FIGURE 5.

Serum metabolites discriminant for the postprandial response after milk or yogurt intake in healthy men, clustered by postprandial kinetics. Clustering by Spearman's distance measure and Ward linkage. Five main clusters are identified. Metabolites with higher serum concentrations after milk intake or after yogurt intake are identified for the postprandial test (800 g intake, iAUC) and fasting after 2 wk of daily intake (400 g/d). *OPLS-DA VIPtot > 1 or P < 0.05. A.U., arbitrary units; iAUC, incremental AUC; OPLS-DA, orthogonal projections to latent structures discriminant analysis; VIPtot, variable importance in projection for the predictive and orthogonal components.
Fasting serum metabolomes after 2 wk of daily intake: general trends
Of the 1785 metabolites detected in serum, 185 (10%) were changed in fasting samples assessed after the 2-wk daily intake of milk and/or yogurt (paired Wilcoxon’s signed rank test, P < 0.05). The 185 metabolites were then used to build an OPLS-DA model in order to differentiate fasting serum assessed after 2 wk of daily intake of milk from that assessed after 2 wk of daily intake of yogurt. The resulting model could separate the 2 groups of samples with a goodness-of-fit parameter R2Y = 0.97 and a predictive ability parameter Q2 = 0.56, slightly over the recommended threshold (Q2 > 0.50) (31) (Figure 3C and Supplemental Figure 4). As expected, the differentiation of fasting serum was less marked than that of the postprandial serum.
Based on VIPtot scores, 81 metabolites were selected as discriminant for fasting serum samples (VIPtot > 1). Among them, 31 metabolites were also discriminant for postprandial serum samples (VIPtot > 1, both postprandially and fasting); their distribution in the 5 postprandial kinetic clusters and their direction of change under fasting conditions are indicated in Figure 5. Interestingly, 29 had a postprandial behavior that matched their concentration in fasting serum; i.e., when their serum concentrations were higher postprandially after yogurt intake, they remained higher in fasting serum after 2 wk of yogurt intake, and similarly for milk intake. In total, 36% of the changes observed in the fasting serum metabolome after 2 wk of daily intake of dairy could already be observed during the postprandial test.
Identification
Discriminatory metabolites were submitted to a multistep identification procedure, including database searching, collision-induced fragmentation, and the injection of standards. The identities of 18 discriminant features were confirmed with the injection of a standard and, if necessary, additional fragmentation pattern analysis. Identified discriminatory metabolites are listed in Table 1 with additional information concerning their concentrations in the test products and serum. Among the identified features, GDL and its hydrolyzed form, gluconic acid, were the most discriminatory metabolites of the postprandial response to dairy products (Supplemental Figure 5A, cluster 4 in Figure 5). As explained, GDL was purposely added to milk for acidification and texture modification. GDL and gluconic acid were rapidly absorbed after milk ingestion with maximum concentrations being reached by 3 h and remaining higher than baseline concentrations after 6 h. Interestingly, concentrations of both GDL and gluconic acid remained higher in fasting serum after 2 wk of daily intake of acidified milk compared to yogurt intake (VIPtot = 1.12, VIPtot_CI < 1 for both metabolites). OPLS-DA models were also tested without GDL and gluconic acid since GDL was purposely added to the milk, but the outcomes remained unchanged.
TABLE 1.
Identified serum metabolites discriminant for the postprandial response after milk or yogurt intake in healthy men1
| Retention time (min)_Adduct mass (Da/charge) | Measured neutral mass (Da) | Identification | PubChem CID | Adducts | Identification method2 | Product with the highest content | Product causing the highest postprandial response | Postprandial kinetic cluster | Product causing the highest fasting serum concentration after 2 wk of daily intake |
|---|---|---|---|---|---|---|---|---|---|
| 1.11_219.0470 | 196.0578 | Gluconic acid | 10,690 | .+H; +Na | 1,2,4 | Milk* | Milk* | 4 | Milk* |
| 1.11_179.0550 | 178.0478 | Δ-Gluconolactone | 736 | .+H | 1,4 | Milk* | Milk* | 4 | Milk* |
| 1.16_138.0528 | 115.0636 | Proline | 145,742 | .+H; .+Na; +2Na-H; .x2+H; .x2+Na | 1,4 | Milk* | Yogurt* | 1 | Yogurt |
| 0.92_147.1123 | 146.1051 | Lysine | 5962 | .+H; .+Na; .+2Na-H; .+H-H2O | 1,4 | Yogurt* | Yogurt* | 2 | Yogurt |
| 1.06_164.0290 | 119.0578 | Threonine | 6288 | .+H; .+2Na-H; .+Na | 1,4 | Milk | Yogurt* | 2 | Yogurt |
| 3.43_166.0861 | 165.0789 | Phenylalanine | 6140 | .+H; .x2+H | 1,4 | Yogurt* | Yogurt* | 2 | Milk |
| 1.28_174.0868 | 132.0534 | Asparagine | 6267 | .+ACN+H; .+Na; .+H-H2O | 1,4 | nd | Yogurt* | 4 | Milk |
| 2.31_182.0807 | 181.0734 | Tyrosine | 6057 | .+H; .+Na | 1,4 | Yogurt* | Yogurt* | 2 | Milk |
| 4.23_205.0972 | 204.0899 | Tryptophan | 6305 | .+H; .+Na | 1,2,3,4 | Yogurt* | Yogurt | — | Milk |
| 1.07_198.0846 | 175.0954 | Citrulline | 9750 | .+H; .+Na; +2Na-H | 1,4 | nd | Yogurt* | 1 | Yogurt |
| 1.07_126.0214 | 125.0142 | Taurine | 1123 | .+H; +2Na-H; .+Na; .+H-H2O | 1,4 | Yogurt | Milk* | 4 | Milk |
| 6.04_206.0807 | 205.0735 | Indole-3-lactic acid | 92,904 | .+H; .+Na | 1,2,3,4 | Yogurt* | Yogurt* | 1 | Yogurt |
| 6.04_160.0753 | 159.0680 | Indole-3-acetaldehyde | 800 | .+H | 1,2 | Yogurt* | Yogurt* | 1 | Yogurt |
| 6.67_176.0701 | 175.0629 | Indole-3-acetic acid | 802 | .+H; .+Na | 1,2,3,4 | nd | Milk* | 5 | Milk |
| 7.26_190.0858 | 189.0785 | 3-Indole propionic acid | 3744 | .+H; .+Na; .+H+H2O | 1,2,4 | nd | Milk* | 4 | Milk* |
| 9.91_375.2887 | 374.2814 | 3b-Hydroxy-5-cholenoic acid | 92,997 | .+H; .+H-H2O; .+H-2H2O | 1,2,3,4 | nd | Milk* | 5 | Yogurt |
| 10.10_434.3256 | 392.2920 | (cheno)Deoxycholic acid | 222,528 | .+H; .+Na; .+NH4; .+H-H2O; .+H-2H2O; .x2+H | 1,2,3,4 | nd | Milk* | 5 | Yogurt |
| 8.46_450.3205 | 449.3132 | Glycoursodeoxycholic acid | 12,310,288 | .+H; .+NH4; .+Na; .x2+H; .x2+Na; .x2+NH4; .+H-H2O; .+H-2H2O | 1,2 | nd | Milk* | 5 | Milk |
| 7.40_483.3415 | 465.3077 | Glycocholic acid | 10,140 | .+H; .+NH4; .+Na; .+H-H2O; .+H-2H2O | 1,2,4 | nd | Milk* | 5 | Yogurt |
| 9.51_500.3028 | 499.2956 | Tauroursodeoxycholic acid | 9,848,818 | .+H; .+H-H2O; .+H-2H2O | 1,2,3,4 | nd | Milk* | 5 | Milk |
1*OPLS-DA VIPtot score > 1 or P < 0.05. CID, compound identifier; nd, not detected; OPLS-DA, orthogonal projections to latent structures discriminant analysis; VIPtot, variable importance in projection for the predictive and orthogonal components.
2Identification methods: 1, mass database; 2, theoretical fragmentation; 3, fragment database; 4, standard injection.
A group of 7 metabolites were identified as free amino acids. Their influence on the OPLS-DA model appeared to be limited (VIPtot > 1, VIPtot_CI < 1, Supplemental Table 3); however, all of these metabolites showed a postprandial increase, with a higher response after yogurt intake (Table 1, Supplemental Figure 5A–C). The essential amino acids that were identified (threonine, lysine, and phenylalanine), as well as tyrosine that is derived from phenylalanine, were grouped in cluster 2, with a rapid increase (maximum serum concentration at 1 h) and a return to baseline value after 4 h. On the other hand, asparagine showed a slower increase (maximum serum concentration at 3 h) and returned to baseline at 6 h (cluster 4). Most of the postprandial concentrations of the amino acids were in accordance with their contents in the test products. This was the case for lysine, phenylalanine, asparagine, and tyrosine, which were present at higher concentrations in yogurt compared with milk. The metabolite identified as taurine presented higher postprandial concentrations after milk intake. A significant increase in free tryptophan was observed in postprandial serum after milk and yogurt intake (nparLD P = 2.26 × 10⁻⁷ and 5.08 × 10⁻¹², respectively). However, there was no marked difference between the 2 treatments (VIPtot = 0.34) despite the higher tryptophan content in yogurt compared with milk (Table 1, Supplemental Figure 5C).
Conversely, a clear difference was seen postprandially for indole compounds that are products of tryptophan metabolism. Indole-3-lactic acid (ILA), indole-3-acetaldehyde (IAAld), indole-3-acetic acid (IAA), and 3-indole propionic acid (IPA) were among the most discriminatory metabolites postprandially, although with very different kinetic behaviors (Supplemental Figure 5E). ILA and IAAld clearly discriminated yogurt intake from milk intake. The differences observed between the products (higher concentration in yogurt) were also visible in postprandial serum (rapid increase after yogurt intake). Conversely, IPA could not be detected in either milk or yogurt. A significant postprandial increase was observed during the 6 h after milk intake (nparLD P = 9.61 × 10⁻⁶), whereas no significant postprandial response could be observed after yogurt intake (nparLD P > 0.05). The postprandial difference for IPA between milk and yogurt intake (VIPtot = 1.47, VIPtot_CI < 1) was also apparent in fasting serum (VIPtot = 1.32, VIPtot_CI < 1). IAA showed a significant postprandial increase after milk intake (nparLD P = 1.72 × 10⁻³) with a return to baseline after 6 h whereas a continuous decrease from 60 min to 6 h was observed after yogurt intake (nparLD P = 6.12 × 10⁻⁹). IAA showed some discrimination for postprandial serum (VIPtot = 1.62, VIPtot_CI < 1) and was not discriminating for fasting serum after daily intake of yogurt and milk.
Among the most discriminant identified features with a significant response after milk or yogurt intake, 5 metabolites were identified as BAs (Supplemental Figure 5C, D). All the identified BAs presented a postprandial increase and were classified in cluster 5 with maximum concentrations between 60 and 180 min. In each case, the postprandial increase was lower after yogurt intake (Table 1). This difference was particularly marked for tauroursodeoxycholic acid and 3b-hydroxy-5-cholenoic acid (VIPtot = 2.01 and 2.19, respectively, VIPtot_CI > 1). However, this effect of yogurt intake appeared to be transitory since no difference could be seen in fasting serum after 2 wk of daily intake.
Discussion
Through the use of an untargeted LC-MS–based metabolomics approach, our study has characterized the metabolic footprint of fermentation, not only in the dairy metabolome but also in the serum metabolome after acute or short-term (2-wk) intake of milk and yogurt.
Products metabolome
Our comparative evaluation of milk and yogurt has shown a complexification of the milk metabolome during fermentation. There is little research that describes the milk fermentation process with the use of untargeted metabolomics. Among the existing studies in this field, free amino acids, peptides, and volatile compounds are the most frequently reported metabolites that are released in yogurt (35, 36), cheese (37), and various fermented milks (38). Our study indicates that globally, milk metabolites used by LAB during fermentation have a smaller mass than metabolites subsequently released in yogurt. This difference would reflect the presence in yogurt of oligopeptides from caseins hydrolysis (higher concentrations of low molecular weight peptides, Supplemental Table 2), of oligosaccharides (from bacterial exopolysaccharides) (39), or of other complex metabolites constitutive of the biomass (40). However, the results of such comparisons between products highly depend on the analytical method used. In our case, the removal of phospholipids and the use of the positive ionization mode might have influenced these results.
Postprandial serum metabolome: general trends
We have also shown that, despite milk and yogurt being similar in their composition, and despite the generic effects of digestion and intestinal transport on the macronutrients present in these products, the acute ingestion of milk or yogurt resulted in 2 different postprandial serum metabolic profiles, with 16% of the serum metabolome responding differently. The effect of yogurt intake on the serum metabolome was not limited to the exogenous metabolites that were absorbed from the food but also included changes relating to endogenous metabolic pathways, hence the variety of kinetics profiles observed among the discriminatory metabolites (Figure 5). It appeared that serum metabolites specific to yogurt intake (i.e., metabolites with a greater postprandial increase after yogurt intake) had a significantly lower mass compared with metabolites specific to milk intake. Such differences in mass distribution could be due to the presence in yogurt of fermentation products derived from LAB activity, such as volatile compounds (e.g., SCFAs) (35, 41), oligonucleotides (42), or free amino acids, and also to the fact that yogurt components of higher mass did not reach the circulation.
Amino acids
Native milk proteins have been described as a good source of free amino acids with respect to plant-derived proteins (43) and essential amino acids were shown to be preferentially released during milk in vitro digestion (44). Milk-derived free amino acids have been discussed in the context of postprandial skeletal muscle protein synthesis, after resistance exercise (45) and in elderly populations that exhibit low skeletal muscle mass (sarcopenia) (46). In this study, higher postprandial concentrations of 7 free amino acids were observed after yogurt intake with respect to milk intake, 3 being essential (phenylalanine, threonine, and lysine). These differences could be related to the prior hydrolysis of milk proteins during fermentation (Supplemental Table 2), with similar trends observed in postprandial urine after cheese intake compared with milk intake (25). Prior fermentation might therefore be considered as a means to increase circulating free amino acids after dairy intake. However, as suggested by the kinetics profiles (Supplemental Figure 5A–C), the differences in postprandial free amino acids between milk and yogurt intake appeared to be rather limited in intensity and in time (returning to baseline values after 4–6 h), which might explain why they were no longer discriminant in fasting serum after 2 wk of the daily interventions.
Indole derivatives
Indole compounds are known products of microbial metabolism of tryptophan via the “indole pathway”. In the present study, probably owing to the proteolytic activity of LAB during fermentation, we report higher concentrations of free tryptophan in yogurt compared with milk. The subsequent use of free tryptophan by LAB during fermentation (47) explains the higher concentrations of ILA and IAAld in yogurt, resulting in higher postprandial serum concentrations after yogurt intake. In humans, ILA being an end-product of the tryptophan metabolic pathway (48), it is likely to accumulate in serum postprandially. In accordance with our observation, an increase in postprandial ILA has been reported in plasma after the ingestion of different whey protein fractions, the ILA concentrations positively correlating with the tryptophan content in the different fractions (49).
The use of dietary free tryptophan by the microbiota and the subsequent release of indole derivatives reaching the blood could also contribute to the presence of indole derivatives in postprandial serum. Such mechanisms have only been described in rodents to date (50, 51). Under high-tryptophan conditions, as is the case in our study after yogurt intake, a 2-fold increase in tryptophanase activity has been reported in murine microbiota, tryptophanase being a key enzyme in the indole pathway (52). Moreover, as described by Zelante et al. (51), in unrestricted tryptophan conditions intestinal lactobacilli favor tryptophan as a source of energy over carbohydrates. It is then likely that the excess in tryptophan provided by the yogurt is directly metabolized by the intestinal microbiota, especially via the indole pathway (51, 53).
As IPA and IAA were not detected in either milk or yogurt, their presence in postprandial serum could be of intestinal microbiota origin. IPA has been reported as being produced in the intestine specifically by Clostridium sporogenes (50, 54). Furthermore, a similar increase in IPA during the late postprandial phase has been previously described after the intake of 500 mL dairy shake (55). The lower IPA and IAA concentrations reached in blood after yogurt intake may appear to be contradictory considering the higher tryptophan content in yogurt. However, in a human intervention study investigating protein intake and tryptophan metabolites, no correlation could be observed between plasma tryptophan and plasma IAA, and in mice plasma IAA was lowered after a high-protein diet (56). The interactions of the microbiota with foods make any mechanistic explanation even more complex. For example, yogurt bacterial species have been shown to inhibit C. sporogenes growth (57) and its adhesion to intestinal epithelial cells (58), which could result in a lower intestinal production of IPA. Other mechanisms, such as the binding to the aryl hydrocarbon receptor (AhR) (59) or enzymatic degradation in the circulation, may also contribute to the postprandial responses observed here.
Indole derivatives have recently been investigated for their role on the epithelial barrier function and gut inflammatory homeostasis via their activation of the AhR signaling pathway, IAA and IAAld being ligands for this receptor (51, 54, 59, 60). Strikingly, the whole blood transcriptomic analysis of our postprandial samples independently identified the gene coding for AhR among the top genes showing significant change after yogurt intake (61).
BAs
Primary BAs are synthesized in the liver and are conjugated to glycine and taurine before excretion in the duodenum. The influence of the intestinal microbiota on the pool size and composition of BAs is well documented (62) and mainly relies on the expression of bile salt hydrolase (BSH) by colonic bacteria, hydrolyzed BAs being less efficiently reabsorbed into the enterohepatic recirculation (63–66). Consequently, dietary probiotics have been tested to modulate metabolism of BAs, with the aim of influencing the host metabolism including cholesterol and TG pathways (65). As a result, BSH activity has been proposed as a requirement for probiotic organisms (67). The presence of the BSH gene in the genome of LGG (LRHM_0484) and the known BSH activity of S. thermophilus and L. delbrueckii ssp. bulgaricus (68) could explain the lower postprandial concentrations observed here after yogurt intake. In addition, all 3 yogurt strains have the capacity to survive in the gastrointestinal tract after ingestion (22, 69). Furthermore, it is worth noting that taurine, which is used in the liver for de novo BA synthesis, tends to have a lower postprandial response after yogurt intake compared with milk intake. However, this change in serum BAs appeared to be transitory as no difference was observed in fasting serum after daily intake. In contrast, other intervention studies have reported an increase in circulating BA (conjugated or unconjugated) after chronic intake of the BSH-active Lactobacillus reuteri (70, 71). These studies do however differ in important aspects of study design, including mode of administration (capsules), choice of probiotic strains, as well as the duration of the studies (up to 6 wk). Interestingly, our group of discriminant BAs included conjugated (glycoursodeoxycholic acid) and unconjugated [(cheno)deoxycholic acid] BAs, as well as a primary BA synthesized by the liver (3b-hydroxy-5-cholenoic acid) and a secondary BA of microbial origin (glycocholic acid), reflecting the complexity of the mechanisms behind the regulation of BA metabolism.
Fasting metabolome after 2 wk of daily intake: general trends
Interestingly, more than a third of the changes detected in fasting assessments after 2 wk were already visible postprandially. Although most of the identities of these metabolites are not yet confirmed, these results nevertheless give an estimation of the ability of acute postprandial studies to predict changes that are likely to occur after chronic intake. The postprandial phase is generally less frequently studied in nutritional interventions, which tend to focus on fasting measurements after semichronic or chronic intake to identify long-term effects (16, 19, 21, 72). However, considering the typical meal frequency in Western countries, most individuals are in a postprandial state during the day and, therefore, looking at the postprandial phase may also help to identify dietary biomarkers as well as to understand the mechanisms underpinning long-term effects of diet.
Conclusion
To conclude, we firstly observed that milk and yogurt still share most of their metabolites. Nonetheless, fermentation left an identifiable footprint on the product metabolome, and more importantly, on the serum metabolome, postprandially after acute intake, as well as fasting after short-term daily intake. The postprandial modulation of circulating amino acids, indole derivatives, and BAs suggests that the metabolic footprint of fermented dairy intake does not only consist in the absorption of metabolites from the product, but also in the regulation of the endogenous metabolic activity, notably that of the intestinal microbiota. Such metabolites could be used as targets in observational studies to identify potential benefits of fermented dairy products on cholesterol and TG concentrations through the modulation of BAs, or on inflammatory status through the AhR signaling pathway. Moreover, assessing the expression of genes involved in these pathways could identify the molecular targets modulated by these metabolites as well as clarify the mechanisms underlying such effects. Finally, compounds like indole derivatives might be considered as biomarkers of fermented dairy intake in observational studies, with the limitation that other nondairy fermented food can also be a source of such metabolites [kimchi, sauerkraut, or pickles (73)].
Supplementary Material
Acknowledgments
We acknowledge Marie-Jeanne Voirol for her help in the clinical study, Charlotte Egger for the biochemical analyses of the dairy products, and Nadine Zangger for her help in data preprocessing.
The authors’ contributions were as follows—GP, KJB, UvA, NV, FPP, and GV: designed the study; GP, UvA, and RP: analyzed the data; GP and UB: performed the statistical analysis; GP, KJB, and GV: wrote the article; GP and GV: had primary responsibility for final content; and all authors: read and approved the final manuscript.
Notes
This research did not receive any specific grant from funding agencies in the public, commercial, or not-for-profit sectors.
Author disclosures: GP, KJB, UvA, UB, FPP, NV, RP, and GV, no conflicts of interest.
Supplemental Methods, Supplemental Tables 1–3, and Supplemental Figures 1–5 are available from the “Supplementary data” link in the online posting of the article and from the same link in the online table of contents at https://academic.oup.com/jn/.
Abbreviations used: AhR, aryl hydrocarbon receptor; BA, bile acid; BSH, bile salt hydrolase; GDL, glucono-δ-lactone; IAA, indole-3-acetic acid; IAAld, indole-3-acetaldehyde; ILA, indole-3-lactic acid; IPA, 3-indole propionic acid; LAB, lactic acid bacteria; LGG, Lactobacillus rhamnosus Gorbach-Goldin; nparLD, nonparametric analysis of longitudinal data; OPLS-DA, orthogonal projections to latent structures discriminant analysis; QC, quality control sample; Q2, predictive ability parameter; R2Y, goodness-of-fit parameter; VIP, variable importance in projection; VIPtot_CI, 95% confidence interval for VIPtot.
References
- 1. Curry A. Archaeology: the milk revolution. Nature 2013;500:20. [DOI] [PubMed] [Google Scholar]
- 2. USDA Economic Research Service 2015 dairy data [Internet]. [cited 2017 March 19]. Available from: https://www.ers.usda.gov/data-products/dairy-data. [Google Scholar]
- 3. Burgess K. Milk and dairy products in human nutrition (2013), by Muehlhoff E., Bennett A. and McMahon D., Food and Agriculture Organisation of the United Nations (FAO), Rome. E-ISBN: 978-92-5-107864-8 (PDF). Available on web-site (publications-sales@fao.org) Int J Dairy Technol 2014;67:303–4. [Google Scholar]
- 4. Metchnikoff E, Mitchell PC. The prolongation of life; optimistic studies. New York & London: G.P. Putnam's Sons; 1908. [Google Scholar]
- 5. Adolfsson O, Meydani SN, Russell RM. Yogurt and gut function. Am J Clin Nutr 2004;80:245–56. [DOI] [PubMed] [Google Scholar]
- 6. Astrup A. Yogurt and dairy product consumption to prevent cardiometabolic diseases: epidemiologic and experimental studies. Am J Clin Nutr 2014;99:1235s–42s. [DOI] [PubMed] [Google Scholar]
- 7. Cormier H, Thifault E, Garneau V, Tremblay A, Drapeau V, Perusse L, Vohl MC. Association between yogurt consumption, dietary patterns, and cardio-metabolic risk factors. Eur J Nutr 2016;55:577–87. [DOI] [PubMed] [Google Scholar]
- 8. Collomb M, Schmid A, Sieber R, Wechsler D, Ryhänen E-L. Conjugated linoleic acids in milk fat: variation and physiological effects. Int Dairy J 2006;16:1347–61. [Google Scholar]
- 9. Beermann C, Hartung J. Physiological properties of milk ingredients released by fermentation. Food Funct 2013;4:185–99. [DOI] [PubMed] [Google Scholar]
- 10. Boutrou R, Gaudichon C, Dupont D, Jardin J, Airinei G, Marsset-Baglieri A, Benamouzig R, Tome D, Leonil J. Sequential release of milk protein-derived bioactive peptides in the jejunum in healthy humans. Am J Clin Nutr 2013;97:1314–23. [DOI] [PubMed] [Google Scholar]
- 11. Choi J, Sabikhi L, Hassan A, Anand S. Bioactive peptides in dairy products. Int J Dairy Technol 2012;65:1–12. [Google Scholar]
- 12. Marco ML, Heeney D, Binda S, Cifelli CJ, Cotter PD, Foligné B, Gänzle M, Kort R, Pasin G, Pihlanto A et al. . Health benefits of fermented foods: microbiota and beyond. Curr Opin Biotechnol 2017;44:94–102. [DOI] [PubMed] [Google Scholar]
- 13. Gibney MJ, Walsh M, Brennan L, Roche HM, German B, van Ommen B. Metabolomics in human nutrition: opportunities and challenges. Am J Clin Nutr 2005;82:497–503. [DOI] [PubMed] [Google Scholar]
- 14. Llorach R, Garcia-Aloy M, Tulipani S, Vazquez-Fresno R, Andres-Lacueva C. Nutrimetabolomic strategies to develop new biomarkers of intake and health effects. J Agric Food Chem 2012;60:8797–808. [DOI] [PubMed] [Google Scholar]
- 15. Wishart DS. Metabolomics: applications to food science and nutrition research. Trends Food Sci Technol 2008;19:482–93. [Google Scholar]
- 16. Hong Y-S, Hong KS, Park M-H, Ahn Y-T, Lee J-H, Huh C-S, Lee J, Kim I-K, Hwang G-S, Kim JS. Metabonomic understanding of probiotic effects in humans with irritable bowel syndrome. J Clin Gastroenterol 2011;45:415–25. [DOI] [PubMed] [Google Scholar]
- 17. Kekkonen R-A, Sysi-Aho M, Seppanen-Laakso T, Julkunen I, Vapaatalo H, Oresic M, Korpela R. Effect of probiotic Lactobacillus rhamnosus GG intervention on global serum lipidomic profiles in healthy adults. World J Gastroenterol 2008;14:3188–94. [DOI] [PMC free article] [PubMed] [Google Scholar]
- 18. Lahti L, Salonen A, Kekkonen RA, Salojarvi J, Jalanka-Tuovinen J, Palva A, Oresic M, de Vos WM. Associations between the human intestinal microbiota, Lactobacillus rhamnosus GG and serum lipids indicated by integrated analysis of high-throughput profiling data. PeerJ 2013;1:e32. [DOI] [PMC free article] [PubMed] [Google Scholar]
- 19. Pedersen SMM, Nielsen NC, Andersen HJ, Olsson J, Simrén M, Öhman L, Svensson U, Malmendal A, Bertram HC. The serum metabolite response to diet intervention with probiotic acidified milk in irritable bowel syndrome patients is indistinguishable from that of non-probiotic acidified milk by 1H NMR-based metabonomic analysis. Nutrients 2010;2:1141–55. [DOI] [PMC free article] [PubMed] [Google Scholar]
- 20. Zheng H, Clausen MR, Dalsgaard TK, Bertram HC. Metabolomics to explore impact of dairy intake. Nutrients 2015;7:4875–96. [DOI] [PMC free article] [PubMed] [Google Scholar]
- 21. Zheng H, Yde CC, Clausen MR, Kristensen M, Lorenzen J, Astrup A, Bertram HC. Metabolomics investigation to shed light on cheese as a possible piece in the French paradox puzzle. J Agric Food Chem 2015;63:2830–9. [DOI] [PubMed] [Google Scholar]
- 22. Burton KJ, Rosikiewicz M, Pimentel G, Bütikofer U, von Ah U, Voirol M-J, Croxatto A, Aeby S, Drai J, McTernan PG et al. . Probiotic yogurt and acidified milk similarly reduce postprandial inflammation and both alter the gut microbiota of healthy, young men. Br J Nutr 2017;117:1312–22. [DOI] [PubMed] [Google Scholar]
- 23. Chr. Hansen A/S Study summaries LGG2017[Internet]. [cited 2017 October 8]. Available from: http://www.webcitation.org/6u45JUZcR. [Google Scholar]
- 24. Sanggaard KM, Holst JJ, Rehfeld JF, Sandström B, Raben A, Tholstrup T. Different effects of whole milk and a fermented milk with the same fat and lactose content on gastric emptying and postprandial lipaemia, but not on glycaemic response and appetite. Br J Nutr 2004;92:447–59. [DOI] [PubMed] [Google Scholar]
- 25. Münger LH, Trimigno A, Picone G, Freiburghaus C, Pimentel G, Burton KJ, Pralong FP, Vionnet N, Capozzi F, Badertscher R et al. . Identification of urinary food intake biomarkers for milk, cheese, and soy-based drink by untargeted GC-MS and NMR in healthy humans. J Proteome Res 2017;16:3321–35. [DOI] [PubMed] [Google Scholar]
- 26. Calderón-Santiago M, Fernández-Peralbo MA, Priego-Capote F, Luque de Castro MD. MSCombine: a tool for merging untargeted metabolomic data from high-resolution mass spectrometry in the positive and negative ionization modes. Metabolomics 2016;12:43. [Google Scholar]
- 27. Wishart DS, Feunang YD, Marcu A, Guo AC, Liang K, Vazquez-Fresno R, Sajed T, Johnson D, Li C, Karu N et al. . HMDB 4.0: the human metabolome database for 2018. Nucleic Acids Res 2018;46:D608–D17. [DOI] [PMC free article] [PubMed] [Google Scholar]
- 28. MassBank of North America (MoNA) [Internet]. [cited 2016 October]. Available from: http://mona.fiehnlab.ucdavis.edu. [Google Scholar]
- 29. Smith CA, Maille GO, Want EJ, Qin C, Trauger SA, Brandon TR, Custodio DE, Abagyan R, Siuzdak G. Metlin: a metabolite mass spectral database. Ther Drug Monit 2005;27:747–51. [DOI] [PubMed] [Google Scholar]
- 30. Dunn WB, Broadhurst D, Begley P, Zelena E, Francis-McIntyre S, Anderson N, Brown M, Knowles JD, Halsall A, Haselden JN et al. . Procedures for large-scale metabolic profiling of serum and plasma using gas chromatography and liquid chromatography coupled to mass spectrometry. Nat Protoc 2011;6:1060–83. [DOI] [PubMed] [Google Scholar]
- 31. Noguchi K, Gel Y, Brunner E, Konietschke F. nparLD: an R software package for the nonparametric analysis of longitudinal data in factorial experiments. J Stat Soft 2012;50:1–23. [Google Scholar]
- 32. Triba MN, Le Moyec L, Amathieu R, Goossens C, Bouchemal N, Nahon P, Rutledge DN, Savarin P. PLS/OPLS models in metabolomics: the impact of permutation of dataset rows on the K-fold cross-validation quality parameters. Mol Biosyst 2015;11:13–19. [DOI] [PubMed] [Google Scholar]
- 33. Galindo-Prieto B, Eriksson L, Trygg J. Variable influence on projection (VIP) for orthogonal projections to latent structures (OPLS). J Chemometrics 2014;28:623–32. [Google Scholar]
- 34. Thévenot EA, Roux A, Xu Y, Ezan E, Junot C. Analysis of the human adult urinary metabolome variations with age, body mass index, and gender by implementing a comprehensive workflow for univariate and OPLS statistical analyses. J Proteome Res 2015;14:3322–35. [DOI] [PubMed] [Google Scholar]
- 35. Cheng H. Volatile flavor compounds in yogurt: a review. Crit Rev Food Sci Nutr 2010;50:938–50. [DOI] [PubMed] [Google Scholar]
- 36. Settachaimongkon S, Nout MJR, Antunes Fernandes EC, van Hooijdonk TCM, Zwietering MH, Smid EJ, van Valenberg HJF. The impact of selected strains of probiotic bacteria on metabolite formation in set yoghurt. Int Dairy J 2014;38:1–10. [Google Scholar]
- 37. Le Boucher C, Courant F, Jeanson S, Chereau S, Maillard M-B, Royer A-L, Thierry A, Dervilly-Pinel G, Le Bizec B, Lortal S. First mass spectrometry metabolic fingerprinting of bacterial metabolism in a model cheese. Food Chem 2013;141:1032–40. [DOI] [PubMed] [Google Scholar]
- 38. de Bok FAM, Janssen PWM, Bayjanov JR, Sieuwerts S, Lommen A, van Hylckama Vlieg JET, Molenaar D. Volatile compound fingerprinting of mixed-culture fermentations. Appl Environ Microbiol 2011;77:6233–9. [DOI] [PMC free article] [PubMed] [Google Scholar]
- 39. Cerning J. Production of exopolysaccharides by lactic acid bacteria and dairy propionibacteria. Le Lait 1995;75:463–72. [Google Scholar]
- 40. Chandan RC, O'Rell KR. Principles of yogurt processing. In: Chandan RC, Kilara A, editors. Manufacturing yogurt and fermented milks. Oxford: Blackwell Publishing; 2007. p. 195–210. [Google Scholar]
- 41. Rizkalla SW, Luo J, Kabir M, Chevalier A, Pacher N, Slama G. Chronic consumption of fresh but not heated yogurt improves breath-hydrogen status and short-chain fatty acid profiles: a controlled study in healthy men with or without lactose maldigestion. Am J Clin Nutr 2000;72:1474–9. [DOI] [PubMed] [Google Scholar]
- 42. Urbiene S, Leskauskaite D. Formation of some organic acids during fermentation of milk. Pol J Food Nutr Sci 2006;15:277–81. [Google Scholar]
- 43. van Vliet S, Burd NA, van Loon LJC. The skeletal muscle anabolic response to plant- versus animal-based protein consumption. J Nutr 2015;145:1981–91. [DOI] [PubMed] [Google Scholar]
- 44. Kopf-Bolanz KA, Schwander F, Gijs M, Vergères G, Portmann R, Egger L. Validation of an in vitro digestive system for studying macronutrient decomposition in humans. J Nutr 2012;142:245–50. [DOI] [PubMed] [Google Scholar]
- 45. Wilkinson SB, Tarnopolsky MA, MacDonald MJ, MacDonald JR, Armstrong D, Phillips SM. Consumption of fluid skim milk promotes greater muscle protein accretion after resistance exercise than does consumption of an isonitrogenous and isoenergetic soy-protein beverage. Am J Clin Nutr 2007;85:1031–40. [DOI] [PubMed] [Google Scholar]
- 46. Yanai H. Nutrition for sarcopenia. J Clin Med Res 2015;7:926–31. [DOI] [PMC free article] [PubMed] [Google Scholar]
- 47. Gummalla S, Broadbent JR. Tryptophan catabolism by Lactobacillus casei and Lactobacillus helveticus cheese flavor adjuncts. J Dairy Sci 1999;82:2070–7. [DOI] [PubMed] [Google Scholar]
- 48. Kanehisa M, Goto S. KEGG: Kyoto Encyclopedia of Genes and Genomes. Nucleic Acids Res 2000;28:27–30. [DOI] [PMC free article] [PubMed] [Google Scholar]
- 49. Stanstrup J, Rasmussen JE, Ritz C, Holmer-Jensen J, Hermansen K, Dragsted LO. Intakes of whey protein hydrolysate and whole whey proteins are discriminated by LC–MS metabolomics. Metabolomics 2014;10:719–36. [Google Scholar]
- 50. Wikoff WR, Anfora AT, Liu J, Schultz PG, Lesley SA, Peters EC, Siuzdak G. Metabolomics analysis reveals large effects of gut microflora on mammalian blood metabolites. Proc Natl Acad Sci USA 2009;106:3698–703. [DOI] [PMC free article] [PubMed] [Google Scholar]
- 51. Zelante T, Iannitti RG, Cunha C, De Luca A, Giovannini G, Pieraccini G, Zecchi R, D'Angelo C, Massi-Benedetti C, Fallarino F et al. . Tryptophan catabolites from microbiota engage aryl hydrocarbon receptor and balance mucosal reactivity via interleukin-22. Immunity 2013;39:372–85. [DOI] [PubMed] [Google Scholar]
- 52. Botsford JL, Demoss RD. Escherichia coli tryptophanase in the enteric environment. J Bacteriol 1972;109:74–80. [DOI] [PMC free article] [PubMed] [Google Scholar]
- 53. Aragozzini F, Ferrari A, Pacini N, Gualandris R. Indole-3-lactic acid as a tryptophan metabolite produced by Bifidobacterium spp. Appl Environ Microbiol 1979;38:544–6. [DOI] [PMC free article] [PubMed] [Google Scholar]
- 54. Dodd D, Spitzer MH, Van Treuren W, Merrill BD, Hryckowian AJ, Higginbottom SK, Le A, Cowan TM, Nolan GP, Fischbach MA et al. . A gut bacterial pathway metabolizes aromatic amino acids into nine circulating metabolites. Nature 2017;551:648–52. [DOI] [PMC free article] [PubMed] [Google Scholar]
- 55. Pellis L, van Erk MJ, van Ommen B, Bakker GCM, Hendriks HFJ, Cnubben NHP, Kleemann R, van Someren EP, Bobeldijk I, Rubingh CM et al. . Plasma metabolomics and proteomics profiling after a postprandial challenge reveal subtle diet effects on human metabolic status. Metabolomics 2012;8:347–59. [DOI] [PMC free article] [PubMed] [Google Scholar]
- 56. Poesen R, Mutsaers HA, Windey K, van den Broek PH, Verweij V, Augustijns P, Kuypers D, Jansen J, Evenepoel P, Verbeke K et al. . The influence of dietary protein intake on mammalian tryptophan and phenolic metabolites. PLoS One 2015;10:e0140820. [DOI] [PMC free article] [PubMed] [Google Scholar]
- 57. Carminati D, Perrone A, Neviani E. Inhibition of Clostridium sporogenes growth in mascarpone cheese by co-inoculation with Streptococcus thermophilus under conditions of temperature abuse. Food Microbiol 2001;6:571–9. [Google Scholar]
- 58. Ramiah K, van Reenen CA, Dicks LMT. Surface-bound proteins of Lactobacillus plantarum 423 that contribute to adhesion of Caco-2 cells and their role in competitive exclusion and displacement of Clostridium sporogenes and Enterococcus faecalis. Res Microbiol 2008;159:470–5. [DOI] [PubMed] [Google Scholar]
- 59. Quintana FJ, Sherr DH. Aryl hydrocarbon receptor control of adaptive immunity. Pharmacol Rev 2013;65:1148–61. [DOI] [PMC free article] [PubMed] [Google Scholar]
- 60. Marsland BJ. Regulating inflammation with microbial metabolites. Nat Med 2016;22:581–3. [DOI] [PubMed] [Google Scholar]
- 61. Burton KJ, Pimentel G, Zangger N, Vionnet N, Drai J, McTernan PG, Pralong FP, Delorenzi M, Vergères G. Modulation of the peripheral blood transcriptome by the ingestion of probiotic yoghurt and acidified milk in healthy, young men. PLoS One 2018;13:e0192947. [DOI] [PMC free article] [PubMed] [Google Scholar]
- 62. Ridlon JM, Kang D-J, Hylemon PB. Bile salt biotransformations by human intestinal bacteria. J Lipid Res 2006;47:241–59. [DOI] [PubMed] [Google Scholar]
- 63. Begley M, Hill C, Gahan CG. Bile salt hydrolase activity in probiotics. Appl Environ Microbiol 2006;72:1729–38. [DOI] [PMC free article] [PubMed] [Google Scholar]
- 64. Degirolamo C, Rainaldi S, Bovenga F, Murzilli S, Moschetta A. Microbiota modification with probiotics induces hepatic bile acid synthesis via downregulation of the Fxr-Fgf15 axis in mice. Cell Reports 2014;7:12–18. [DOI] [PubMed] [Google Scholar]
- 65. Li G. Intestinal probiotics: interactions with bile salts and reduction of cholesterol. Procedia Environ Sci 2012;12:1180–6. [Google Scholar]
- 66. Marteau P, Gerhardt MF, Myara A, Bouvier E, Trivin F, Rambaud JC. Metabolism of bile salts by alimentary bacteria during transit in the human small intestine. Microb Ecol Health Dis 1995;8:151–7. [Google Scholar]
- 67. Food and Agriculture Organization of the United Nations, World Health Organization . Probiotics in food: health and nutritional properties and guidelines for evaluation. Expert consultation. Cordoba, Argentina: FAO; 2001. Report No. 85. [Google Scholar]
- 68. Avcı GA. Bile salts deconjugation using microencapsulated lactic acid bacteria isolated from handmade yogurt. J Food Nutr Res 2014;2:340–3. [Google Scholar]
- 69. Elli M, Callegari ML, Ferrari S, Bessi E, Cattivelli D, Soldi S, Morelli L, Goupil Feuillerat N, Antoine J-M. Survival of yogurt bacteria in the human gut. Appl Environ Microbiol 2006;72:5113–17. [DOI] [PMC free article] [PubMed] [Google Scholar]
- 70. Martoni CJ, Labbe A, Ganopolsky JG, Prakash S, Jones ML. Changes in bile acids, FGF-19 and sterol absorption in response to bile salt hydrolase active L. reuteri NCIMB 30242. Gut Microbes 2015;6:57–65. [DOI] [PMC free article] [PubMed] [Google Scholar]
- 71. Mobini R, Tremaroli V, Stahlman M, Karlsson F, Levin M, Ljungberg M, Sohlin M, Berteus Forslund H, Perkins R, Backhed F et al. . Metabolic effects of Lactobacillus reuteri DSM 17938 in people with type 2 diabetes: a randomized controlled trial. Diabetes Obes Metab 2017;19:579–89. [DOI] [PubMed] [Google Scholar]
- 72. Kekkonen RA, Lummela N, Karjalainen H, Latvala S, Tynkkynen S, Järvenpää S, Kautiainen H, Julkunen I, Vapaatalo H, Korpela R. Probiotic intervention has strain-specific anti-inflammatory effects in healthy adults. World J Gastroenterol 2008;14:2029–36. [DOI] [PMC free article] [PubMed] [Google Scholar]
- 73. Patra JK, Das G, Paramithiotis S, Shin H-S. Kimchi and other widely consumed traditional fermented foods of Korea: a review. Front Microbiol 2016;7:1493. [DOI] [PMC free article] [PubMed] [Google Scholar]
Associated Data
This section collects any data citations, data availability statements, or supplementary materials included in this article.