Short abstract
Background
The development of an effective treatment for type 2 diabetes mellitus is urgently needed. This study aimed to investigate the role of micro RNA (miR)-323-3p in regulating the expression of adiponectin receptor 1 (AdipoR1), as well as the insulin secretion and cell function of pancreatic MIN6 β-cells.
Methods
MIN6 cells were treated with miR-323-3p mimics or inhibitors, and the effects on cell growth, proliferation, mitosis, and insulin secretion were studied. The expression levels of sirtuin-1 (SIRT-1) and AMP-activated protein kinase (AMPK) genes were also assessed.
Results
miR-323-3p directly targeted AdipoR1, and suppressed its expression at mRNA and protein levels. It also regulated the protein expression of SIRT-1 and AMPK, which are downstream target genes of the AdipoR1 signaling pathway. miR-323-3p suppressed cell growth, proliferation, mitosis, and insulin secretion of MIN6 cells.
Conclusions
miR-323-3p appears to be a crucial diabetes factor that mediates its functions by inhibiting the AdipoR1/AMPK/SIRT-1 signaling pathway. Our findings suggest that targeting AdipoR1 with inhibitors of miR-323-3p is a potential approach to improve the function of islet cells.
Keywords: microRNA, glucose metabolism, diabetes mellitus, MIN6 cell line, adiponectin receptor 1, sirtuin-1
Introduction
Diabetes mellitus (DM) is caused by dysfunctions of the endocrine system and metabolism.1 Worldwide, type 2 DM is a major chronic disease, and an important and rapidly growing public health problem associated with a range of complications.2 The prevalence of type 2 DM is predicted to increase to more than 7.5% of the global population by 2030.3 Therefore, efficacious medicines are urgently required for the treatment of type 2 DM and its associated diseases.
Growing evidence points to a key role of microRNAs (miRNAs) in regulating expression at the post-transcriptional level.4 miRNAs are small non-coding RNAs that regulate gene expression through matching 3′ untranslated regions (UTRs) of targeted mRNA, then controlling its destabilization or repression at the translational level by incomplete pairing. Transfection of cells with appropriate miRNAs is therefore one means of directly affecting the functions of cells such as pancreatic β-cells.5 Observed regulatory outcomes of miRNAs on cell differentiation, proliferation, and fate show that they have important roles in development,6,7 and can be used to dysregulate disease pathogenesis, including metabolic disorders.8
Functional islet β-cells that secrete insulin can be differentiated from appropriate cells and used to replace damaged β-cells of the pancreatic islets as a treatment for DM. During the development and differentiation of islet β-cells, key transcription factors are specifically targeted by miRNAs, 9,10 and recent studies have indicated that β-cell regeneration and differentiation can be induced by regulating the expression of miRNAs. For example, islet β-cell development was regulated by miR-200 and miR-30 family members through controlling the transition from epithelial to mesenchymal cells.9 The dynamic expression patterns of miR-375 and miR-7 in the differentiation of stem cells are similar to those of miR-146a and miR-34a in the developing pancreas of the fetus.10 Moreover, miR-342 targets V-maf musculoaponeurotic fibrosarcoma oncogene homolog B and forkhead box protein A2 genes, which are involved in the maturation and differentiation of β-cells.9
Adiponectin receptor 1 gene knockout (AdipoR1−/−) mice were previously shown to have increased adiposity associated with decreased glucose tolerance, indicating decreased insulin sensitivity. Because miRNAs may be an efficient alternative strategy to obtain regenerative islets, the present study assessed the role of miR-323-3p in the MIN6 cell line, investigated whether miR-323-3p targets AdipoR1 mRNA, and determined the influence of miR-323-3p on β-cell function and insulin secretion in vitro.
Materials and methods
Cells
The MIN6 insulinoma cell line was purchased from American Type Tissue Collection (Manassas, VA, USA). It is derived from a transgenic mouse expressing the large T-antigen of SV40 in pancreatic β-cells. Cells were cultured in DMEM medium containing 15% heat-inactivated fetal bovine serum (FBS), 25 mM glucose, and 5.5 mM 2-mercaptoethanol. They were grown at 37°C in a 5% CO2 incubator. Lipofectamine 2000 (Invitrogen, Carlsbad, CA, USA) was used for transfection.11
Total RNA extraction, prediction of miRNAs targeting AdipoR1, and the cloning of a novel miRNA
Total RNA was extracted from cells using TRIzol according to the manufacturer’s protocol (Thermo Fisher Scientific Inc., Rockford, IL, USA). The mirVana RNA isolation kit (Thermo Fisher Scientific Inc.) was used to remove smaller RNAs (<200 nt).
To investigate whether AdipoR1 was regulated by miRNAs in MIN6 cells, online Targetscan software (http://targetscan.org/) was used to predict miRNAs that target AdipoR1, which included miR-14-3p, miR-517b-3p, miR-365a-5, and miR-323-3p. The open reading frame of miR-323-3p was then cloned into the pmirGLO vector with the DynaExpress miRNA Cloning Kit (BioDynamics Laboratory Inc.,Tokyo, Japan).12
Reporter gene assays
AdipoR1 3′ UTR cDNA was amplified from the MIN6 cell line, then cloned into the luciferase reporter vector pmirGLO, which expresses Renilla and firefly luciferase. The AdipoR1 3′ UTR cloned in reverse orientation and lacking the miRNA target sequence was used as a control.13 The seed sequence of miR-323-3p (GUGCUUU) was complementary to the AdipoR1 3′ UTR located at position 38–44. The mutated 3′ UTR of AdipoR1 was constructed with the site-directed mutation kit (Promega, Madison, WI, USA). Luciferase activity in MIN6 cells was measured with a VICTOR light analyzer (Perkin Elmer, Foster City, CA, USA) using the Dual-Glo® Luciferase Assay System (Promega).
Transfection of miR-323-3p mimics and its inhibitors
Sequences of miR-323-3p mimics were: sense, 5′-GGAGGAACUUCCCAAGUG CUUUU-3′ and antisense, 5′-GACCCUC UGUCUUUUCACGAAAA-3′. The negative control was: sense, 5′-ACGUGACAC GUUCGGAGAAUU-3′ and antisense, 5′-AAUUCUCCGAACGUGUCACGU-3′, which were not homologous with the human genome. The miR-323-3p inhibitor sequence was: 5′-GUGGUCACCAUCUU CCCUU-3′. miR-323-3p mimics and inhibitors were purchased from Thermo Fisher Scientific (MC12418 and MH12418).
One day before transfection, 0.5–2 × 10⁵ cells were seeded per well in 500 µL of growth medium without antibiotics to attain 90%–95% confluence at the time of transfection. For each transfection sample, DNA–Lipofectamine 2000 complexes were prepared as follows: 0.8 µg mimics or inhibitors was diluted in 50 µL serum-free Opti-MEM I (Invitrogen Corp., Carlsbad, CA, USA), and mixed gently. Stock Lipofectamine 2000 was also mixed gently before use, then 2 µL was diluted in 50 µL Opti-MEM I. The mixtures were allowed to stand for 5 minutes at room temperature. The diluted mimics or inhibitors were then combined with diluted Lipofectamine to give a total volume of 100 µL. This was mixed gently and allowed to stand for 20 minutes at room temperature to enable lipoplexes to form which were stable for 6 hours at room temperature. Then, 100 µL of transfection complex was added to each well containing cells and medium, and mixed gently by rocking the plate back and forth. Cells were incubated at 37°C in a humidified incubator with 5% CO2 for 24 hours, then assayed by quantitative reverse transcription (qRT)-PCR.
qRT-PCR
TaqMan® Probe-Based MicroRNA Quantification was used to measure miR-323-3p expression levels in MIN6 cells. The SYBR Green kit (Sigma-Aldrich, St Louis, MO, USA) was used to conduct qRT-PCR trials with the Light-Cycler 480 Real-Time PCR System (Roche, Basel, Switzerland). SYBR Green I dye binds specifically to nucleic acids and can be excited by blue light at a 488-nm wavelength. The following primer sequences were used to amplify AdipoR1: forward, 5′-CAGATT TTCCATGTCCTGGTG-3′ and reverse, 5′-CGGAATTCCTGAAGGTTGG-3′.Glyceraldehyde-3-phosphate dehydrogenase was amplified as a control using primers: forward, 5′-CTCATGACCACAGT CCATGCC-3′ and reverse, 5′-GGCATGG ACTGTGGTCATGAG-3′.
Western blotting
Cells were collected and total proteins were extracted in 40 mM Tris–HCl (pH 7.4) containing 150 mM NaCl and 1% (v/v) Triton X-100, supplemented with protease inhibitors. Protein concentrations were determined using the bicinchoninic acid protein assay (Pierce Protein Research Products, Rockford, IL, USA). A total of 50 µg protein was loaded per lane and resolved on 10% sodium dodecyl sulfate polyacrylamide gel electrophoresis, then transferred to a polyvinylidene fluoride membrane (Millipore, Bedford, MA, USA). After blocking with 5% skimmed milk in Tris-buffered saline, 0.1% Tween 20, the membrane was probed with antibodies against AdipoR1, sirtuin (SIRT)-1, and AMP-activated protein kinase (AMPK) (all 1:2000) (Cell Signaling, Danvers, MA, USA), p-AMPK (1:3000) (Santa Cruz, CA, USA), and β-actin (1:2000) (Cell Signaling) at 4°C overnight. Blots were washed three times with phosphate-buffered saline (PBS), then incubated with horseradish peroxidase-conjugated secondary antibodies. Immunoreactive bands were visualized using the enhanced chemiluminescence detection system (Amersham Biosciences Corp., Piscataway, NJ, USA) and subsequent autoradiography. Protein levels were normalized to β-actin.
Proliferation and migration in the MIN6 cell line
The Cell Count Kit-8 (CCK-8) assay (Dojin do Molecular Technologies Inc., Rockville, MD, USA) was used as a qualitative marker for cell proliferation. At 48 hours after transfection with miR-323-3p mimics or its inhibitors, 5 × 10³ MIN6 cells were seeded per well of 96-well plates in triplicate. After 24 hours, 10 µL of CCK-8 solution mixed with 90 µL of DMEM was added to each well. After 2 hours of incubation, the absorbance was measured at 450 nm.
The migration ability of MIN6 cells were measured with the wound scratch experiment. MIN6 cells were seeded 5 × 10³ cells per well of 24-well plates to reach ∼70%–80% confluency as a monolayer after 24 hours of growth. The monolayer was then gently and slowly scratched with a new 1-mL pipette tip across the center of the well. The well was gently washed twice with medium to remove detached cells. Cells were then cultured with fresh medium for 48 hours, washed twice with 1× PBS, fixed with 3.7% paraformaldehyde for 30 minutes, then stained with 1% crystal violet in 2% ethanol for 30 minutes. The stained monolayer was examined microscopically, and the gap distance quantitatively evaluated to determine MIN6 cell migration.
5-bromo-2′-deoxyuridine assays and mitotic index analysis
The mitotic ability of MIN6 cells was investigated using 5-bromo-2′-deoxyuridine (BrdU). MIN6 cells were first synchronized using the block method with double thymidine. They were treated with 4 mM thymidine for 24 hours, washed with PBS, and released into thymidine-free fresh medium. At 9 hours after release from S-phase arrest, the cells were incubated with 30 ng/mL nocodazole for 4 hours. After synchronizing for 16 hours, the cells were again washed with PBS, then collected or fixed for assays. Cells were plated at 2 × 10⁵ cells/mL in 100 µL/well of appropriate cell culture media in 96-well plates. Diluted 1×BrdU label (20 µL) was added to appropriate wells and incubated for 18 hours. Cells were then counted and BrdU-positive cells were scored.
Mitotic events were determined by DNA staining and time-lapse video microscopy. After synchronizing, real-time images of cells were obtained every 10 minutes. Mitotic events were detected through changes in morphology. Mitotic cells were counted based on DNA condensation and nuclear morphology after staining using a DNA dye (Hoechst 33258; Sigma-Aldrich).
Detection of apoptosis
Cells were stained with Annexin V-FITC and propidium iodide (PI) 12, 24, 36, and 48 hours after being treated with miR-323-3p mimics or inhibitors. Approximately 106 cells were prepared in 1 mL of PBS with 10% FBS in each test tube. Tubes were centrifuged for 5 minutes at 200 × g at 4°C, and the supernatant was discarded. Cells were resuspended in 100 µL ice-cold Annexin V Binding Buffer, then 5 µL of Annexin V and 10 µL of PI was added to each tube, except for the single-stained control. Tubes were incubated for 15 minutes in the dark at room temperature, then 400 µL ice-cold Annexin V Binding Buffer was added and the samples were kept on ice away from light. They were then analyzed using an ACScan flow cytometer (Thermo Fisher Scientific), and data were evaluated using Flowjo software (https://www.flowjo.com/).
Sequences
The cDNA and shRNA sequences of AdipoR1 are shown in Table 1.
Table 1.
Sequences of Adiponectin receptor 1.
| Sequence (5′–3′) | |
|---|---|
| cDNA sequence | ATGTCTTCCCACAAAGGCTCTGCCGGGGCACAAGGCAATGGGGCTCCTTCTGGTAACAGAGAAGCTGACACAGTGGAGCTGGCTGAGCTGGGGCCCCTGCTGGAGGAGAAGGGCAAGCGGGCAGCCAGCAGCCCAGCCAAGGCTGAGGAAGATCAAGCATGCCCGGTGCCTCAGGAAGAGGAGGAGGAGGTGCGGGTGCTGACGCTTCCTCTGCAAGCCCACCATGCCATGGAGGAGATGGAGGAGTTCGTGTATAAGGTCTGGGAGGGACGTTGGAGAGTCATCCCGTATGATGTGCTTCCTGACTGGCTGAAAGACAACGACTACCTGCTACATGGCCACAGACCACCTATGCCCTCCTTTCGGGCTTGCTTCAAGAGCATCTTCCGCATCCACACAGAGACTGGCAACATCTGGACACATCTGCTTGGTTTTGTGCTATTTCTCTTTCTGGGAATCTTGACGATGCTGAGACCAAATATGTACTTCATGGCTCCCCTGCAGGAGAAGGTGGTCTTCGGGATGTTCTTCCTGGGCGCGGTGCTCTGCCTCAGTTTCTCCTGGCTCTTCCACACTGTCTACTGTCATTCAGAGAAGGTCTCTCGGACTTTTTACTATTCAGGGATTGCTCTACTGATTATGGGGAGCTTCGTTCCCTGGCTCTATTACTCCTTCTACTGCTCCCCACAGCCGCGGCTCATCTACCTCTCCATCGTCTGTGTCCTGGGCATCTCTGCCATCATTGTGGCACAGTGGGACCGGTTTGCCACTCCCAAGCACCGGCAGACAAGAGCAGGAGTGTTCCTGGGACTTGGCTTGAGTGGTGTTGTACCCACCATGCACTTTACTATCGCTGAGGGCTTTGTCAAGGCCACCACGGTGGGCCAGATGGGCTGGTTCTTCCTCATGGCTGTGATGTACATCACCGGCGCCGGCCTGTATGCTGCTCGGATTCCTGAGCGCTTCTTCCCTGGAAATTTGACATCTGGTTCCAGTCTCATCAGATTTCCACGTCCTGGTGGTGGCAGCAGCTTCGTCCACTTCTATGGTGTGTCCAACCTTCAGGAATTCCGTTATGGCCTAGAAGGTGGCTGTACCGACGACTCCTTCTCTGA |
| shRNA sequence | GTCCCATCTTTCTAGGACA |
Insulin secretion assay
The insulin secretion assay was conducted in MIN6 cells.14,15 To measure glucagon secretion, MIN6 cells were plated in 24-well culture plates at 3 × 10⁵ cells/well overnight. The following day, cells were washed twice with PBS and preincubated in modified medium of Krebs–Ringer with 3 mM/L glucose for 2 hours at 37°C. Subsequently, the cells were treated with 500 µL of modified medium of Krebs–Ringer containing either a low concentration of 3 mM glucose or high concentration of 20 mM glucose for 1 hour at 37°C. Aliquots (450 µL) from each treatment were taken and stored at –20°C until assayed for glucagon by radioimmunoassay and total DNA by absorption at 260 nm. Secretion data from the assays were normalized to the total glucagon content.
Radioimmunoassay
All test samples and controls were assayed in duplicate, using tubes coated with antibodies against insulin. A volume of 200 mL of either calibrators, controls, or test samples was pipetted to previously labelled tubes followed by 1 mL of 125I-Insulin. Each tube was vortexed and incubated for 24 hours at room temperature. They were then centrifuged for 15 minutes and decanted for 3 minutes. Radioactivity was counted for 1 minute using a gamma counter (Beckman, Fullerton, CA, USA). Insulin measurements were obtained using DPC® (Los Angeles, CA, USA) radioimmunoassay kits. Results were analyzed using Beckman Immunofit EIA/RIA analysis software (version 2.00). Values were expressed in mIU/mL per 100 mg tissue.
miRNA isolation labeling and microarray analysis
MIN6 cells were used for microarray hybridization according to the manufacturer’s instructions. Cells were incubated with 20 mM glucose for 24 hours, and untreated cells were used as a control. Total RNA was extracted from MIN6 cells, and its integrity confirmed by methylaldehyde degeneration gel electrophoresis. Low molecular weight RNA was then isolated using the PEG solution precipitation method. The T4 RNA ligase labeling method was adopted according to the Thomson protocol.10 Profiling of miRNA expression was analyzed by CapitalBio (CapitalBio Corp, Peking, China) using the double-channel fluorescent chip CapitalBio Mammalian miRNAArray V3.0. which includes 924 known miRNAs for humans, mice, and rats. Experimental procedures were performed as described in detail on the website of CapitalBio http://www.capitalbio.com.
Microarrays were scanned with a confocal LuxScan™ scanner (CapitalBio Corp., Beijing, China); scanning settings were adjusted to obtain a visualized balance of U6 and tRNA signals across arrays. Data were extracted from TIFF images using LuxScan™ 3.0 software (CapitalBio Corp.). The microarray intensity data were analyzed using Significance Analysis of Microarrays software.10
Statistical analyses
SPSS 17.0 software (SPSS Inc., Chicago, IL, USA) was used to analyze the data. Values are expressed as means ± standard deviation of experiments performed in triplicate. Data were analyzed by one-way analysis of variance and the Student’s t-test. Statistical significance was defined as P <0.05. Two class unpaired t-tests were performed to identify differences in miRNA expression in the microarray analysis. Genes possessing a q-value equal to 0 and a fold-change >2 were considered significantly different.
Results
miR-323-3p suppressed AdipoR1 expression in MIN6 cells
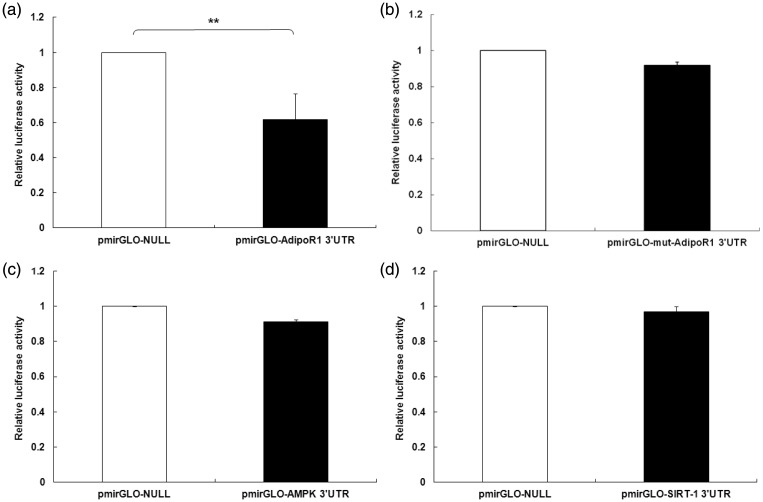
To determine whether AdipoR1 3′ UTRs bind miR-323-3p, a luciferase reporter assay was performed after transfecting MIN 6 cells with miR-323-3p mimics or inhibitors. Relative luciferase activities of the AdipoR1 3′ UTR were obviously down-regulated in MIN6 cells transfected with miR-323-3p (0.666 ± 0.123; Figure 1a), but there were no change in the mut-AdipoR1 group (0.947 ± 0.0183; Figure 1b). However, miR-323-3p could not bind directly with AMPK (0.918 ± 0.033; Figure 1c) or SIRT-1 (0.973 ± 0.068; Figure 1d) 3′ UTRs in MIN6 cells.
Figure 1.
miR-323-3p bound directly to the AdipoR1 3′ UTR in MIN6 cells.
(a) Relative luciferase activities of AdipoR1 3′ UTRs were clearly down-regulated in MIN6 cells transfected with miR-323-3p. (b) There was no change in cells transfected with mut-AdipoR1. miR-323-3p had no effect on luciferase activities of 3′ UTRs of (c) AMPK or (d) SIRT-1. Data are means ± standard deviation from three independent experiments. *P<0.05, **P<0.01.
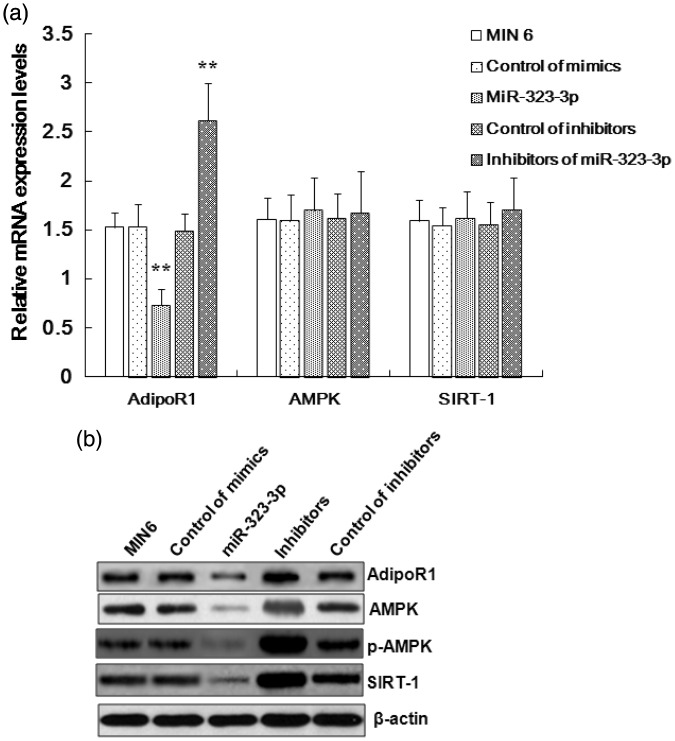
To evaluate the effects induced by miR-323-3p on the mRNA or protein expression of these genes in MIN6 cells, we conducted relative quantification analyses using western blots and RT-PCR (Figure 2). AdipoR1 mRNA and protein expression (1.527 ± 0.15) was shown to be suppressed by miR-323-3p (0.731 ± 0.16; Figure 2a and 2b), while miR-323-3p did not influence AMPK or SIRT-1 expression at the mRNA level, but affected their protein expression (Figure 2b). Additionally, AdipoR1 mRNA expression was promoted by miR-323-3p inhibitors (2.618 ± 0.38), but they did not affect the mRNA expression of AMPK or SIRT-1 (Figure 2a).
Figure 2.
miR-323-3p suppressed AdipoR1 mRNA and protein expression in MIN6 cells.
(a) miR-323-3p inhibited the mRNA expression of AdipoR1 in MIN6 cells. miR-323-3p inhibitors promoted the expression of AdipoR1 mRNA in MIN6 cells, but did not affect the mRNA expression of AMPK or SIRT-1. (b) miR-323-3p inhibited the protein expression of AdipoR1 in MIN6 cells. miR-323-3p did not affect the mRNA expression of AMPK or SIRT-1, but decreased the protein expression of AMPK, p-AMPK, and SIRT-1. Data are means ± standard deviation from three independent experiments. *P<0.05, **P<0.01.
Growth and migration of MIN6 cells was inhibited by miR-323-3p
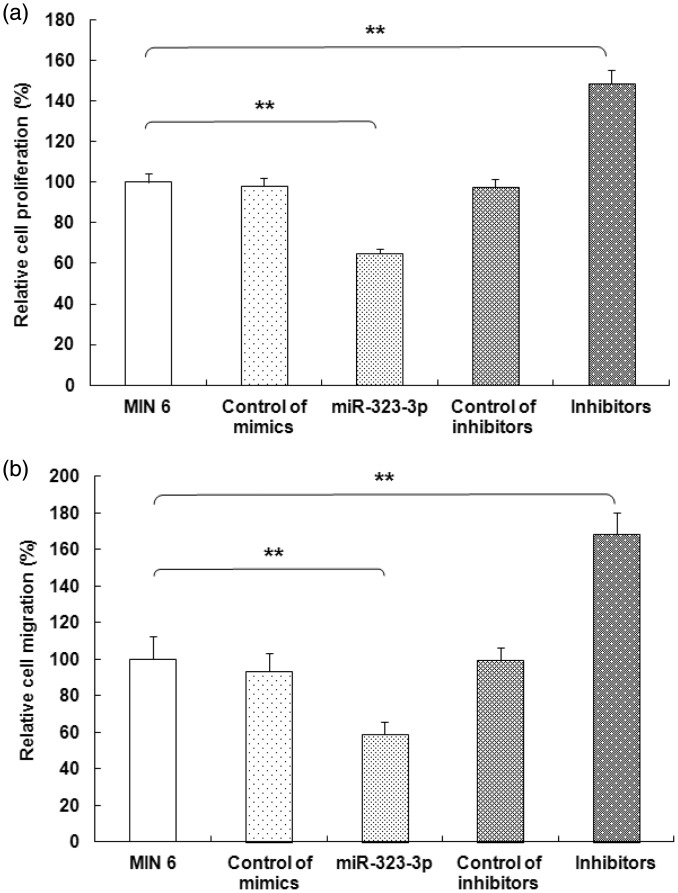
To assess the biological function of miR-323-3p, we over-expressed or inhibited it in MIN6 cells. Compared with the control group, the colony formation assay showed that MIN6 cell growth (100 ± 4.18) was inhibited following transfection with miR-323-3p (64.73 ± 2.47; Figure 3a). Conversely, miR-323-3p inhibitors promoted growth in MIN6 cells (148.66 ± 6.73; Figure 3a). Moreover, miR-323-3p significantly suppressed the migration ability of MIN6 cells (58.73 ± 6.66 vs. 100 ± 12.34, P<0.001). In contrast, miR-323-3p inhibitors clearly promoted the migration ability of MIN6 cells (168.64 ± 11.38; Figure 3b).
Figure 3.
miR-323-3p suppressed MIN6 cell growth and migration.
(a) The colony formation assay showed that MIN6 cell growth was significantly inhibited following miR-323-3p transfection (P<0.001), while miR-323-3p inhibitors accentuated MIN6 cell growth. (b) miR-323-3p significantly suppressed MIN6 cell migration (P<0.001), while miR-323-3p inhibitors facilitated migration. Data are means ± standard deviation from three independent experiments. *P<0.05, **P<0.01.
miR-323-3p suppressed entry into mitosis and the proliferation of MIN6 cells
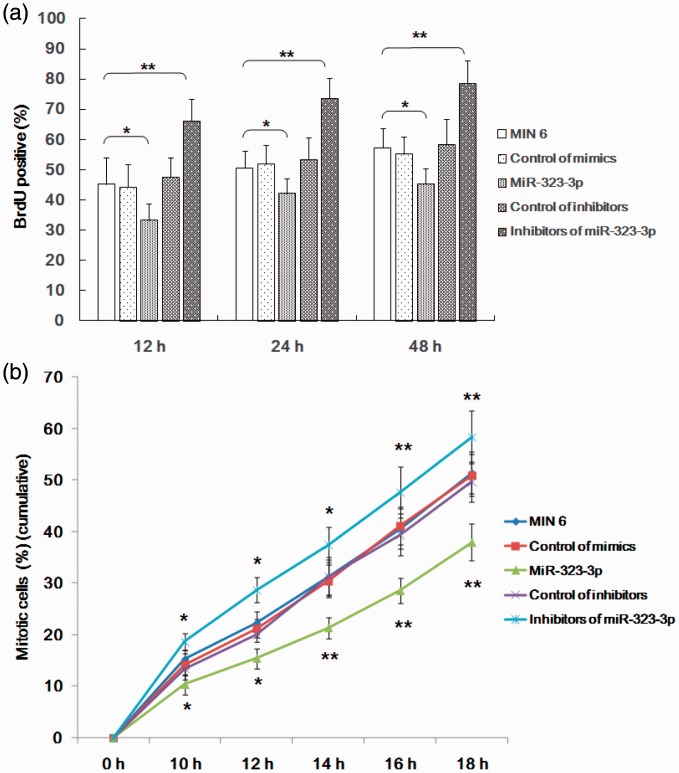
We further investigated the role of miR-323-3p mimics and inhibitors on mitosis and proliferation in MIN6 cells using BrdU and flow cytometry. miR-323-3p significantly suppressed proliferation (33.31 ± 5.38 vs 45.27 ± 8.62; Figure 4a) and entry into mitosis (Figure 4b) of MIN6 cells. Moreover, inhibitors of miR-323-3p promoted proliferation (66.18 ± 7.31; Figure 4a) and entry into mitosis (Figure 4b) of MIN6 cells in a time-dependent manner.
Figure 4.
miR-323-3p suppressed entry into mitosis and the proliferation of MIN6 cells.
(a) miR-323-3p significantly suppressed MIN6 cell proliferation, while miR-323-3p inhibitors promoted it. (b) miR-323-3p also significantly suppressed entry into mitosis of MIN6 cells in a time-dependent manner, while miR-323-3p inhibitors promoted it. Data are means ± standard deviation from three independent experiments. *P<0.05, **P<0.01.
miR-323-3p promoted the apoptosis of MIN6 cells
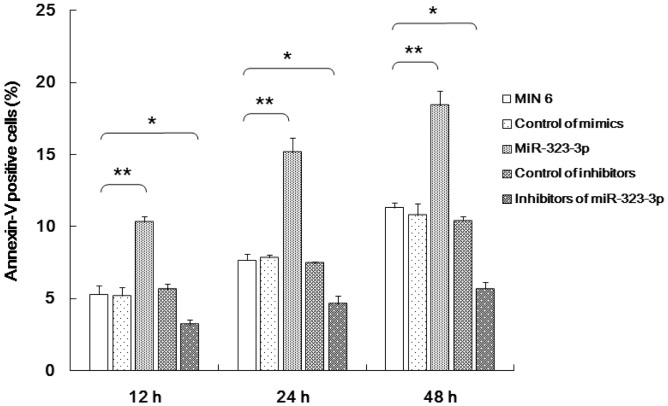
The transfection of miR-323-3p mimics was shown to clearly induce the apoptosis of MIN6 cells in a time-dependent manner (Figure 5). Moreover, miR-323-3p inhibitors repressed the apoptosis of MIN6 cells (Figure 5).
Figure 5.
miR-323-3p promoted the apoptosis of MIN6 cells.
miR-323-3p mimics induced MIN6 cell apoptosis in a time-dependent manner. miR-323-3p inhibitors repressed MIN6 cell apoptosis. Data are means ± standard deviation from three independent experiments. *P<0.05, **P<0.01.
miRNA-323-3p regulated glucose-stimulated insulin secretion associated with the AdipR1/AMPK/SIRT-1 signaling pathway
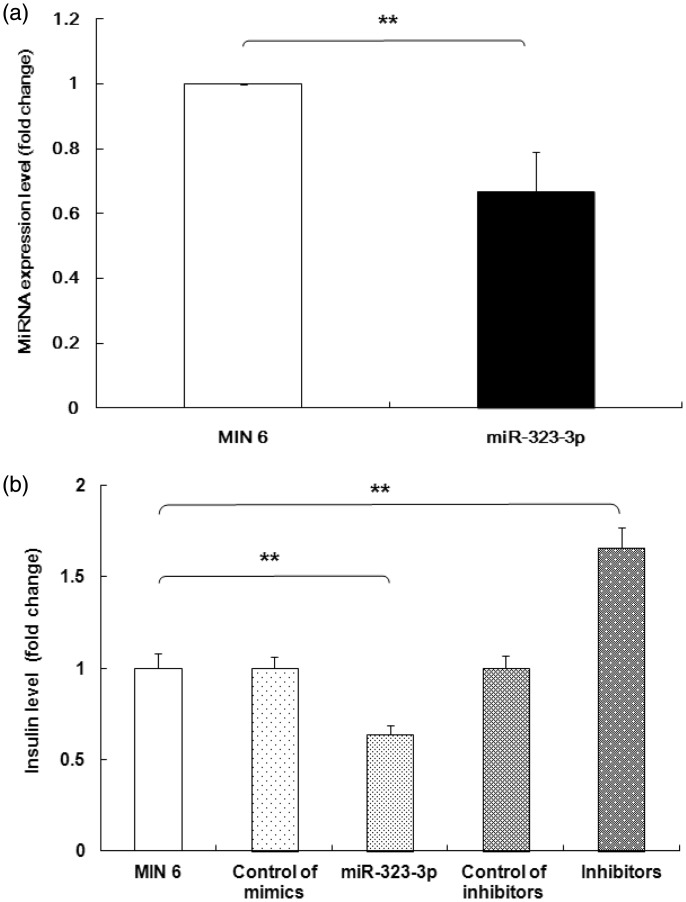
To evaluate the role of miRNA-323-3p in glucose-stimulated insulin secretion (GSIS), microarray analysis was performed to identify miRNAs that were differentially expressed in MIN6 cells treated with glucose. Microarray analysis indicated that miR-323-3p expression was induced by glucose stimulation. To validate these data, we performed RT-PCR assays. These confirmed the changes of insulin levels induced by mimics (0.666 ± 0.123 vs 1 ± 0.03) or inhibitors of miR-323-3p (Figure 6a). As shown in Figure 6b, the transient transfection of miR-323-3p mimics suppressed GSIS (0.64 ± 0.05 vs 1 ± 0.08), while the transfection of inhibitors promoted GSIS (1.66 ± 0.11).
Figure 6.
miRNA-323-3p regulated GSIS in MIN 6 cells.
(a) Real-time PCR of MIN6 cells incubated with 20 mM glucose for 24 hours showed that miR-323-3p mimics suppressed insulin secretion while miR-323-3p inhibitors increased it. (b) The transient transfection of miR-323-3p mimics and inhibitors respectively suppressed and promoted insulin secretion stimulated by high glucose levels (20 mM). Data are means ± standard deviation from three independent experiments. *P<0.05, **P<0.01.
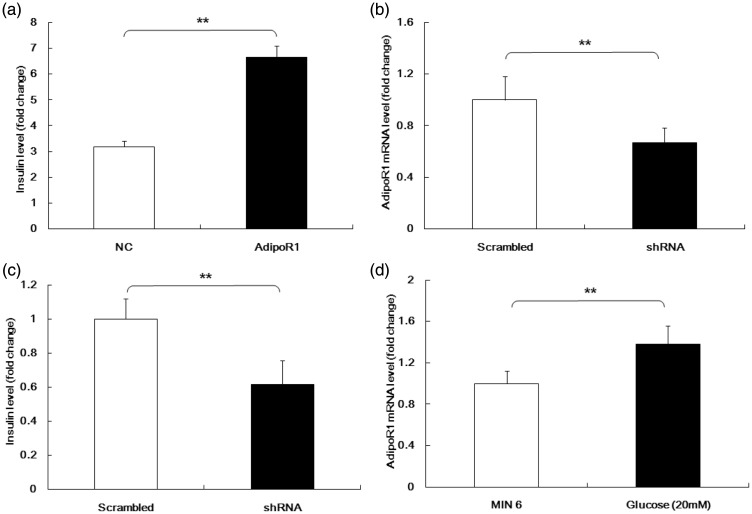
AdipoR1 over-expression was observed to increase GSIS compared with controls (6.66 ± 0.43 vs 3.18 ± 0.24, respectively; Figure 7a). To confirm this, we designed short hairpin (sh)RNAs for AdipoR1 and tested their efficiency (shRNA: 0.67 ± 0.12 vs control: 1 ± 0.18; Figure 7b). AdipoR1 knockdown was observed to inhibit the insulin secretion stimulated by high levels of glucose (shRNA: 0.61 ± 0.14 vs. control: 1 ± 0.12; Figure 7c). The influence of glucose on AdipoR1 expression was also examined, and relative expression levels of AdipoR1 mRNA were shown to be much higher in MIN6 cells stimulated with high glucose levels than controls (1.38 ± 0.18 vs, 1 ± 0.12, respectively; Figure 7d).
Figure 7.
AdipoR1 regulated GSIS.
(a) AdipoR1 over-expression increased GSIS. (b) The efficiency of short hairpin RNA against AdipoR1. (c) AdipoR1 knockdown inhibited insulin secretion stimulated by high levels of glucose. We next assessed the effects of glucose on AdipoR1 expression. (d) Relative expression levels of AdipoR1 mRNA were much higher in MIN6 cells stimulated with high glucose than in controls. Data are means ± standard deviation from three independent experiments. *P<0.05, **P<0.01.
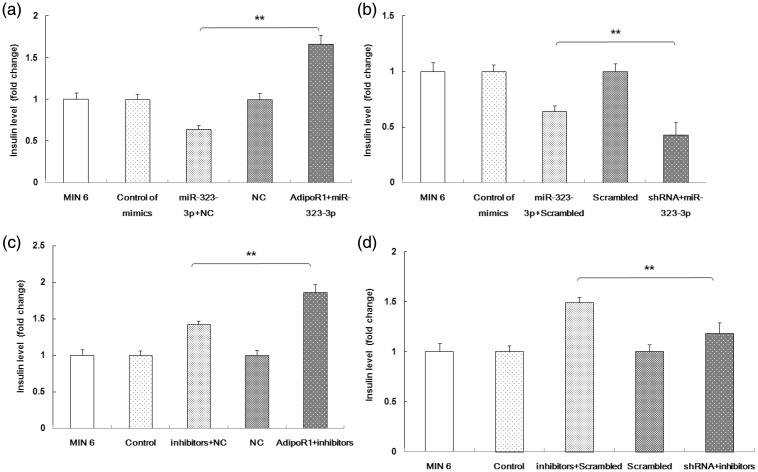
Because both miR-323-3p and AdipoR1 can regulate GSIS, while miR-323-3p directly binds AdipoR1, the role of miR-323-3p on AdipoR1 expression associated with GSIS was next studied. As shown in Figure 8a, AdipoR1 over-expression abolished the role of miR-323-3p mimics on GSIS. Conversely, miR-323-3p mimics and AdipoR1 shRNA both inhibited GSIS (Figure 8b). The effect of the miR-323-3p/AdipoR1 signaling pathway on GSIS was further evaluated using miR-323-3p inhibitors. AdipoR1 over-expression significantly enhanced the effect of the miR-323-3p inhibitor on GSIS (Figure 8c). Additionally, GSIS was reduced in miR-323-3p inhibitor-transfected MIN6 cells when AdipoR1 was knocked down by shRNA-AdipoR1 (Figure 8d).
Figure 8.
miRNA-323-3p regulated GSIS by mediating AdipoR1.
(a) AdipoR1 over-expression abolished the effect of miR-323-3p mimics in GSIS. (b) The miR-323-3p mimic and AdipoR1 shRNA synergistically inhibited GSIS. (c) AdipoR1 over-expression significantly enhanced the effect of the miR-323-3p inhibitor on GSIS. (d) GSIS was reduced in miR-323-3p inhibitor-transfected MIN6 cells when AdipoR1 was knocked down by shRNA-AdipoR1. Data are means ± standard deviation from three independent experiments. *P<0.05, **P<0.01.
Discussion
Type 2 DM can cause blindness, renal failure, and cardiovascular disease.16,17 The worldwide rise in its incidence is a recent phenomenon that coincides with lifestyle changes that have occurred during the 20th century.18,19 Pancreatic β-cells produce the small peptide hormone insulin, which is crucial for mammalian glucose homeostasis.20–22 In healthy mammals, insulin is released when blood glucose concentrations are elevated, which promotes the absorption of glucose by fat tissue, skeletal muscles, and the liver.23,24
miRNAs are a category of oligonucleotides that affect gene expression by pairing with mRNA 3′ UTRs.25,26 Recently, miRNAs have been shown to be involved in both pancreatic development and the secretion of insulin. GSIS can be specifically inhibited by miR-375, which plays a vital role in the secretion of insulin,24 while miR-9 regulates GSIS through targeting SIRT1 in β-cells.21 miR-124a is hyper-expressed in the pancreatic islets of patients with type 2 DM, and inhibits insulin secretion,27 miR-187 regulates the expression of homeodomain-interacting protein kinase 3 and is associated with reduced GSIS,20 and miR-34c reduces GSIS associated with vesicle-associated membrane protein 2, which is involved in β-cell exocytosis.28 Though numerous studies have indicated that miRNA target genes are associated with GSIS signaling, the regulatory mechanisms are unclear. Adiponectin secretion and insulin receptor surface targeting utilize the same post-Golgi trafficking pathways that are essential for appropriate systemic insulin sensitivity and glucose homeostasis.29 In this study, the role of miRNAs in insulin secretion was investigated by demonstrating GSIS through miR-323-3p regulation of the AdipoR1/AMPK/SIRT-1 signaling pathway. Our work showed that miR-323-3p directly targets AdipoR1 in islet β-cells, and that AdipoR1 controls the biofunctions of MIN6 cells through the AMPK/SIRT-1 pathway.
Adiponectin is an adipokine factor secreted by adipose tissue that is down-regulated in insulin-resistant obesity. Type 2 DM, metabolism syndrome, atherosclerosis, and obesity are consistently associated with hypoadiponectinemia.30 Adiponectin induces anti-atherosclerotic and anti-diabetic effects through restraining inflammatory and oxidative stress processes.31,32 The biological effects induced by adiponectin are mainly related to its receptors: AdipoR1 and adiponectin receptor 2. Moreover, AMPK is also mediated by AdipoR1.33 However, little was known about the anti-diabetic effect of miRNA-mediated activity and regulation of AdipoR1.
We showed that miR-323-3p regulates the expression of AdipoR1 by directly binding to its 3′ UTRs, but that it did not bind directly to AMPK or SIRT-1 in MIN6 cells. Furthermore, miR-323-3p did not regulate the mRNA expression of AMPK and SIRT-1, but affected their protein expression levels through modulating AdipoR1 expression. We also assessed the effect of miR-323-3p on the molecular biological functions of MIN6 cells. miR-323-3p suppressed MIN6 cell proliferation, migration, growth, and mitosis entry, while conversely miR-323-3p inhibitors promoted these functions. These results demonstrated that miR-323-3p restrains the bio-function of MIN6 cells. Furthermore, miR-323-3p suppressed MIN6 cell survival in a time-dependent manner as shown by the apoptosis assay. This indicates that the function of MIN6 cells could be improved by suppressing the expression of miR-323-3p using its inhibitors, to mediate the regulation of AdipoR1 and its signaling pathway.
The effects of miR-323-3p on GSIS were investigated using microarray analysis, which indicated that miR-323-3p expression was induced by glucose stimulation in MIN6 cells. Moreover, miR-323-3p mimics suppressed GSIS, but its inhibitors promoted GSIS. Additionally, AdipoR1 knockdown inhibited insulin secretion stimulated by high levels of glucose. Therefore, both miR-323-3p and AdipoR1 appear to regulate GSIS. We also found that AdipoR1 over-expression abolished the effect of miR-323-3p mimics on GSIS, while conversely miR-323-3p mimics and AdipoR1 shRNA together inhibited GSIS. Our results demonstrate that AdipoR1 is directly regulated by miR-323-3p, and is involved in the modulation of GSIS in islet cells.
In conclusion, miR-323-3p exerts effects on growth, proliferation, mitosis, and insulin secretion of the MIN6 cell line, which are mediated by regulating AdipoR1 and its signaling pathway. miR-323-3p directly binds AdipoR1, and is a crucial diabetes factor through its role of inhibiting the AdipoR1/AMPK/SIRT-1 signaling pathway. Our findings suggest that targeting AdipoR1 with miR-323-3p is a potential approach to improve the function of islet cells.
Declaration of conflict of interest
The authors declare that there is no conflict of interest.
Funding
The authors disclosed receipt of the following financial support for the research, authorship, and/or publication of this article: This work was supported by grants from the International Scientific and Technological Cooperation Projects of Shanxi Province, China (No. 2015081031). The study sponsors had no involvement in the study.
References
- 1.Asif M. The prevention and control the type-2 diabetes by changing lifestyle and dietary pattern. J Educ Health Promot 2014; 3: 1–8. [DOI] [PMC free article] [PubMed] [Google Scholar]
- 2.Riobo Servan P. Obesity and diabetes. Nutr Hosp 2013; 28: 138–143. [DOI] [PubMed] [Google Scholar]
- 3.Zhong VW, Juhaeri J, Cole SR, et al. HbA1C variability and hypoglycemia hospitalization in adults with type 1 and type 2diabetes: A nested case-control study. J Diabetes Complications 2018; 32: 203–209. [DOI] [PubMed] [Google Scholar]
- 4.Bartel DP. MicroRNAs: target recognition and regulatory functions. Cell 2009; 136: 215–233. [DOI] [PMC free article] [PubMed] [Google Scholar]
- 5.Lahmy R, Soleimani M, Sanati MH, et al. Pancreatic islet differentiation of human embryonic stem cells by microRNA overexpression. J Tissue Eng Regen Med 2016; 10: 527–534. [DOI] [PubMed] [Google Scholar]
- 6.Stefani G andSlack FJ.. Small non-coding RNAs in animal development. Nat Rev Mol Cell Biol 2008; 9: 219–230. [DOI] [PubMed] [Google Scholar]
- 7.Shi Y andJin Y.. MicroRNA in cell differentiation and development. Sci China C Life Sci 2009; 52: 205–211. [DOI] [PubMed] [Google Scholar]
- 8.Carrington JC andAmbros V.. Role of microRNAs in plant and animal development. Sci 2003; 301: 336–338. [DOI] [PubMed] [Google Scholar]
- 9.Kaviani M, Azarpira N, Karimi MH, et al. The role of microRNAs in islet β-cell development. Cell Biol Int 2016; 40: 1248–1255. [DOI] [PubMed] [Google Scholar]
- 10.Dalgaard LT andEliasson L.. An 'alpha-beta' of pancreatic islet microribonucleotides. Int J Biochem Cell Biol. 2017; 88: 208–219. [DOI] [PubMed] [Google Scholar]
- 11.Shewade YM Umrani M, andBhonde RR.. Large-scale isolation of islets by tissue culture of adult mouse pancreas. Transplant Proc 1999; 31: 1721–1723. [DOI] [PubMed] [Google Scholar]
- 12.Connell RM, Taganov KD, Boldin MP, et al. MicroRNA-155 is induced during the macrophage inflammatory response. Proc Natl Acad Sci USA 2007; 104: 1604–1609. [DOI] [PMC free article] [PubMed] [Google Scholar]
- 13.Esquela-Kerscher A andSlack FJ.. Oncomirs-microRNAs with a role in cancer. Nat Rev Cancer 2006; 6: 259–269. [DOI] [PubMed] [Google Scholar]
- 14.Sebastiani G, Po A, Miele E, et al. MicroRNA-124a is hyperexpressed in type 2 diabetic human pancreatic islets and negatively regulates insulin secretion. Acta Diabetol 2015; 52: 523–530. [DOI] [PubMed] [Google Scholar]
- 15.da Silva Xavier G, Loder MK, McDonald A, et al. TCF7L2 regulates late events in insulin secretion from pancreatic islet beta-cells. Diabetes 2009; 58: 894–905. [DOI] [PMC free article] [PubMed] [Google Scholar]
- 16.Sebastiani G, Po A, Miele E, et al. MicroRNA-124a is hyperexpressed in type 2 diabetic human pancreatic islets and negatively regulates insulin secretion. Acta Diabetol 2015; 52: 523–530. [DOI] [PubMed] [Google Scholar]
- 17.Weir GC andBonner-Weir S.. Sleeping islets and the relationship between beta-cell mass and function. Diabetes 2011; 60: 2018–2019. [DOI] [PMC free article] [PubMed] [Google Scholar]
- 18.Kahn SE. The relative contributions of insulin resistance and beta-cell dysfunction to the pathophysiology of type 2 diabetes. Diabetologia 2003; 46: 3–19. [DOI] [PubMed] [Google Scholar]
- 19.Maris M, Ferreira GB, D’Hertog W, et al. High glucose induces dysfunction in insulin secretory cells by different pathways: a proteomic approach. J Proteome Res 2010; 9: 6274–6287. [DOI] [PubMed] [Google Scholar]
- 20.Locke JM, da Silva Xavier G, Dawe HR, et al. Increased expression of miR-187 in human islets from individuals with type 2 diabetes is associated with reduced glucose-stimulated insulin secretion. Diabetologia 2014; 57: 122–128. [DOI] [PMC free article] [PubMed] [Google Scholar]
- 21.Ramachandran D, Roy U, Garg S, et al. Sirt1 and mir-9 expression is regulated during glucose-stimulated insulin secretion in pancreatic beta-islets. FEBS J 2011; 278: 1167–1174. [DOI] [PubMed] [Google Scholar]
- 22.Osmai M, Osmai Y, Bang-Berthelsen CH, et al. microRNAs as regulators of betacell function and dysfunction. Diabetes Metab Res Rev 2015; 32: 334–349. [DOI] [PubMed] [Google Scholar]
- 23.Thirone AC Huang C, andKlip A.. Tissue-specific roles of IRS proteins in insulin signaling and glucose transport. Trends Endocrinol Metab 2006; 17: 72–78. [DOI] [PubMed] [Google Scholar]
- 24.Poy MN, Eliasson L, Krutzfeldt J, et al. A pancreatic islet-specific microRNA regulates insulin secretion. Nature 2004; 432: 226–230. [DOI] [PubMed] [Google Scholar]
- 25.Ambros V. The functions of animal microRNAs. Nature 2004; 431: 350–355. [DOI] [PubMed] [Google Scholar]
- 26.Bartel DP. MicroRNAs: genomics, biogenesis, mechanism, and function. Cell 2004; 116: 281–297. [DOI] [PubMed] [Google Scholar]
- 27.Baroukh N, Ravier MA, Loder MK, et al. MicroRNA-124a regulates Foxa2 expression and intracellular signaling in pancreatic beta-cell lines. J Biol Chem 2007; 282: 19575–19588. [DOI] [PubMed] [Google Scholar]
- 28.Hu S, Wang H, Chen K, et al. MicroRNA-34c downregulation ameliorates amyloidbeta-induced synaptic failure and memory deficits by targeting VAMP2. J Alzheimers Dis 2015; 48: 673–686. [DOI] [PubMed] [Google Scholar]
- 29.Rödiger M, Werno MW, Wilhelmi I, et al. Adiponectin release and insulin receptor targeting share trans-Golgi-dependent endosomal trafficking routes. Mol Metab 2017. Nov 22 pii: S2212–8778(17)30936–5. doi: 10.1016/j.molmet.2017.11.011. [DOI] [PMC free article] [PubMed] [Google Scholar]
- 30.Fisman EZ andTenenbaum A.. Adiponectin: a manifold therapeutic target for metabolic syndrome, diabetes, and coronary disease? Cardiovasc Diabetol 2014; 13: 103. [DOI] [PMC free article] [PubMed] [Google Scholar]
- 31.Yamauchi T, Kamon J, Ito Y, et al. Cloning of adiponectin receptors that mediate antidiabetic metabolic effects. Nature 2003; 423: 762–769. [DOI] [PubMed] [Google Scholar]
- 32.Yamauchi T, Iwabu M, Okada-Iwabu M, et al. Adiponectin receptors: a review of their structure, function and how they work. Best Pract Res Clin Endocrinol Metab 2014; 28: 15–23. [DOI] [PubMed] [Google Scholar]
- 33.Fu Y. Adiponectin signaling and metabolic syndrome. Prog Mol Biol Transl Sci 2014; 121: 293–319. [DOI] [PubMed] [Google Scholar]


