

Abstract
Purpose
Use projection-resolved OCT angiography to investigate the autoregulatory response in the 3 parafoveal retinal plexuses under hyperoxia.
Design
Prospective cohort study.
Participants
Nine eyes from 9 healthy participants.
Methods
One eye from each participant was scanned using a commercial spectral-domain OCT system. Two repeated macular scans (3 × 3 mm2) were acquired at baseline and during oxygen breathing. The split-spectrum amplitude-decorrelation algorithm was used to detect blood flow. The projection-resolved algorithm was used to suppress projection artifacts and resolve blood flow in 3 distinct parafoveal plexuses. The Wilcoxon signed-rank test was used to compare baseline and hyperoxic parameters. The coefficient of variation, intraclass correlation coefficient, and pooled standard deviation were used to assess the reliability of OCT angiography measurements.
Main Outcome Measures
Flow index and vessel density were calculated from the en face angiograms of each of the 3 plexuses, as well as from the all-plexus inner retinal slab.
Results
Hyperoxia induced significant reduction in the flow index (−11%) and vessel density (−7.8%) of only the deep capillary plexus (P < 0.001) and in the flow index of the all-plexus slab (P = 0.015). The flow index also decreased in the intermediate capillary plexus and the superficial vascular complex, but these changes were small and not statistically significant. The projection-resolved OCT angiography showed good within-session baseline repeatability (coefficient of variation, 0.8%–5.2%; intraclass correlation coefficient, 0.93–0.98) in all parameters. Relatively large between-day response reproducibility was observed (pooled standard deviation, 1.7%–9.4%).
Conclusions
Projection-resolved OCT angiography was able to show that the retinal autoregulatory response to hyperoxia affects only the deep capillary plexus, but not the intermediate capillary plexus or superficial vascular complex.
The retina is among the most metabolically active tissues of the human body.1,2 A healthy retina possesses an intrinsic autoregulatory mechanism that modifies blood flow in response to different physiologic conditions in order to maintain homeostasis.3,4 Impairments in the autoregulatory response have been associated with the pathogenesis of several vision-threatening diseases, such as diabetic retinopathy and age-related macular degeneration.5–10 Physiologic variations in oxygen delivery to the retina were found to induce multiple hemodynamic changes.11,12 The ability to characterize this response can be useful to investigate the retinal vascular physiology as well as pathophysiology of those diseases.
Several noninvasive imaging modalities, such as blue field entoptic phenomenon,13,14 scanning laser Doppler techniques,15,16 and Doppler OCT,17–19 have been used to investigate autoregulation. These studies reported decreases in retinal blood velocity, vessel diameter, and blood flow during increased tissue oxygenation (hyperoxia). More recently, OCT angiography (OCTA) has also been used to characterize a similar response in the peripapillary inner retinal flow index and vessel density during hyperoxia.20,21 Previous investigations described the hyperoxia response in the combined retina as a single vascular unit. However, histological studies in primates and human cadavers divided retinal circulation around macula into 3 distinct vascular plexuses.22–24 Bearing in mind the findings of oxygen distribution and consumption in different retinal layers,25–28 we predicted that different retinal vascular layers might react differently to changes in systemic oxygenation. Still, traditional imaging modalities lacked the capability to resolve the flow in these 3 plexuses separately, and hence we had a limited understanding of how they react separately to oxygen.
We have recently developed an algorithm called the projection-resolved29 OCTA (PR-OCTA) that allows for the visualization and segmentation of the 3 distinct parafoveal vascular plexuses of the inner retina: superficial vascular complex (SVC), intermediate capillary plexus (ICP), and deep capillary plexus (DCP).30 In this study, we aim to characterize the change in flow index and vessel density of the parafoveal retinal plexuses in response to hyperoxia using PR-OCTA.
Methods
Study Population
The study was conducted at Casey Eye Institute (Portland, OR), and the protocol was approved by the institutional review board of Oregon Health and Science University. We adhered to the tenets of the Declaration of Helsinki and the Health Insurance Portability and Accountability Act in the treatment of human participants. The nature of the study was described to each participant, and an informed written consent was obtained. Healthy volunteers were recruited to participate in this study. Volunteers were excluded if they had 1 of the following characteristics: ocular disease, inability to maintain stable fixation for scanning, visual acuity worse than 20/40, refractive errors greater than −6.00 or +2.00 diopters, significant media opacity, or history of major ocular surgery, as well as systemic diseases that can affect microcirculation (such as diabetes and hypertension).
OCT Angiography
The experiment was conducted using the commercially available spectral-domain OCT system (RTVue XR Avanti, Optovue, Fremont, CA). The system has an A-scan repetition rate of 70 kHz, with a center wavelength of 840 nm and a bandwidth of 45 nm. The axial and transverse resolutions in tissue are 5 μm and 22 μm, respectively.
Volumetric scans, centered at the macula, were 3 × 3 mm with a depth of 1.6 mm. B scans in the fast transverse scanning direction were comprised of 304 A scans. Two consecutive B scans were captured at each location before proceeding to the next location. A total of 304 locations in the slow transverse direction were sampled. This formed a 3-dimensional data cube consisting of 304 × 304 × 512 pixels. The 608 B scans in each data cube were acquired in 2.9 seconds. Two volumetric raster scans, 1 x-fast scan and 1 y-fast scan, were obtained and registered. This scan set was repeated a second time during each scan session. A scan session was included if ≥1 scan set was free of motion artifacts.
Both the blood flow and structural information were obtained congruently using the AngioVue software (Optovue), a commercial version of the split-spectrum amplitude-decorrelation angiography (SSADA) algorithm. A detailed description of the SSADA method can be found in our previous publications.21,31 In short, the SSADA algorithm splits the spectrum into 11 subspectra and calculates the signal amplitude decorrelation between the 2 consecutive B scans captured at each location. This method enhances the signal-to-noise ratio of flow detection.32 The decorrelation signal, representing here the blood flow signal for OCTA, is a function of light scattering due to the displacement of red blood cells over time. The subspectra used in SSADA have one quarter of the full OCT bandwidth and support an angiographic depth resolution of 20 μm, which is sufficient to resolve the retinal plexuses.
Data Acquisition
Experiments were performed in a quiet and dimly lighted room. During the first scan session, participants were asked to sit and breathe normally for 10 minutes to establish a baseline condition. Arterial blood pressure and pulse were taken and recorded. Participants were then asked to fixate on an internal fixation target. The baseline breathing condition was maintained while the operator used the real-time video image on the software interface to center at the macula and acquire the 2 scan sets (constituting 1 scan session). The second scan session immediately followed, during which participants were fitted with a simple face mask (OxyMask, Southmedic, Barrie, Ontario, Canada) and given supplemental oxygen for 10 minutes at a flow rate of 15 liters per minute. This rate delivered 60%–90% oxygen in the inspired oxygen (FiO2), creating a systemic hyperoxic condition. These FiO2 values were taken from the mask’s manufacturer manual. Generally, the calculation of FiO2 is based on the assumption that at a constant supplemental oxygen concentration and flow rate, FiO2 depends on the individual’s peak inspiratory flow rate, normally ranging around 20–30 liters per minute. At the end of the 10 minutes, hyperoxia was maintained while blood pressure and heart rate were recorded and the participant’s eye was scanned. To assess between-day reproducibility of the baseline measurement and hyperoxic response, the protocol was repeated on a separate day.
Data Processing
Participants would be excluded if both scan sets from a single scan session were of poor image quality (marked motion artifacts, unfocused, off-center, or low signal strength). The participant was included if ≥1 scan set from each scan session passed the quality control. Using the directional graph search technique, structural OCT images were automatically segmented at the inner limiting membrane, nerve fiber layer, inner plexiform layer, inner nuclear layer (INL), outer plexiform layer (OPL), outer nuclear layer, ellipsoid zone, retinal pigment epithelium, and the Bruch’s membrane. Boundary lines defined on structural images were applied to corresponding angiography frames. Details about these methods are described in previous publications.30
A detailed description of the projection-resolved algorithm can also be found in previous publications.29 In short, PR-OCTA uses a linear model to relate the decorrelation value of projected flow with its log amplitude OCT signal and the overlying in situ flow. This assumes that both in situ and projected decorrelation values are affected by the reflectance amplitude. Therefore, the projected flow signal is lower than the in situ flow signal in a linear fashion. This allowed the visualization of the 3 distinct retinal vascular plexuses in the inner parafoveal area without significant flow projection artifact.
En face angiograms were constructed by maximum flow projection within relevant slabs. The inner retinal slab was defined between the inner limiting membrane and OPL (Fig 1). The inner retina was subdivided into 3 slabs corresponding to the 3 retinal plexuses commonly described in histological studies and visualized on a composite OCT B scan of the parafoveal region. The SVC slab contains flow projection in the inner 80% of ganglion cell complex (layers between the nerve fiber layer and inner plexiform layer), the ICP is located in the outer 20% of the ganglion cell complex and inner 50% of the INL, and the DCP shows the flow in the outer 50% of the INL and all of the OPL.
Figure 1.
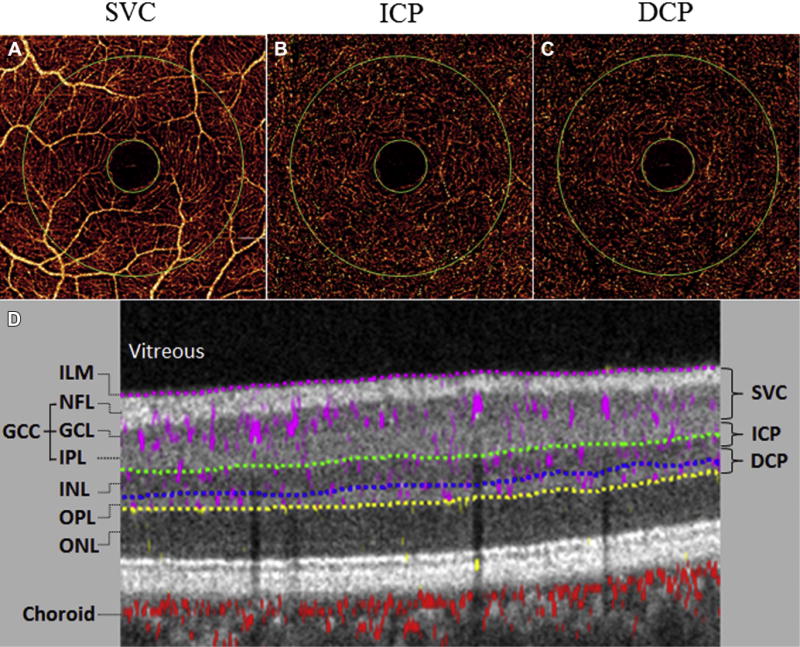
Projection-resolved OCT angiography (PR-OCTA) images from a baseline scan session. A–C, En face maximum flow projection angiograms for the 3 parafoveal retinal plexuses: superficial vascular complex (SVC), intermediate capillary plexus (ICP), and deep capillary plexus (DCP). Flow index and vessel density were calculated in the annulus region between the 2 green circles. D, Cross-sectional PR-OCTA with gray-scale reflectance signal and color-coded flow signal. The anatomic boundaries (dotted lines) demonstrate the results of automated computer segmentation of inner retinal layers and are used to derive the slab boundaries of the retinal plexuses. The relevant retinal layers were the inner limiting membrane (ILM), the ganglion cell complex (GCC; including nerve fiber layer [NFL], ganglion cell layer [GCL], and inner plexiform layer [IPL]), the inner nuclear layer (INL), and the outer plexiform layer (OPL).
Flow index and vessel density were automatically calculated from decorrelation values of pixels contained in the annulus region of the en face retinal angiograms (Fig 1). The annulus region was manually centered at the foveal avascular zone, with the internal and external diameters set at 0.6 and 2.5 mm, respectively. Flow index is the average pixel decorrelation value and contains information on both vessel area and blood flow velocity. However, it cannot be considered true volumetric blood flow, because of the saturation of decorrelation values in large vessels with fast velocities. Vessel density is the percent area of pixels with decorrelation values above a threshold defined as 2 standard deviations (SDs) above noise at the foveal avascular zone.
Statistical Analysis
Statistical analysis was performed using Microsoft Excel 2013 (Microsoft Office, Microsoft Corporation, Redmond, WA) and SPSS v. 24.0 (IBM Corporation, Armonk, NY). A paired t test was used to compare heart rate (HR) and mean arterial pressure (MAP) between baseline and hyperoxia. The 2 consecutive scan sets (if both were included) were averaged for each scan session. The parafoveal inner retinal flow index and vessel density in the 3 vascular plexuses and inner retina were presented as mean and SD of all baseline and hyperoxia scan sets from all scan sessions. The Wilcoxon signed-rank test was used to compare baseline and hyperoxic flow index and vessel density. Change in these measurements during hyperoxia was calculated as the average change and standard deviation of all participants during both testing days. Coefficient of variation and intraclass correlation coefficient with 95% confidence interval were used to measure within-session baseline repeatability. Between-day hyperoxic response reproducibility was measured using pooled SD after averaging the measurements of the 2 scans in each scan session.
Results
Nine participants (3 female and 6 male participants; average age, 27.2±5.2 years) were enrolled and scanned on day 1. Eight participants were scanned on both days. A total of 67 scans were acquired; 7 were excluded because of motion artifact. No participants or scan sessions were excluded from the study. The average HRs for baseline and hyperoxia were 73.5±3.1 and 72.5±7.46 beats per minute, respectively. The average MAPs were 84.5±8.9 and 81.0±7.5 mmHg for baseline and hyperoxia, respectively. There was no significant difference between the 2 conditions in HR or MAP (t test, P > 0.05).
Projection-resolved OCTA showed good within-session repeatability in baseline flow index and vessel density measurements in all retinal vascular plexuses (Table 1). Generally, the flow index has larger measurement variability than vessel density as measured by the coefficient of variation and intraclass correlation coefficient. For most plexuses, the population variation of baseline measurements tended to be smaller for the vessel density compared with the flow index (Table 1). Both flow index and vessel density declined after breathing oxygen in most plexuses. This hyperoxic response was statistically significant (P < 0.001) in the DCP but not in the SVC or ICP. The hyperoxic response was larger for the flow index relative to the vessel density. However, the population variability of the hyperoxic response was also proportionally larger for the flow index. The decrease in flow signal in response to hyperoxia could be directly appreciated on the en face PR-OCT angiograms of the DCP (Fig 2).
Table 1.
Flow Index and Vessel Density of Retinal Plexuses at Baseline and after Hyperoxia
| Baseline* | Hyperoxia* | P Value† | Hyperoxic Response (% Change)* | Within-Session Baseline Repeatability
|
||
|---|---|---|---|---|---|---|
| Coefficient of Variation | ICC (95% CI) | |||||
| All-Plexus | ||||||
| Flow Index | 0.0783±0.0100 | 0.0753±0.0091 | 0.015 | −3.5±6.1 | 3.4% | 0.93 (0.81–0.98) |
| Vessel Density | 93.0±4.56 | 92.7±4.45 | 0.69 | −0.3±1.5 | 0.8% | 0.96 (0.90–0.99) |
| SVC | ||||||
| Flow Index | 0.0575±0.0068 | 0.0564±0.0065 | 0.36 | −1.6±5.9 | 3.2% | 0.93 (0.80–0.98) |
| Vessel Density | 77.3±8.33 | 77.2±7.93 | 0.62 | 0.2±4.1 | 2% | 0.95 (0.85–0.98) |
| ICP | ||||||
| Flow Index | 0.0372±0.0061 | 0.0360±0.0053 | 0.15 | −2.7±6.4 | 3.6% | 0.96 (0.89–0.99) |
| Vessel Density | 47.8±4.71 | 47.2±4.22 | 0.06 | −1.0±2.2 | 1.7% | 0.98 (0.94–0.99) |
| DCP | ||||||
| Flow Index | 0.0276±0.0065 | 0.0244±0.0057 | <0.001 | −11.0±9.3 | 5.2% | 0.95 (0.86–0.98) |
| Vessel Density | 35.3±6.20 | 32.5±5.84 | <0.001 | −7.8±6.8 | 3.3% | 0.96 (0.90–0.99) |
CI = confidence interval; DCP = deep capillary plexus; ICC = intraclass correlation coefficient; ICP = intermediate capillary plexus; SVC = superficial vascular complex.
Boldface indicates statistical significance.
Baseline, hyperoxia, and hyperoxic response measurements were averaged from both days and presented in population mean ± standard deviation.
P values are based on the Wilcoxon signed-rank test.
Figure 2.
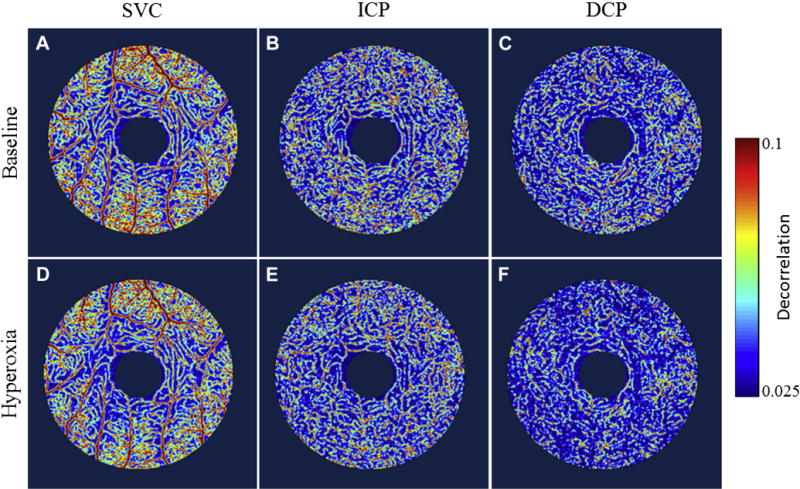
En face angiograms of superficial, intermediate, and deep parafoveal vascular plexuses of the same participant A–C, during baseline scan session and D–F, after hyperoxia. Note the difference in flow signal (color scale) and vessel density between baseline and hyperoxia. The decrease is visually apparent in the deep capillary plexus (DCP) but not in the superficial vascular complex (SVC) or intermediate capillary plexus (ICP).
A consistent reduction of flow index and vessel density in the deep plexus was observed in almost all participants on both days (Fig 3). However, the magnitude of response can change between days, as evidenced by the relatively large between-day response reproducibility (Table 2). For both vessel density and flow index, the variability in the hyperoxic response was approximately twice that of the repeatability of the baseline measurements. Thus, the response variability is partially but not entirely explained by measurement noise.
Figure 3.
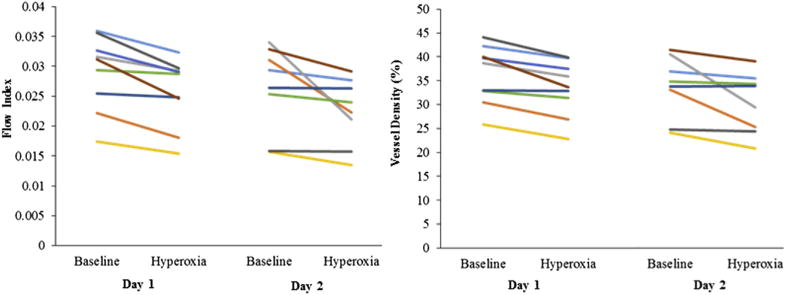
Deep vascular plexus hyperoxic response in flow index (left) and vessel density (right) for each participant on both days.
Table 2.
Average, Range, and Reproducibility of Hyperoxic Response on Both Days
| Day 1
|
Day 2
|
Between-Day Response Reproducibility† | |||
|---|---|---|---|---|---|
| Average (% Change)* | Range | Average (% Change)* | Range | ||
| All-Plexus | |||||
| Flow Index | −3.2 | −9.8 to 1.5 | −3.7 | −22.6 to 3.1 | 7.1 |
| Vessel Density | −0.3 | −2.4 to 1.5 | −0.4 | −4.2 to 1.2 | 1.7 |
| SVC | |||||
| Flow Index | −1.2 | −8.1 to 3.7 | −1.7 | −20.6 to 5.1 | 6.8 |
| Vessel Density | 0.2 | −4.3 to 6.6 | −0.4 | −10.1 to 4.4 | 4.3 |
| ICP | |||||
| Flow Index | −3.0 | −9.6 to 2.1 | −2.0 | −21.6 to 5.4 | 7.2 |
| Vessel Density | −1.8 | −3.6 to −0.3 | −0.3 | −4.9 to 3.0 | 2.1 |
| DCP | |||||
| Flow Index | −11.2 | −21.2 to −2.0 | −10.8 | −38.1 to −0.6 | 9.4 |
| Vessel Density | −8.3 | −16.0 to −0.6 | −7.5 | −27.3 to 0.2 | 6.2 |
DCP = deep capillary plexus; ICP = intermediate capillary plexus; SVC = superficial vascular complex.
Hyperoxic response is measured in units of percent change from baseline.
Between-day response reproducibility is measured by pooled standard deviation.
Discussion
Autoregulatory mechanisms ensure a relatively constant supply of oxygen through a wide range of variation in blood oxygen content. Hyperoxia reduces retinal blood flow as measured by Doppler OCT,19 blue field entoptic technique,13,14 laser Doppler flowmetry,15 and laser Doppler velocimetry.16 In our previous OCTA investigation, we also found significant reductions in the flow index and vessel density in the inner retinal circulation around the optic disc.20
The retinal vascular autoregulation is actually more complicated than a uniform homeostatic response due to interactions with the choroid. The choroidal circulation is thought to provide relatively constant flow,33–36 whereas the retinal circulation varies in response to changes in partial pressure of oxygen (pO2).37 In recent animal hypoxia experiments by Yi et al, retinal blood flow increased so much that total oxygen extraction actually increased.27 Assuming that inner retinal oxygen consumption is constant during hypoxia,38 they hypothesized that the increase in retinal oxygen extraction must have been caused by increased need to supply the outer retina to compensate for the drop in oxygen flux from the choroidal circulation.27 This hypothesis is based on the fact that the avascular outer retina is supplied by both the retinal and choroidal circulations, which had been established by microelectrode oxygen tension measurements in animals.25,39,40
Based on the results by Yi et al,27 we further hypothesize that the autoregulatory vascular response to changes in oxygen concentration would be greatest in the DCP, which supplies the outer retina. Because the choroidal flow does not respond to pO2, the fraction of outer retina oxygenated by the choroid would change with its oxygen content, with the DCP flow overcompensating to cover the need. This hypothesis can now be directly tested using the PR-OCTA algorithm29 that could visualize and measure the DCP separately from the ICP and SVC. We expected to find that the DCP would have a greater reduction in flow index and vessel density during hyperoxia. The SVC and ICP blood flow should also be reduced, but to a much small extent, as they need only to maintain inner retinal oxygen flux.
Our expectations were confirmed by the experimental findings shown in this paper. The differences in hyperoxia-evoked autoregulation of blood flow between the 3 retinal vascular layers were striking. Hyperoxia induced significant reductions in the flow index and vessel density in the DCP. In contrast, the reduction of flow index and vessel density in the SVC and ICP were too small to be statistically significant. The explanation is that during oxygen breathing, the oxygen tension in the avascular outer retina increases26,36,41 due to greater supply from the choroidal circulation, which maintains constant flow despite greater pO2.33–35 Thus, to maintain steady oxygen flux in the outer retina, the DCP must compensate with greater vasoconstriction and reduced flow. This maintains the oxygen tension in the outer retina at a low-enough level to prevent potential damage from oxidative stress.42,43 The reduction in DCP flow would in turn reduce oxygen flux to the midretina and thereby blunt the response of ICP and SVC to systemic hyperoxia.
The changes we measured in the DCP and all-plexus slabs (11% and 3.5%, respectively) were in the flow index. Flow index is calculated by averaging the decorrelation value in the parafoveal region. Decorrelation is not linearly related to blood velocity—laboratory measurements using the current OCTA system showed that the decorrelation-velocity curve begins to flatten around 2 millimeters per second and reaches saturation at approximately 6 millimeters per second.44 Thus, the percentage reduction in flow index was expected to be smaller than the change in volumetric blood flow as measured by laser Doppler11 or Doppler OCT techniques.19
The differential regulation of capillary plexuses has been previously reported in the retina and cerebral cortex. Kornfield and Newman45 observed that flicker stimulation in rats can produce a much larger response in the retinal ICP than in the SCP and DCP. Similarly, observations in cortical vascular layers in response to sensory stimulation indicated greater increases in blood flow in the middle capillary layers.46 In contrast to arterioles and venules, capillaries lack smooth muscles in their walls. Thus, the mechanism by which capillaries can actively regulate their blood flow independently from the more superficial arteriolar layers is still not fully understood. Studies on the somatosensory cortex give evidence that pericytes might be responsible for blood flow regulation in capillaries.47 Contraction of pericytes in response to hyperoxia can produce constriction of deep capillaries, consequently increasing vessel wall resistance and decreasing blood flow. Moreover, the regulation of DCP blood flow might be happening at the level of precapillary sphincter or the penetrating arterioles connecting the ICP to the DCP.48
Prior to the development of PR-OCTA, it would have been difficult to noninvasively study the retinal plexuses. Classically, fluorescein angiography and indocyanine green angiography have been used to image the ocular circulation.49–51 However, these 2-dimensional imaging modalities cannot separate retinal and choroidal circulations, let alone resolve retinal plexuses.52,53 With the introduction of OCTA technology, 3-dimensional angiograms of the retinal and choroidal circulations could be separated.54,55 However, the retinal plexuses still could not be cleanly separated, due to the flow projection artifacts that project flow signal from the superficial retinal vessels onto the deeper structures.56 The projection artifacts would cause flow from the SVC and ICP to be projected onto the DCP,55,57 making it impossible to accurately measure flow and vessel density in the DCP.
The projection-resolved algorithm distinguishes between the true and false-positive flow signals by comparing the intensity-normalized decorrelation value in each voxel to all of the more superficial voxels in the same A-scan line, taking into account that projected signal is usually weaker than the true in situ source flow signal.29 This method effectively resolved the projection artifacts on both en face and cross-sectional angiograms and improved the axial resolution of OCTA, allowing for better visualization of the 3 parafoveal vascular plexuses with proper quantification of vessel density and flow index. PR-OCTA showed very good within-session repeatability for flow index and vessel density measurements for the inner retina as a whole. However, the repeatability for single plexuses, and particularly for the DCP, was slightly worse.
We observed a relatively large between-day variation in the hyperoxic response that could not be entirely explained by measurement error as reflected in within-session repeatability. The excess variability could be due to variations in the internal physiological state and environmental factors. To reliably measure the magnitude of individual hyperoxic response, it may be necessary to average response from several stimulus cycles.
Alterations to the hemodynamics of retinal circulation and its normal physiologic responses are suggested to be involved in the pathophysiology of multiple retinal diseases such as age-related macular degeneration, diabetic retinopathy, and branch retinal vein occlusion.5–7,37,58,59 Deep understanding of these associations can serve as a basis for future efforts of developing more effective and efficient diagnostic and therapeutic strategies. PR-OCTA can be useful in investigating autoregulation dysfunction in retinal diseases.
The main limitation in this pilot study is the small sample size. Additionally, our results were based on observations from a single time point after systemic hyperoxia had already been established. However, the hypothesis and findings at this stage are useful for designing larger studies to confirm the results and provide dynamic analysis of hyperoxic response in retinal microcirculation.
In summary, PR-OCTA demonstrated the capability of visualizing and measuring individual retinal plexuses, allowing for further physiological investigations. We reported a significant decrease of flow index in the retina in response to systemic hyperoxia. This response was found to be specifically caused by the change in the DCP but not the ICP or SVC, giving new evidence of the interplay between choroidal and retinal circulation in oxygenating the avascular outer retina.
Acknowledgments
This work was supported by grants R01 EY023285, DP3 DK104397, R01 EY024544, P30 EY010572 from the National Institutes of Health (Bethesda, MD), and by unrestricted departmental funding from Research to Prevent Blindness (New York, NY). The sponsor or funding organization had no role in the design or conduct of this research.
Abbreviations and Acronyms
- DCP
deep capillary plexus
- GCC
ganglion cell complex
- HR
heart rate
- ICP
intermediate capillary plexus
- ILM
inner limiting membrane
- INL
inner nuclear layer
- MAP
mean arterial pressure
- OCTA
OCT angiography
- OPL
outer plexiform layer
- SD
standard deviation
- SSADA
split-spectrum amplitude-decorrelation angiography
- SVC
superficial vascular complex
Footnotes
This material was orally presented in the Association for Research in Vision and Ophthalmology Annual Meeting, Baltimore, MD, May 7–11, 2017.
Financial Disclosures:
The authors have made the following disclosures: D.H.: Patent royalties — Carl Zeiss Meditec.
Other authors do not have financial interest in the subject of this article.
Conflict of Interest: Oregon Health & Science University (OHSU), Y.J., and D.H.: Significant financial interest in Optovue (Fremont, CA), a company that may have a commercial interest in the results of this research and technology. These potential conflicts of interest have been reviewed and managed by OHSU.
References
- 1.Vanderkooi JM, Erecinska M, Silver IA. Oxygen in mammalian tissue: methods of measurement and affinities of various reactions. Am J Physiol. 1991;260(6 Pt 1):C1131–C1150. doi: 10.1152/ajpcell.1991.260.6.C1131. [DOI] [PubMed] [Google Scholar]
- 2.Hill DW. The regional distribution of retinal circulation. Ann R Coll Surg Engl. 1977;59:470–475. [PMC free article] [PubMed] [Google Scholar]
- 3.Rassam SM, Patel V, Chen HC, Kohner EM. Regional retinal blood flow and vascular autoregulation. Eye (Lond) 1996;10(Pt 3):331–337. doi: 10.1038/eye.1996.69. [DOI] [PubMed] [Google Scholar]
- 4.Guyton AC, Carrier O, Jr, Walker JR. Evidence for tissue oxygen demand as the major factor causing autoregulation. Circ Res. 1964;15(SUPPL):60–69. [PubMed] [Google Scholar]
- 5.Friedman E. A hemodynamic model of the pathogenesis of age-related macular degeneration. Am J Ophthalmol. 1997;124:677–682. doi: 10.1016/s0002-9394(14)70906-7. [DOI] [PubMed] [Google Scholar]
- 6.Schmetterer L, Wolzt M. Ocular blood flow and associated functional deviations in diabetic retinopathy. Diabetologia. 1999;42:387–405. doi: 10.1007/s001250051171. [DOI] [PubMed] [Google Scholar]
- 7.Kohner EM, Patel V, Rassam SM. Role of blood flow and impaired autoregulation in the pathogenesis of diabetic retinopathy. Diabetes. 1995;44:603–607. doi: 10.2337/diab.44.6.603. [DOI] [PubMed] [Google Scholar]
- 8.Pemp B, Schmetterer L. Ocular blood flow in diabetes and age-related macular degeneration. Can J Ophthalmol. 2008;43:295–301. doi: 10.3129/i08-049. [DOI] [PubMed] [Google Scholar]
- 9.Gilmore ED, Hudson C, Nrusimhadevara RK, et al. Retinal arteriolar diameter, blood velocity, and blood flow response to an isocapnic hyperoxic provocation in early sight-threatening diabetic retinopathy. Invest Ophthalmol Vis Sci. 2007;48:1744–1750. doi: 10.1167/iovs.06-1016. [DOI] [PubMed] [Google Scholar]
- 10.Remsch H, Spraul CW, Lang GK, Lang GE. Changes of retinal capillary blood flow in age-related maculopathy. Graefes Arch Clin Exp Ophthalmol. 2000;238:960–964. doi: 10.1007/s004170000202. [DOI] [PubMed] [Google Scholar]
- 11.Cheng RW, Yusof F, Tsui E, et al. Relationship between retinal blood flow and arterial oxygen. J Physiol. 2016;594:625–640. doi: 10.1113/JP271182. [DOI] [PMC free article] [PubMed] [Google Scholar]
- 12.Lange CA, Bainbridge JW. Oxygen sensing in retinal health and disease. Ophthalmologica. 2012;227:115–131. doi: 10.1159/000331418. [DOI] [PubMed] [Google Scholar]
- 13.Fallon TJ, Maxwell D, Kohner EM. Retinal vascular autoregulation in conditions of hyperoxia and hypoxia using the blue field entoptic phenomenon. Ophthalmology. 1985;92:701–705. doi: 10.1016/s0161-6420(85)33978-7. [DOI] [PubMed] [Google Scholar]
- 14.Fallon TJ, Maxwell D, Kohner EM. Measurement of autoregulation of retinal blood flow using the blue field entoptic phenomenon. Trans Ophthalmol Soc UK. 1985;104(Pt 8):857–860. [PubMed] [Google Scholar]
- 15.Strenn K, Menapace R, Rainer G, et al. Reproducibility and sensitivity of scanning laser Doppler flowmetry during graded changes in PO2. Br J Ophthalmol. 1997;81:360–364. doi: 10.1136/bjo.81.5.360. [DOI] [PMC free article] [PubMed] [Google Scholar]
- 16.Riva CE, Grunwald JE, Sinclair SH. Laser Doppler velocimetry study of the effect of pure oxygen breathing on retinal blood flow. Invest Ophthalmol Vis Sci. 1983;24:47–51. [PubMed] [Google Scholar]
- 17.Bower BA, Zhao M, Zawadzki RJ, Izatt JA. Real-time spectral domain Doppler optical coherence tomography and investigation of human retinal vessel autoregulation. J Biomed Opt. 2007;12:041214. doi: 10.1117/1.2772877. [DOI] [PubMed] [Google Scholar]
- 18.Pechauer AD, Huang D, Jia Y. Detecting blood flow response to stimulation of the human eye. Biomed Res Int. 2015;2015:121973. doi: 10.1155/2015/121973. [DOI] [PMC free article] [PubMed] [Google Scholar]
- 19.Pechauer AD, Tan O, Liu L, et al. Retinal blood flow response to hyperoxia measured with en face Doppler optical coherence tomography. Invest Ophthalmol Vis Sci. 2016;57:OCT141–OCT145. doi: 10.1167/iovs.15-18917. [DOI] [PMC free article] [PubMed] [Google Scholar]
- 20.Pechauer AD, Jia Y, Liu L, et al. Optical coherence tomography angiography of peripapillary retinal blood flow response to hyperoxia. Invest Ophthalmol Vis Sci. 2015;56:3287–3291. doi: 10.1167/iovs.15-16655. [DOI] [PMC free article] [PubMed] [Google Scholar]
- 21.Jia Y, Tan O, Tokayer J, et al. Split-spectrum amplitude-decorrelation angiography with optical coherence tomography. Opt Express. 2012;20:4710–4725. doi: 10.1364/OE.20.004710. [DOI] [PMC free article] [PubMed] [Google Scholar]
- 22.Provis JM. Development of the primate retinal vasculature. Prog Retin Eye Res. 2001;20:799–821. doi: 10.1016/s1350-9462(01)00012-x. [DOI] [PubMed] [Google Scholar]
- 23.Snodderly DM, Weinhaus RS. Retinal vasculature of the fovea of the squirrel monkey, Saimiri sciureus: three-dimensional architecture, visual screening, and relationships to the neuronal layers. J Comp Neurol. 1990;297:145–163. doi: 10.1002/cne.902970111. [DOI] [PubMed] [Google Scholar]
- 24.Tan PE, Yu PK, Balaratnasingam C, et al. Quantitative confocal imaging of the retinal microvasculature in the human retina. Invest Ophthalmol Vis Sci. 2012;53:5728–5736. doi: 10.1167/iovs.12-10017. [DOI] [PubMed] [Google Scholar]
- 25.Yu DY, Cringle SJ. Oxygen distribution and consumption within the retina in vascularised and avascular retinas and in animal models of retinal disease. Prog Retin Eye Res. 2001;20:175–208. doi: 10.1016/s1350-9462(00)00027-6. [DOI] [PubMed] [Google Scholar]
- 26.Linsenmeier RA, Yancey CM. Effects of hyperoxia on the oxygen distribution in the intact cat retina. Invest Ophthalmol Vis Sci. 1989;30:612–618. [PubMed] [Google Scholar]
- 27.Yi J, Liu W, Chen S, et al. Visible light optical coherence tomography measures retinal oxygen metabolic response to systemic oxygenation. Light Sci Appl. 2015;4:e334. doi: 10.1038/lsa.2015.107. [DOI] [PMC free article] [PubMed] [Google Scholar]
- 28.Lau JC, Linsenmeier RA. Oxygen consumption and distribution in the Long-Evans rat retina. Exp Eye Res. 2012;102:50–58. doi: 10.1016/j.exer.2012.07.004. [DOI] [PMC free article] [PubMed] [Google Scholar]
- 29.Zhang M, Hwang TS, Campbell JP, et al. Projection-resolved optical coherence tomographic angiography. Biomed Opt Express. 2016;7:816–828. doi: 10.1364/BOE.7.000816. [DOI] [PMC free article] [PubMed] [Google Scholar]
- 30.Zhang M, Wang J, Pechauer AD, et al. Advanced image processing for optical coherence tomographic angiography of macular diseases. Biomed Opt Express. 2015;6:4661–4675. doi: 10.1364/BOE.6.004661. [DOI] [PMC free article] [PubMed] [Google Scholar]
- 31.Jia Y, Bailey ST, Hwang TS, et al. Quantitative optical coherence tomography angiography of vascular abnormalities in the living human eye. Proc Natl Acad Sci USA. 2015;112:E2395–E2402. doi: 10.1073/pnas.1500185112. [DOI] [PMC free article] [PubMed] [Google Scholar]
- 32.Gao M, Wang H, Ma M, et al. Optimization of a phase separation based magnetic-stirring salt-induced liquid-liquid microextraction method for determination of fluoroquinolones in food. Food Chem. 2015;175:181–188. doi: 10.1016/j.foodchem.2014.11.132. [DOI] [PubMed] [Google Scholar]
- 33.Wangsa-Wirawan ND, Linsenmeier RA. Retinal oxygen: fundamental and clinical aspects. Arch Ophthalmol. 2003;121:547–557. doi: 10.1001/archopht.121.4.547. [DOI] [PubMed] [Google Scholar]
- 34.Delaey C, Van De Voorde J. Regulatory mechanisms in the retinal and choroidal circulation. Ophthalmic Res. 2000;32:249–256. doi: 10.1159/000055622. [DOI] [PubMed] [Google Scholar]
- 35.Geiser MH, Riva CE, Dorner GT, et al. Response of choroidal blood flow in the foveal region to hyperoxia and hyperoxia-hypercapnia. Curr Eye Res. 2000;21:669–676. [PubMed] [Google Scholar]
- 36.Linsenmeier RA, Zhang HF. Retinal oxygen: from animals to humans. Prog Retin Eye Res. 2017;58:115–151. doi: 10.1016/j.preteyeres.2017.01.003. [DOI] [PMC free article] [PubMed] [Google Scholar]
- 37.Pournaras CJ, Rungger-Brandle E, Riva CE, et al. Regulation of retinal blood flow in health and disease. Prog Retin Eye Res. 2008;27:284–330. doi: 10.1016/j.preteyeres.2008.02.002. [DOI] [PubMed] [Google Scholar]
- 38.Linsenmeier RA, Braun RD. Oxygen distribution and consumption in the cat retina during normoxia and hypoxemia. J Gen Physiol. 1992;99:177–197. doi: 10.1085/jgp.99.2.177. [DOI] [PMC free article] [PubMed] [Google Scholar]
- 39.Ahmed J, Braun RD, Dunn R, Jr, Linsenmeier RA. Oxygen distribution in the macaque retina. Invest Ophthalmol Vis Sci. 1993;34:516–521. [PubMed] [Google Scholar]
- 40.Haugh LM, Linsenmeier RA, Goldstick TK. Mathematical models of the spatial distribution of retinal oxygen tension and consumption, including changes upon illumination. Ann Biomed Eng. 1990;18:19–36. doi: 10.1007/BF02368415. [DOI] [PubMed] [Google Scholar]
- 41.Cringle SJ, Yu DY. A multi-layer model of retinal oxygen supply and consumption helps explain the muted rise in inner retinal PO(2) during systemic hyperoxia. Comp Biochem Physiol A Mol Integr Physiol. 2002;132:61–66. doi: 10.1016/s1095-6433(01)00530-x. [DOI] [PubMed] [Google Scholar]
- 42.Zhu Y, Valter K, Stone J. Environmental damage to the retina and preconditioning: contrasting effects of light and hyperoxic stress. Invest Ophthalmol Vis Sci. 2010;51:4821–4830. doi: 10.1167/iovs.09-5050. [DOI] [PubMed] [Google Scholar]
- 43.Geller S, Krowka R, Valter K, Stone J. Toxicity of hyperoxia to the retina: evidence from the mouse. Adv Exp Med Biol. 2006;572:425–437. doi: 10.1007/0-387-32442-9_60. [DOI] [PubMed] [Google Scholar]
- 44.Su JP, Chandwani R, Gao SS, et al. Calibration of optical coherence tomography angiography with a microfluidic chip. J Biomed Opt. 2016;21:86015. doi: 10.1117/1.JBO.21.8.086015. [DOI] [PMC free article] [PubMed] [Google Scholar]
- 45.Kornfield TE, Newman EA. Regulation of blood flow in the retinal trilaminar vascular network. J Neurosci. 2014;34:11504–11513. doi: 10.1523/JNEUROSCI.1971-14.2014. [DOI] [PMC free article] [PubMed] [Google Scholar]
- 46.Goense J, Merkle H, Logothetis NK. High-resolution fMRI reveals laminar differences in neurovascular coupling between positive and negative BOLD responses. Neuron. 2012;76:629–639. doi: 10.1016/j.neuron.2012.09.019. [DOI] [PMC free article] [PubMed] [Google Scholar]
- 47.Hall CN, Reynell C, Gesslein B, et al. Capillary pericytes regulate cerebral blood flow in health and disease. Nature. 2014;508:55–60. doi: 10.1038/nature13165. [DOI] [PMC free article] [PubMed] [Google Scholar]
- 48.Fernandez-Klett F, Offenhauser N, Dirnagl U, et al. Pericytes in capillaries are contractile in vivo, but arterioles mediate functional hyperemia in the mouse brain. Proc Natl Acad Sci USA. 2010;107:22290–22295. doi: 10.1073/pnas.1011321108. [DOI] [PMC free article] [PubMed] [Google Scholar]
- 49.Novotny HR, Alvis DL. A method of photographing fluorescence in circulating blood in the human retina. Circulation. 1961;24:82–86. doi: 10.1161/01.cir.24.1.82. [DOI] [PubMed] [Google Scholar]
- 50.Flower RW, Hochheimer BF. Indocyanine green dye fluorescence and infrared absorption choroidal angiography performed simultaneously with fluorescein angiography. Johns Hopkins Med J. 1976;138:33–42. [PubMed] [Google Scholar]
- 51.Flower RW, Hochheimer BF. Clinical infrared absorption angiography of the choroid. Am J Ophthalmol. 1972;73:458–459. doi: 10.1016/0002-9394(72)90079-7. [DOI] [PubMed] [Google Scholar]
- 52.Spaide RF, Klancnik JM, Jr, Cooney MJ. Retinal vascular layers imaged by fluorescein angiography and optical coherence tomography angiography. JAMA Ophthalmol. 2015;133:45–50. doi: 10.1001/jamaophthalmol.2014.3616. [DOI] [PubMed] [Google Scholar]
- 53.Mendis KR, Balaratnasingam C, Yu P, et al. Correlation of histologic and clinical images to determine the diagnostic value of fluorescein angiography for studying retinal capillary detail. Invest Ophthalmol Vis Sci. 2010;51:5864–5869. doi: 10.1167/iovs.10-5333. [DOI] [PubMed] [Google Scholar]
- 54.Makita S, Hong Y, Yamanari M, et al. Optical coherence angiography. Opt Express. 2006;14:7821–7840. doi: 10.1364/oe.14.007821. [DOI] [PubMed] [Google Scholar]
- 55.Gao SS, Jia Y, Zhang M, et al. Optical coherence tomography angiography. Invest Ophthalmol Vis Sci. 2016;57:OCT27–OCT36. doi: 10.1167/iovs.15-19043. [DOI] [PMC free article] [PubMed] [Google Scholar]
- 56.Spaide RF, Fujimoto JG, Waheed NK. Image artifacts in optical coherence tomography angiography. Retina. 2015;35:2163–2180. doi: 10.1097/IAE.0000000000000765. [DOI] [PMC free article] [PubMed] [Google Scholar]
- 57.Coscas F, Glacet-Bernard A, Miere A, et al. Optical coherence tomography angiography in retinal vein occlusion: evaluation of superficial and deep capillary plexa. Am J Ophthalmol. 2016;161:160–171. e1–e2. doi: 10.1016/j.ajo.2015.10.008. [DOI] [PubMed] [Google Scholar]
- 58.Hafez AS, Bizzarro RL, Lesk MR. Evaluation of optic nerve head and peripapillary retinal blood flow in glaucoma patients, ocular hypertensives, and normal subjects. Am J Ophthalmol. 2003;136:1022–1031. doi: 10.1016/s0002-9394(03)00632-9. [DOI] [PubMed] [Google Scholar]
- 59.Trick GL, Edwards P, Desai U, Berkowitz BA. Early super-normal retinal oxygenation response in patients with diabetes. Invest Ophthalmol Vis Sci. 2006;47:1612–1619. doi: 10.1167/iovs.05-0833. [DOI] [PubMed] [Google Scholar]