Abstract
Measuring the available coefficient of friction (ACOF) of a shoe-floor interface is influenced by the choice of normal force, shoe-floor angle and sliding speed. The purpose of this study was to quantify the quality of slip prediction models based on ACOF values measured across different testing conditions. A dynamic ACOF measurement device that tests entire footwear specimens (Portable Slip Simulator) was used. The ACOF was measured for nine different footwear-contaminant combinations with two levels of normal force, sliding speed and shoe-floor angle. These footwear-contaminant combinations were also used in human gait studies to quantify the required coefficient of friction (RCOF) and slip outcomes. The results showed that test conditions significantly influenced ACOF. The condition that best predicted slip risk during the gait studies was 250 N normal force, 17° shoe-floor angle, 0.5 m/s sliding speed. These findings can inform footwear slip-resistance measurement methods to improve design and prevent slips.
Keywords: Slip and fall accidents, Coefficient of friction, Footwear
1. Introduction
Falls on the same level due to slippery conditions are among the leading causes of fatal and non-fatal occupational injuries. Slips, trips and falls accounted for 27% of non-fatal (U.S. Department of Labor- Bureau of Labor Statistics, 2016b) and 16.5% of fatal occupational accidents in 2015 (U.S. Department of Labor- Bureau of Labor Statistics, 2016a). According to the 2017 Liberty Mutual Safety Index, falls on the same level were ranked second among the leading causes of disabling U.S. workplace injuries, cost businesses $10.62 billion in direct costs, and accounted for 17.7% of the overall national burden in 2014 (Liberty Mutual Research Institute for Safety, 2017). Slipperiness and slipping are among the primary factors responsible for falling events (Courtney et al., 2001).
A slip is likely to initiate when the friction required (as measured by the RCOF) to sustain gait is greater than the available friction at the contact between the footwear and floor (ACOF) (Burnfield & Powers, 2006; Hanson et al., 1999). ACOF is typically measured using a number of portable mechanical devices such as a drag slip-meter (Powers et al., 2007; Yamaguchi et al., 2015) and variable incidence tribometer (Burnfield & Powers, 2006; Powers et al., 2007); as well as whole-shoe tribometers like the Portable Slip Simulator (Aschan et al., 2005) and the SATRA STM 603 (Blanchette & Powers, 2015). RCOF is measured on dry surfaces by using a force plate during human gait (Beschorner et al., 2016; Cham & Redfern, 2002a; Chang et al., 2011; Hanson et al., 1999; Yamaguchi & Masani, 2016). Thus, a reduction in slipping events can typically be achieved by increasing the ACOF between a shoe and floor surface or reducing an individual’s RCOF.
Human risk of slips and falls have been evaluated by comparing measured ACOF with human slips. A logistic regression approach developed by Hanson et. al. (Hanson et al., 1999) has been broadly used in shoe-floor friction research to assess the empirical relationship between slip outcome and slip-testing measurements (Blanchette & Powers, 2015; Burnfield & Powers, 2006; Siegmund et al., 2006; Tsai & Powers, 2008). According to the logistic regression model, the difference between the ACOF and RCOF predicts the probability of slipping (Burnfield & Powers, 2006; Hanson et al., 1999; Siegmund et al., 2006). Moreover, Burnfield and Powers (Burnfield & Powers, 2006) and Seigmund, et al. (Siegmund et al., 2006) developed a logistic regression with ACOF as the only predictor of slip risk. Another approach has been used to rank surfaces of slipperiness by determining differences in unexpected slip rates across surfaces using a χ2 test (Powers et al., 2007). Rank-based approaches have been used to test if a slip-testing device can correctly rank and differentiate the level of slipperiness across these categories (Powers et al., 2007). One advantage of the logistic regression approach is its ability to quantify the goodness of fit using receiver operating characteristic curves (Beschorner et al., 2016) whereas rank based methods tend to have binary outcomes (i.e., pass/fail) (Powers et al., 2007).
Mechanical friction-testing devices generally fall into two groups: (1) portable devices that use a sample of footwear outsole as the specimen and exert low normal forces relative to human body mass (Burnfield & Powers, 2006; Chang et al., 2001a; DiDomenico et al., 2007), and (2) whole-shoe testers that use an entire footwear as the specimen and exert a wide range of normal forces, shoe-floor angles and sliding speeds (Aschan et al., 2005; Blanchette & Powers, 2015; Chang et al., 2001a; Redfern & Bidanda, 1994). Whole-shoe testers are often selected over portable devices when assessing footwear due to their ability to test an entire footwear outsole design and their ability to exert normal forces, shoe-floor angles and sliding speeds that approximate gait.
Measuring ACOF is dependent upon the normal force, shoe-floor angle, and the horizontal sliding speed. There is general agreement that the conditions of the test should be ‘biofidelic’ (i.e. match the biomechanical conditions that are found during walking) (Redfern et al., 2001). Biomechanical studies have reported values of these key parameters during the initiation of a slip (Table 1). Normal force (normalized to body weight) has been reported to be 24.5±13.4 % (Iraqi & Beschorner, 2017) and 64±16 % (Strandberg & Lanshammar, 1981) at the onset of slipping. Shoe-floor angle has been reported at heel contact as 28.2±3.0° (Chambers et al., 2002) and 25.3±5.4° (McGorry et al., 2010), and at slip initiation as 14.7° (Albert et al., 2017), 5.5±5.9° (Strandberg & Lanshammar, 1981), 1.5±0.6° in the case of a slip recovery and 2.2±1.8° for a slip leading to a fall (Cham & Redfern, 2002b). The horizontal sliding speed of the shoe is reported as 0.08–0.32 m/s (Strandberg & Lanshammar, 1981) and 0.27 m/s (Albert et al., 2017). However, few studies have compared different test parameters for their ability to predict slips based on ACOF using whole-shoe testers. This gap is evident in the literature, where a wide range of normal forces (40–810 N), shoe-floor angles (0–20°) and sliding speeds (0.01–0.5 m/s) are used for measuring ACOF (Aschan et al., 2005; ASTM F2913-11, 2011; Beschorner et al., 2007; Blanchette & Powers, 2015; Gronqvist et al., 2003; Grönqvist et al., 1989; Hanson et al., 1999; Menz et al., 2001; Redfern & Bidanda, 1994; Wilson, 1990). Since ACOF has a complex dependency on these testing parameters (Beschorner et al., 2007; Blanchette & Powers, 2015), finding the best set of conditions is important. Some research has used whole-shoe testers that are operated under different combinations of normal force, horizontal speed and shoe-floor angle, to predict slip outcome (Blanchette & Powers, 2015). However, the Blanchette and Powers’ study was limited to a single footwear-floor-contaminant condition (2015). Thus, more robust research is needed for identifying the levels of normal force, shoe-floor angle and horizontal sliding speed that best predicts human slip risk across different footwear-floor-contaminant conditions.
Table 1.
Normal forces, shoe-floor angles and sliding speeds reported by biomechanical studies during slip initiation.
| Study | Normal force (%BW) | Shoe-floor angle (°) | Sliding speed (m/s) |
|---|---|---|---|
|
| |||
| (Strandberg & Lanshammar, 1981) | 64±16 | 5.5±5.9 | 0.08–0.32 |
| (Cham & Redfern, 2002b) | NA | 1.5±0.6§, 2.2±1.8* | NA |
| (Albert et al., 2017) | NA | 14.7 | 0.27 |
| (Iraqi & Beschorner, 2017) | 24.5±13.4 | NA | NA |
at forward slipping during slip recovery;
at forward slipping for slip leading to a fall.
NA indicates that this variable was not reported for this study.
Previous efforts to validate slip-testing devices based on human slipping studies have primarily focused on differentiating slip risk across floors (Powers et al., 2007; Siegmund et al., 2006), and are commonly limited to one type (Blanchette & Powers, 2015; Burnfield & Powers, 2006; Powers et al., 2007; Siegmund et al., 2006) or two types (Tsai & Powers, 2008) of footwear. Gronqvist et. al. tested six pairs of boots and shoes (Gronqvist et al., 2003); however, they repeatedly slipped a small set of subjects (N=5). Multiple repeated slips within subjects may be inappropriate since subjects alter their gait when they anticipate a slipping incident (Cham & Redfern, 2002a). Studies that have included more than one design of footwear outsoles have shown differences in the ACOF across footwear indicating differences in slip rate would also be expected (Gronqvist et al., 2003; Jones et al., 2018; Tsai and Powers, 2008). Few efforts have been made to validate the ability of slip-testers to differentiate across footwear using human slipping data.
The primary purpose of this study was to investigate the impact of testing conditions on ACOF and quantify the prediction quality of ACOF values for predicting human slips across these testing conditions. We hypothesized that the biomechanical parameters will impact ACOF values and that ACOF as well as ACOF-RCOF values using different testing parameters would predict human slips. The study used an experimental design, where the footwear conditions and testing parameters were controlled, and was cross-sectional, where the human gait and slipping data were used from a single testing session. The goal is to quantify the validity of slip-resistance measurements and guide further development of methods that accurately evaluate footwear traction.
2. Materials and Methods
This study consisted of two components: ACOF measurements and gait experiments. ACOF measurements were conducted for nine footwear-floor-contaminant conditions using a whole-shoe tester. In the gait experiment, between eight and nineteen subjects walked across dry and liquid-contaminated flooring per footwear-floor-contaminant condition.
2.1. Subjects
Biomechanical data from four previously published human gait and slipping studies were pooled (Beschorner et al., 2016; Chambers & Cham, 2007; Jones et al., 2018; Moyer et al., 2006). This data was for shoes S1, S3–S5, B1–B3, which are furthered described in Section 2.2 and Table 2. Data for additional footwear-contaminant conditions (S2T and S2NT, which are described in Section 2.2 and Table 2) were added to the study to improve statistical power and generalizability. The inclusion criteria were that the study involved young adults (18–35 years); an experimental protocol where the exposure to a liquid-contaminant occurred on a force plate; and there had to be at least three gait trials on a dry force plate prior to liquid-contaminant exposure where their left foot completely landed on the force plate (not on the edges). In total, there were data from 89 (35 female) subjects included in this study with a mean height of 174.4 ± 7.9 cm, body mass 71.8 ± 15.1 kg, age of 22.6 ± 3.7 years, and body mass index (BMI) of 23.5 ± 4.4. All studies used exclusion criteria of neurological, orthopaedic, cardiovascular, pulmonary abnormalities, as well as any problems hindering normal gait. Subjects provided informed consent prior to testing and the protocols were approved by the University of Pittsburgh Institutional Review Board.
Table 2.
Footwear-floor-contaminant conditions included in this study.
| Footwear | Shore A Hardness | Liquid contaminant | Floor |
|---|---|---|---|
|
| |||
| S1 | 61.0 (2.1) | 75% glycerol-25% water | Vinyl |
| S2T | 62.4 (3.2) | 90% glycerol-10% water | Vinyl |
| S2NT | 71.0 (1.9) | 90% glycerol-10% water | Vinyl |
| S3 | 56.2 (2.9) | Canola oil | Vinyl |
| S4 | 60.6 (3.0) | Canola oil | Vinyl |
| S5 | 48.6 (1.5) | Canola oil | Vinyl |
| B1 | 54.0 (5.8) | 50% glycerol-50% water | Vinyl |
| B2 | 70.4 (4.5) | 50% glycerol-50% water | Vinyl |
| B3 | 79.2 (4.8) | 50% glycerol-50% water | Vinyl |
2.2. Footwear, Floor and Contaminant Conditions
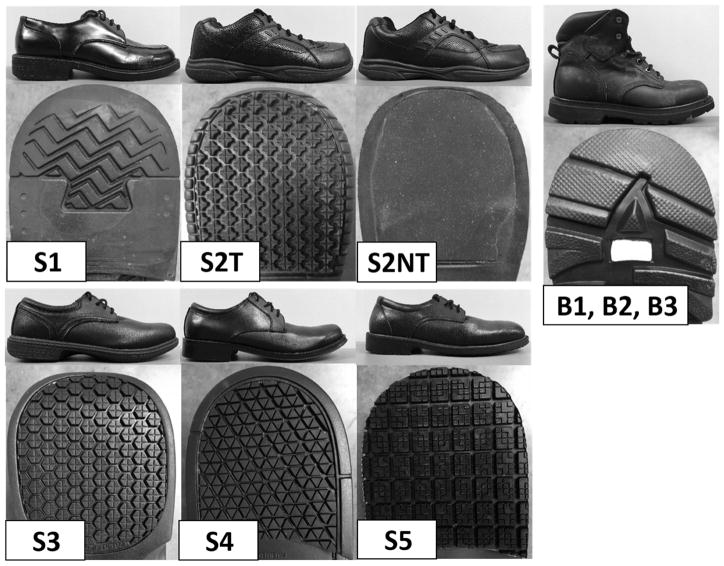
Six shoe and three boot outsole designs were used (Figure 1). All walking trials were conducted on a vinyl floor with diluted glycerol or canola oil surface contaminants (Table 2). The footwear included a standard work shoe (S1), five work shoes labeled as slip-resistant (S2T, S2NT, S3, S4 and S5) (Table 2). One of the slip-resistant shoes (S2T) had the tread intact while the other had the tread removed (S2NT). The three boots had identical tread designs but differed in the material hardness (Soft: B1, Medium: B2; and Hard: B3, Table 2). Between eight and nineteen subjects were exposed to a liquid contaminant for each of these conditions (Table 4). Shore A hardness was used to characterize the shoe/boot materials (ASTM D2240-15, 2015).
Figure 1.
Shoes and boots (including the outsole of the heel section) used for ACOF measurements and human testing protocol.
Table 4.
The number of subjects unexpectedly slipped (n), individual slip rate (95% confidence interval: CI) and mean RCOF (standard deviation) for each footwear.
| Footwear | n | Slip Rate % (CI) | RCOF |
|---|---|---|---|
|
| |||
| S1 | 19 | 42.1 (20.3–66.5) | 0.195 (0.034) |
| S2T | 8 | 0.0 (0.0–36.9) | 0.192 (0.026) |
| S2NT | 10 | 100.0 (69.2–100.0) | 0.180 (0.019) |
| S3 | 15 | 66.7 (38.4–88.2) | 0.213 (0.021) |
| S4 | 17 | 23.5 (6.8–49.9) | 0.200 (0.030) |
| S5 | 15 | 0.0 (0.0–21.8) | 0.198 (0.026) |
| B1 | 11 | 9.1 (0.2–41.3) | 0.198 (0.029) |
| B2 | 14 | 42.9 (17.7–71.1) | 0.211 (0.030) |
| B3 | 15 | 40.0 (16.3–67.7) | 0.201 (0.023) |
2.3. ACOF Measurement
The ACOF measurements were carried out using the Portable Slip Simulator (Aschan et al., 2005). The Portable Slip Simulator is a whole-shoe tester that can approximate the under-shoe conditions (i.e., forces, sliding speeds and angles) of slipping, is well described in the literature and is not based on proprietary technology (Figure 2). This device has the capability to simulate the under-shoe conditions immediately after heel strike, the flexibility to control the normal force (0–600 N), shoe-floor angle (0–30°) and sliding speed (0–1 m/s), and is capable of capturing ACOF within the 600 ms of shoe contact that is recommended for friction measurement (Chang et al., 2001b). This device has three parallel electromagnetic motors (LinMot®, Elkhorn, WI, USA) oriented vertically to apply normal force and a horizontal motor to slide the shoe across the floor (Aschan et al., 2005). A shoemaker’s last was mounted to the device to attach the shoe or boot. A 6DOF force plate (BERTEC Corporation, Columbus, OH, USA) was used to measure the ground reaction forces.
Figure 2.
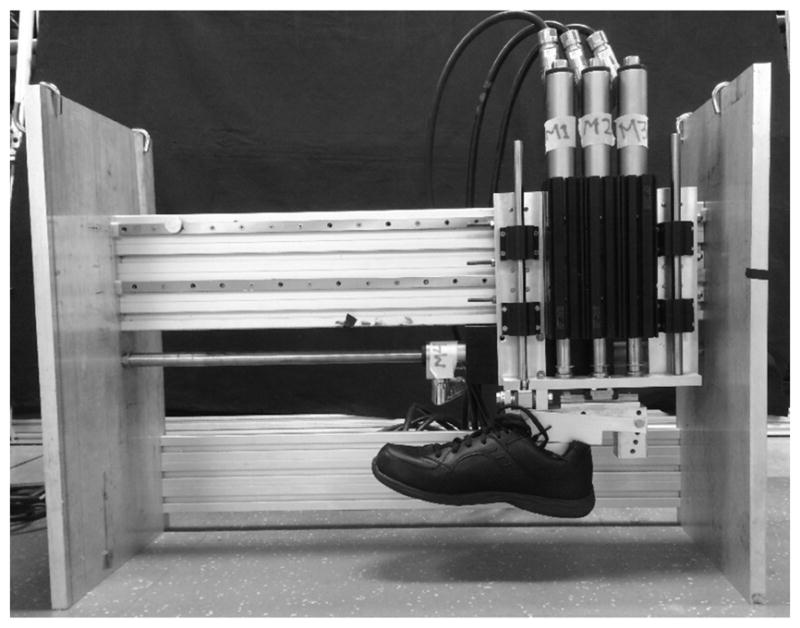
Portable Slip Simulator used for ACOF measurements.
The operating parameters were: normal forces of 250 N±10 N and 400 N±10 N, contact angles of 7±2° and 17±2°, and horizontal sliding speeds of 0.3 m/s and 0.5 m/s (Table 3). The average normal force of 250 N was selected based on one of the testing parameters used for Portable Slip Simulator by Aschan et. al. (Aschan et al., 2005) and because normal forces during slip initiation are typically less than 300 N (Iraqi & Beschorner, 2017). The 400 N normal force was selected based on the normal force recommended (400±20 N for US men’s shoe size < 7.5) to be applied for a whole-shoe tester to evaluate the slip performance between shoe and flooring (ASTM F2913-11, 2011).
Table 3.
Levels of testing parameters used in the study.
| Testing parameters | Levels |
|---|---|
|
| |
| Normal force (N) | 250, 400 |
| Shoe-floor angle (°) | 7, 17 |
| Sliding speed (m/s) | 0.3, 0.5 |
The 7° shoe-floor angle was chosen based upon the current ASTM standards (ASTM F2913-11, 2011) and, Strandberg and Lanshammar reported that actual human slips initiate when the shoe angle is at about 6° (Strandberg & Lanshammar, 1981). The steeper contact angle (17°) was added based on a recent analysis that showed the shoe-floor angle to be about 17° when the shoe begins to accelerate (i.e., slip start) during unexpected slipping trials (Albert et al., 2017).
The sliding speeds of 0.3 m/s and 0.5 m/s were selected based on ASTM standards (ASTM F2913-11, 2011) and the sliding speed (0.5 m/s) that best reduced bias of the SATRA STM 603 slip testing device (Blanchette & Powers, 2015). Both speeds are within the range of sliding speeds (0–1 m/s) recommended for friction measurement between the shoe-floor interface (Chang et al., 2001b).
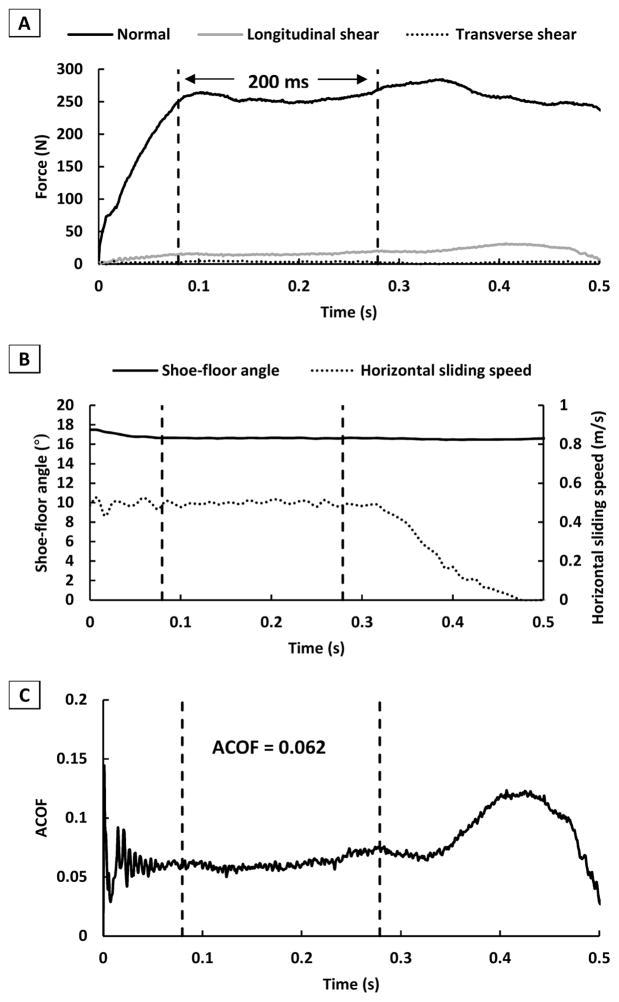
During the testing, the normal force profile reached a steady state within ±10% of the desired normal force (Figure 3A). The footwear was in motion at heel contact and the sliding speed was constant during the entire duration of contact. The shoe-floor angle and horizontal sliding speed were tracked using motion capture camera systems (Vicon T40S, Oxford, UK) (Figure 3B). All the footwear tested were US men’s shoe size 9. The fifteen repeated measurements were conducted across three separate days (five per day) for each testing condition.
Figure 3.
Example data collected from one trial with the Protable Slip Simulator at 250 N, 17° and 0.5 m/s: (A) Normal and shear force profiles; (B) shoe-floor angle and horizontal sliding speed; and (C) ACOF profile.
2.4. Human Testing Protocol
All of the human slip studies from which data were included in this analysis used the same slip protocol. Subjects donned a harness for safety purpose and were fitted with markers during data collection. Subjects were instructed to walk naturally with a self-selected comfortable pace. Subjects performed practice gait trials before data collection in order to become comfortable with the harness system and reflective markers. The lights were dimmed to conceal the slipperiness of the floor. The subject’s starting position was adjusted so that the subject’s left foot landed directly on a force plate. Prior to each trial, subjects listened to music, worked on a word puzzle and faced away from the walkway to distract them from the application of the contaminant.
Baseline walking trials on a dry surface were conducted on a level walkway equipped with force plates to measure ground reaction forces and a motion capture system to track subjects’ movement. Subjects performed at least three gait trials prior to the unexpected liquid-contaminant exposure trials. For studies that included multiple shoes/boots (Beschorner et al., 2016; Jones et al., 2018) (including S2T and S2NT) each subject completed two unexpected liquid-contaminated trials wearing a different set of footwear for each trial. For studies that used only one footwear type (Chambers & Cham, 2007; Moyer et al., 2006), only the first unexpected trial was considered for each subject. Slips were induced by unexpectedly placing a glycerol solution or canola oil (Table 2: for different fluid contaminants) on the floor surface without the subject’s knowledge. Subject’s heel marker was tracked to identify a slip. The kinematics data were recorded at a sampling rate of 120 Hz. The forces were recorded at a sampling rate of 1080 Hz and synchronized with kinematics data.
2.5. Data and Statistical Analyses
ACOF values were quantified as the average ratio of resultant shear force to normal force over 200 ms after achieving the normal force threshold (250 N or 400 N) (Aschan, Hirvonen et al. 2005) (Figure 3A and C) (Eq.1).
| Eq.1 |
RCOF was calculated to assess individual friction demands, while slip distance was used to assess slip outcomes. A slip distance of greater or equal to 3 cm was considered as the criterion for occurrence of a slip event (Albert et al., 2017; Beschorner et al., 2016; Leamon & Li, 1990). For RCOF calculation, the average of the three baseline dry walking trials prior to an unexpected liquid-contaminated trial was used. The RCOF calculation was based on the following criteria by Chang, et al. (Chang et al., 2011). First, the RCOF was considered for data with a normal force above a 100 N threshold. Second, the ground reaction force in the longitudinal direction had to be in the direction of gait at the instant of the RCOF. Once the first two criteria were attained, the third criterion was to exclude RCOF when the instantaneous RCOF was decreasing with time to bypass peak 1 (i.e. an artificially large COF instantly after heel contact), and peak 2 (i.e., a negative COF that corresponds to backward slip) (Chang et al., 2011). Marker data were filtered using a phaseless 4th order low-pass Butterworth filter with a cutoff frequency of 24 Hz. Heel contact was defined as the instant when the vertical component of ground reaction forces exceeded baseline force levels by 25 N. Slip initiation was identified as the first local minimum in speed after heel contact of a marker placed on the inferior-most point on the back of the heel (Lockhart et al., 2003; Strandberg & Lanshammar, 1981). Peak sliding speed was determined as the first local maximum occurring 50 ms after heel contact (Moyer et al., 2006). Slip distance was calculated between the time of slip initiation and the first local minimum after peak sliding speed. The slip distance was quantified based on the resultant slip distance including both the anterior/posterior and medial/lateral components. The second unexpected liquid-contaminated trial was excluded if the subjects either experienced a slip in the first unexpected liquid-contaminated trial or altered RCOF by more than 16% consistent with previous research (Albert et al., 2017). Subjects tend to change their RCOF by 16–32% when anticipating a slippery floor (Cham & Redfern, 2002a), which was the justification for this cutoff.
Logistic regression was used to model the effect of the ACOF (Eq.2A) and the difference between ACOF and RCOF (ACOF-RCOF) (Eq.2B) on slip risk. The dependent variable was the outcome of a slip event and the explanatory variables were either ACOF or ACOF-RCOF. A receiver operating characteristic (ROC) curve was generated for each logistic regression model with ACOF-RCOF as the predictor to quantify the optimal cutoffs for the sensitivity and specificity, and the area under the curve (AUC). A larger AUC typically indicates better sensitivity and specificity across the ROC. Odds ratio for each logistic regression model was calculated for a 0.01 increase in ACOF-RCOF from the regression coefficient β1 as a measure of effect size. An ANOVA was performed to test the effect of the independent variables: footwear type (S1, S2T, S2NT, S3, S4, S5, B1, B2, B3), normal force (250 and 400 N), shoe-floor angle (7 and 17°), sliding speed (0.3 and 0.5 m/s) and first order interactions on the ACOF (dependent variable). For interaction effects involving footwear, post-hoc t-tests were used with Bonferroni correction (α=0.05/9) to determine the shoes that were influenced by that testing parameter. A one-way ANOVA method was performed to test the effect of footwear type (independent variable) on RCOF (dependent variable). A post hoc Tukey HSD test was performed if a significant difference was identified for footwear type. All statistical analyses were performed using commercial software (JMP® Pro 12.1.0, SAS Institute Inc., Cary, NC, USA) with a significance level of 5%.
| Eq.2A |
| Eq.2B |
3. Results
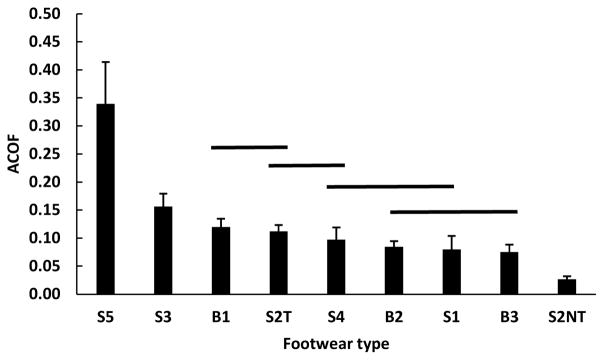
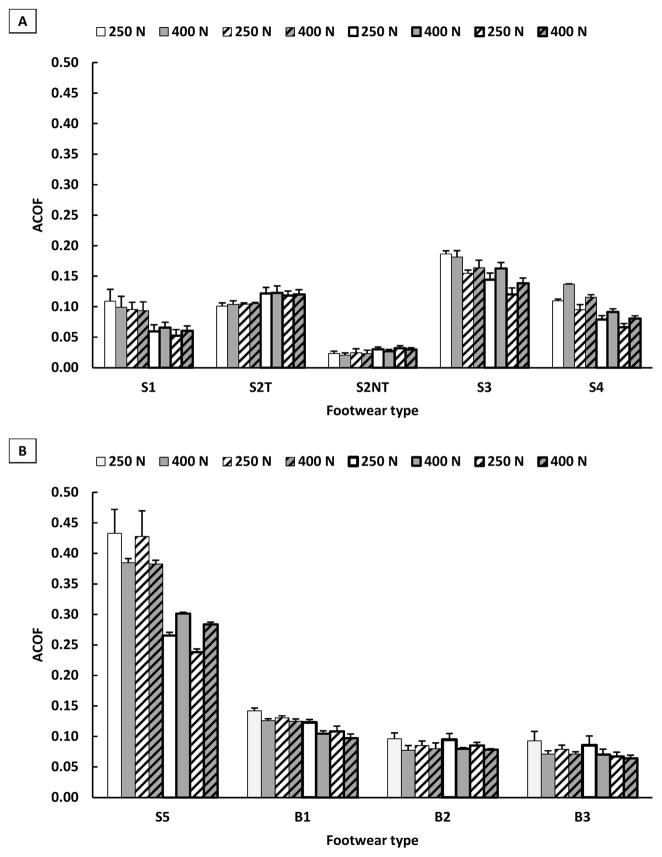
Slips occurred in 45 (36.3%) of the 124 unexpected liquid-contaminated trials. Individual slip rate across footwear conditions indicated that S2NT had the highest slip rate (100.0%) whereas S2T (0.0%) and S5 (0.0%) had the lowest slip rate (Table 4). The mean RCOF values were not significantly different (p = 0.127) across the footwear (Table 4). The mean ACOF across all the nine footwear-floor-contaminant conditions (Figure 4) were significantly different (p < 0.001, F8,33 = 548.8, ηpartial2 = 0.99), and ranged from a minimum ACOF of 0.021 (0.004) for S2NT with 400 N, 7°, 0.3 m/s as the testing parameters (Figure 5A) to a maximum ACOF of 0.433 (0.039) for S5 with 250 N, 7°, 0.3 m/s as the testing parameters (Figure 5B). The shoe-floor angle (p < 0.001, F1,33 = 115.2, ηpartial2 = 0.78) and sliding speed (p = 0.001, F1,33 = 12.4, ηpartial2 = 0.27) had a significant effect on ACOF. The normal force (p = 0.654, F1,33 = 0.2, ηpartial2 = 0.01) did not have a significant effect on ACOF. Among the first order interactions, footwear type*shoe-floor angle (p < 0.001, F8,33 = 34.7, ηpartial2 = 0.89) and shoe-floor angle*normal force (p = 0.024, F1,33 = 5.6, ηpartial2 = 0.15) had significant effects on ACOF. Other interactions were not significant. An increased shoe-floor angle reduced the ACOF values of S1, S3, S4 and S5 but had no effect on the other shoes. The post hoc Tukey test revealed significant differences across the nine types of footwear (Figure 4). Increased sliding speed was associated with a reduction in ACOF.
Figure 4.
Mean (standard deviation) ACOF across footwear (footwear not connected by same line are significantly different).
Figure 5.
ACOF across all the sets of testing parameters for each footwear condition: (A) S1, S2T, S2NT, S3 and S4 (B) S5, B1, B2 and B3.
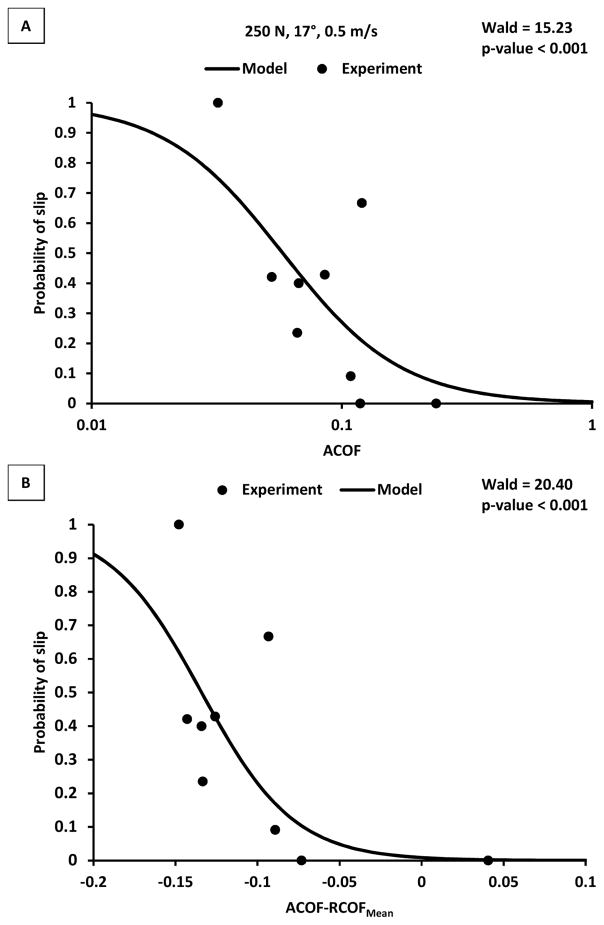
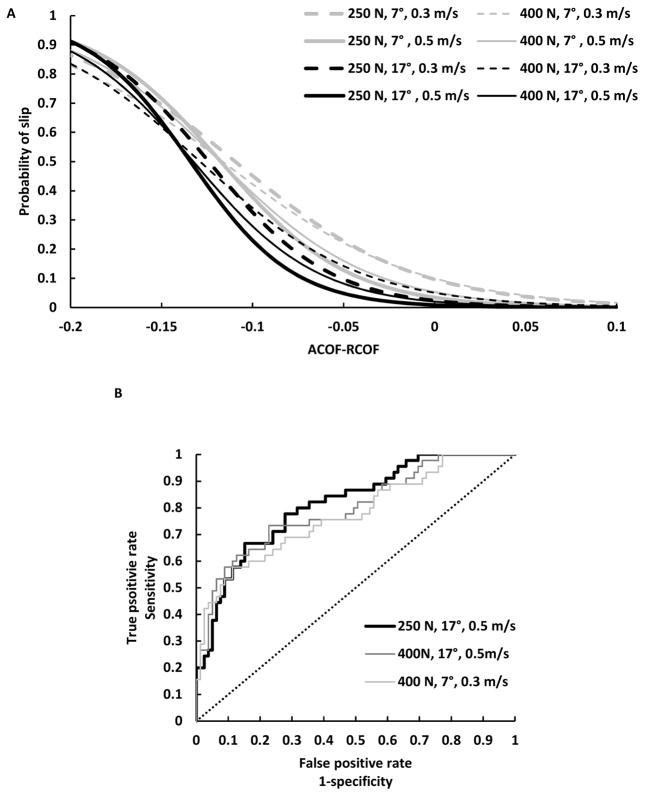
The logistic regression models indicated that both ACOF and ACOF-RCOF were significant predictors of slip risk for all sets of testing parameters (Table 5 and Table 6). ACOF-RCOF had higher Wald statistics (Wald = 14.54 to 20.40, p <0.001) than ACOF alone (Wald = 13.23 to 15.23, p <0.001). The set of testing parameters with the highest Wald statistic was 250 N, 17°, 0.5 m/s for both ACOF (Wald = 15.23, p < 0.001) (Figure 6A) and ACOF-RCOF (Wald = 20.40, p < 0.001) (Figure 6B). Furthermore, the second highest Wald statistic was for the test conditions of 250 N, 17°, 0.3 m/s for both ACOF (Wald = 15.18, p < 0.001) and ACOF-RCOF (Wald = 19.59, p < 0.001). The set of testing parameters with the lowest Wald statistics was 250 N, 7°, 0.3 m/s for both ACOF (Wald = 13.23, p < 0.001) and ACOF-RCOF (Wald = 14.54, p < 0.001). The ROC curves for the logistic regression models with ACOF-RCOF as the predictor showed that 250 N, 17°, 0.5 m/s had the maximum AUC of 0.815 (Table 6) (Figure 6C). The sensitivity and specificity at ACOF-RCOF at the optimal cutoff of −0.128 were 66.7% and 84.8%, respectively (Table 6). The ROC curves for the logistic regression models with ACOF-RCOF as the predictor indicated that 400 N, 7°, 0.3 m/s (Figure 7A) had the lowest AUC of 0.774 (Table 6 and Figure 7B).
Table 5.
Testing parameter sets sorted based on the Wald statistic of the logistic regression models with ACOF as the predictor (including beta values).
| Testing parameter set | Intercept β0 | ACOF β1 | Wald | p-value (Wald) |
|---|---|---|---|---|
|
| ||||
| 250 N, 17°, 0.5 m/s | −5.21 | −4.22 | 15.23 | <0.001 |
| 250 N, 17°, 0.3 m/s | −4.75 | −4.01 | 15.18 | <0.001 |
| 400 N, 7°, 0.3 m/s | −3.83 | −3.33 | 14.72 | <0.001 |
| 400 N, 7°, 0.5 m/s | −4.35 | −3.80 | 14.63 | <0.001 |
| 400 N, 17°, 0.5 m/s | −4.96 | −4.07 | 14.42 | <0.001 |
| 400 N, 17°, 0.3 m/s | −4.41 | −3.68 | 14.19 | <0.001 |
| 250 N, 7°, 0.5 m/s | −4.64 | −4.08 | 13.70 | <0.001 |
| 250 N, 7°, 0.3 m/s | −3.93 | −3.56 | 13.23 | <0.001 |
Table 6.
Testing parameter sets sorted based on the Wald statistic, and sensitivity (specificity) and AUC (95% confidence interval: CI) from ROC curves of the logistic regression models with ACOF-RCOF as the predictor (including beta values). Sensitivity and specificity were taken from the point of the ROC curve where the line most deviated from a line with slope of 1. Odds ratio (95% confidence interval: CI) were calculated for 0.01 increase in ACOF-RCOF.
| Testing parameter set | Intercept β0 | ACOF-RCOF β1 | Wald | p-value (Wald) | AUC (CI) | Sensitivity (Specificity) | Odds ratio (CI) |
|---|---|---|---|---|---|---|---|
|
| |||||||
| 250 N, 17°, 0.5 m/s | −4.76 | −35.46 | 20.40 | <0.001 | 0.815 (0.726–0.880) | 66.7 (84.8) | 0.70 (0.60–0.82) |
| 250 N, 17°, 0.3 m/s | −3.74 | −30.12 | 19.59 | <0.001 | 0.806 (0.713–0.875) | 66.7 (86.1) | 0.74 (0.65–0.85) |
| 250 N, 7°, 0.5 m/s | −3.34 | −28.43 | 18.40 | <0.001 | 0.804 (0.707–0.874) | 62.2 (92.4) | 0.75 (0.66–0.86) |
| 400 N, 17°, 0.5 m/s | −3.88 | −29.29 | 18.05 | <0.001 | 0.797 (0.700–0.868) | 73.3 (77.2) | 0.75 (0.65–0.85) |
| 400 N, 7°, 0.5 m/s | −2.88 | −24.44 | 17.48 | <0.001 | 0.791 (0.693–0.864) | 57.8 (92.4) | 0.78 (0.70–0.88) |
| 400 N, 17°, 0.3 m/s | −2.93 | −22.78 | 16.31 | <0.001 | 0.787 (0.685–0.863) | 73.3 (79.8) | 0.80 (0.71–0.89) |
| 400 N, 7°, 0.3 m/s | −2.20 | −18.88 | 15.86 | <0.001 | 0.774 (0.674–0.850) | 57.8 (88.6) | 0.83 (0.75–0.91) |
| 250 N, 7°, 0.3 m/s | −2.24 | −20.43 | 14.54 | <0.001 | 0.776 (0.670–0.855) | 55.6 (96.2) | 0.82 (0.73–0.91) |
Figure 6.
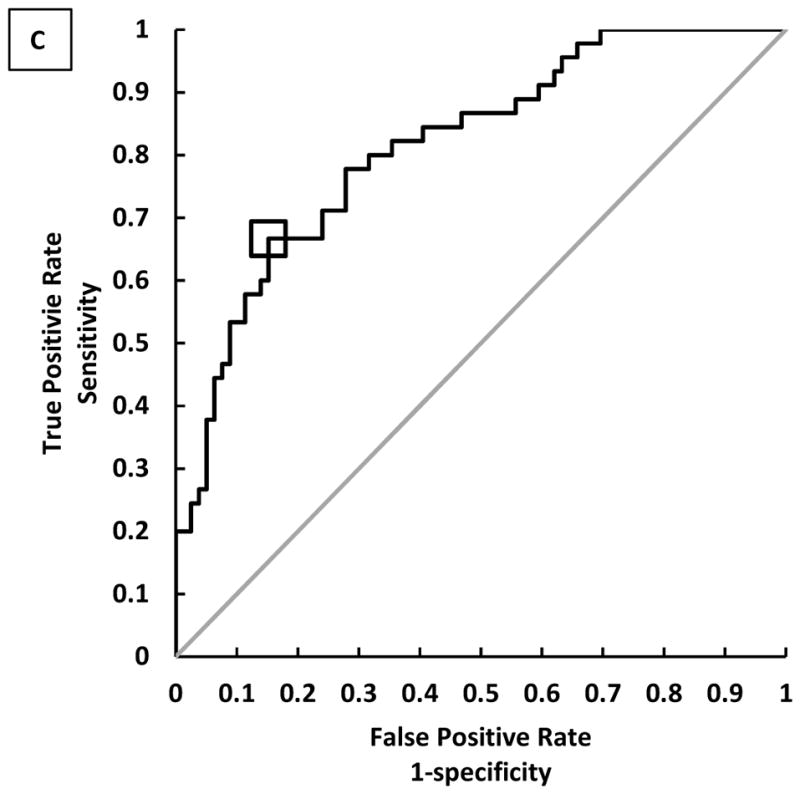
Logistic regression models with (A) ACOF and (B) ACOF-RCOF as the predictor and occurrence of a slip event as the outcome for 250 N, 17°, 0.5 m/s. (C) The ROC curve using ACOF-RCOF as the predictor for 250 N, 17°, 0.5 m/s. The black line represents the True Positive Rate-False Positive Rate curve and the gray line represents a slope of 1. The square symbol represents an optimal ACOF-RCOF cutoff of −0.128.
Figure 7.
(A) Logistic regression model for the eight ACOF testing parameter sets. (B) The ROC curve using ACOF-RCOF as the predictor for the highest (250 N, 17°, 0.5 m/s, AUC: 0.815), fourth highest (400 N, 17°, 0.5 m/s, AUC: 0.797) and lowest AUC (400 N, 7°, 0.3 m/s, AUC: 0.774). The dashed line represents a slope of 1.
4. Discussion
All of the testing parameter sets predicted slipping but the best test set for predicting slips was 250 N, 17°, 0.5 m/s. The next most predictive test set was 250 N, 17°, 0.3 m/s, which demonstrates the ability of using a normal force of 250 N and a shoe-floor angle of 17° to predict slips with this slip-tester. Based on an ACOF-RCOF cutoff of −0.128 for the 250 N, 17°, 0.5 m/s test set, the sensitivity and specificity were 66.7% and 84.8%, respectively.
The normal force (250 N) and shoe-floor angle (17°) from the best set (250 N, 17°, 0.5 m/s) were consistent with the state of heel at slip initiation reported by recent biomechanics studies. Specifically, the vertical component of ground reaction forces has been shown to be less than 300 N (Iraqi & Beschorner, 2017) and the shoe-floor angle has been reported as 14.7° (Albert et al., 2017) at the moment of slip initiation. Furthermore, the results were consistent with the previous research that ACOF (Burnfield & Powers, 2006; Siegmund et al., 2006) and ACOF-RCOF (Burnfield & Powers, 2006; Siegmund et al., 2006; Tsai & Powers, 2008) are significant predictors of slip risk for same level walking. Using the difference between ACOF and RCOF improved the slip prediction models, which is consistent with the previous findings (Burnfield & Powers, 2006; Siegmund et al., 2006).
The effect of testing parameters on ACOF was consistent with previous research that biomechanical factors affect ACOF (Beschorner et al., 2007; Blanchette & Powers, 2015; Redfern & Bidanda, 1994). The effect of shoe-floor angle (p < 0.001), sliding speed (p = 0.001) and shoe-floor angle*normal force (p = 0.024) on ACOF were in agreement with findings of Beschorner et al. (Beschorner et al., 2007). Beschorner et al. found that normal force had significant effect on ACOF. However, these effects were inconsistent and varied with shoe-floor angle and sliding speed. The lack of effect of normal force on ACOF was consistent with Redfern and Bidanda who reported that normal force levels (40–80 N) had small effects on ACOF (Redfern & Bidanda, 1994). Therefore, this research is consistent with other research demonstrating that shoe-floor angle and sliding speed have the greatest impact on ACOF.
Accurately evaluating the slip-resistance properties of footwear can guide footwear development. Footwear manufacturers use ACOF experiments to test and improve their footwear’s slip-resistance. Using a test that poorly predicts slip outcome may guide footwear designers toward suboptimal outsole designs. For example, the heel shape (e.g., bevel angle) may lead to different ACOF values at different shoe angles since it will influence contact area (Moghaddam & Beschorner, 2017). Therefore, using the conditions that best predict slips is likely to lead to improve footwear designs.
Results of this study suggest that certain test sets yield ACOF values that predict slips with better certainty than other tests sets. For instance, the test sets with the highest AUC (i.e., 250 N, 17°, 0.5 m/s) and lowest AUC (400 N, 7°, 0.3 m/s) predicted a similar slip rate at an ACOF-RCOF value of −0.2, i.e. 91.2% and 82.9%, respectively. However, at an ACOF-RCOF value of −0.08, the slip rate is over 20% higher for 400 N, 7°, 0.3 m/s (33.4%) than for 250 N, 17°, 0.5 m/s (12.8%). Moreover, 250 N, 17°, 0.5 m/s showed a sensitivity of 86.7% at a 50% specificity level whereas 400 N, 7°, 0.3 m/s showed a sensitivity of 75.6% at a 50% specificity level (Figure 7B). Thus, altering the test conditions can improve slip prediction certainty.
The slipping rate across the footwear-floor-contaminant conditions were supported by the ACOF values measured using the Portable Slip Simulator, suggesting that a lower ACOF at the footwear-floor interface will be associated with a higher slipping risk. However, the results from one of the shoes, S3, appeared to deviate from the trends observed for the other shoes (i.e., a relatively high ACOF as well as high slip rate). Certain factors may explain the surprisingly high slip rate for this shoe. First, while the RCOF values were not significantly different across footwear, S3 had the highest mean RCOF compared to the other footwear. RCOF is a sensitive predictor of slipping on moderately slippery surfaces (Beschorner et al., 2016). Second, subtle differences in biomechanical/gait parameters might exist due to the individual differences and footwear design, which may not be fully explained by RCOF. Third, random statistical variations might have overestimated the slip rate for S3. Thus, further biomechanical analysis during gait and slipping might be needed to better understand the complex interactions between slip outcome, an individual gait patterns, and footwear design.
Certain limitations of the study should be acknowledged. First, while the number of outsole-contaminated conditions were larger than any previous study to-date, they were still limited to nine conditions. More data from other conditions and parameters would improve our understanding of the best set or parameters under various conditions. Second, ACOF measurements were carried out only for footwear US men’s shoe size 9 and the effect of footwear size was not included in the study. Third, the normal force and shoe-floor angle were fixed within each ACOF trial. Biomechanical studies have shown that these variables change over time and mimicking these changes may improve prediction of slips. Lastly, this research may not apply to alternative footwear which are known to have different slipping biomechanics (Chander et al., 2015a, 2015b).
This study showed that the choice of testing parameters (normal force, shoe angle, and sliding speed) is important to obtaining measures that predict slips across different types of footwear and contaminants. Using a normal force of 250 N and a shoe-floor angle of 17° resulted in a predictive model that was sensitive and specific. The other testing conditions generated models that were predictive of slip too, but were less sensitive. The testing conditions have complex interactions with the footwear conditions. Specifically, an interaction effect between shoe-floor angle and shoe type on ACOF values indicates that this variable may be especially influential in determining a shoe’s performance. Using a set of testing parameters that predicts slips will likely lead to a better capability to create new footwear designs with better slip-resistance, resulting in a reduction in slip and fall injuries and deaths.
Highlights.
Ability of test methods to predict slips across footwear is not well understood.
Available coefficient of friction (ACOF) was measured using a whole-shoe tester.
Eight sets of test parameters were used for nine footwear-contaminant conditions.
Subjects walked on both dry and liquid-contaminated linear vinyl-walkway.
ACOF based on 250 N force, 17° angle, 0.5 m/s speed was the best predictor of slips.
Acknowledgments
Funding for this study was provided by the National Institute of Occupational Safety and Health (NIOSH R01 OH008986 and R01 OH007592), National Center for Research Resources (NCRR S10RR027102), Saf-Gard Safety Shoes® and the National Institute on Aging (NIA R44AG059258). Custom footwear provided by Timberland®.
Footnotes
Publisher's Disclaimer: This is a PDF file of an unedited manuscript that has been accepted for publication. As a service to our customers we are providing this early version of the manuscript. The manuscript will undergo copyediting, typesetting, and review of the resulting proof before it is published in its final citable form. Please note that during the production process errors may be discovered which could affect the content, and all legal disclaimers that apply to the journal pertain.
References
- Albert D, Moyer B, Beschorner KE. Three-Dimensional Shoe Kinematics During Unexpected Slips: Implications for Shoe–Floor Friction Testing. IISE Transactions on Occupational Ergonomics and Human Factors. 2017;5(1):1–11. [Google Scholar]
- Aschan C, Hirvonen M, Mannelin T, Rajamäki E. Development and validation of a novel portable slip simulator. Applied ergonomics. 2005;36(5):585–593. doi: 10.1016/j.apergo.2005.01.015. [DOI] [PubMed] [Google Scholar]
- ASTM D2240-15. Standard Test Method for Rubber Property - Durometer Hardness. ASTM International; West Conshohocken, PA: 2015. [Google Scholar]
- ASTM F2913-11. Annual Book of ASTM Standards. ASTM International; West Conshohocken, PA: 2011. Standard Test Method for Measuring the Coefficient of Friction for Evaluation of Slip Performance of Footwear and Test Surfaces/Flooring Using a Whole Shoe Tester. [Google Scholar]
- Beschorner KE, Albert DL, Redfern MS. Required coefficient of friction during level walking is predictive of slipping. Gait & posture. 2016;48:256–260. doi: 10.1016/j.gaitpost.2016.06.003. [DOI] [PubMed] [Google Scholar]
- Beschorner KE, Redfern MS, Porter WL, Debski RE. Effects of slip testing parameters on measured coefficient of friction. Applied ergonomics. 2007;38(6):773–780. doi: 10.1016/j.apergo.2006.10.005. [DOI] [PubMed] [Google Scholar]
- Blanchette MG, Powers CM. Slip prediction accuracy and bias of the SATRA STM 603 whole shoe tester. Journal of Testing and Evaluation. 2015;43(3):491–498. [Google Scholar]
- Burnfield JM, Powers CM. Prediction of slips: an evaluation of utilized coefficient of friction and available slip resistance. Ergonomics. 2006;49(10):982–995. doi: 10.1080/00140130600665687. [DOI] [PubMed] [Google Scholar]
- Cham R, Redfern MS. Changes in gait when anticipating slippery floors. Gait & posture. 2002a;15(2):159–171. doi: 10.1016/s0966-6362(01)00150-3. [DOI] [PubMed] [Google Scholar]
- Cham R, Redfern MS. Heel contact dynamics during slip events on level and inclined surfaces. Safety Science. 2002b;40(7):559–576. [Google Scholar]
- Chambers AJ, Cham R. Slip-related muscle activation patterns in the stance leg during walking. Gait & posture. 2007;25(4):565–572. doi: 10.1016/j.gaitpost.2006.06.007. [DOI] [PubMed] [Google Scholar]
- Chambers AJ, Margerum S, Redfern MS, Cham R. Kinematics of the foot during slips. Occupational Ergonomics. 2002;3(4):225–234. [Google Scholar]
- Chander H, Garner JC, Wade C. Ground Reaction Forces in Alternative Footwear during Slip Events. International Journal of Kinesiology & Sports Science. 2015a;3(2):1. [Google Scholar]
- Chander H, Garner JC, Wade C. Heel contact dynamics in alternative footwear during slip events. International Journal of Industrial Ergonomics. 2015b;48:158–166. [Google Scholar]
- Chang WR, Chang CC, Matz S. The effect of transverse shear force on the required coefficient of friction for level walking. Human Factors. 2011;53(5):461–473. doi: 10.1177/0018720811414885. [DOI] [PubMed] [Google Scholar]
- Chang WR, Grönqvist R, Leclercq S, Brungraber RJ, Mattke U, Strandberg L, Thorpe SC, Myung R, Makkonen L, Courtney TK. The role of friction in the measurement of slipperiness, Part 2: Survey of friction measurement devices. Ergonomics. 2001a;44(13):1233–1261. doi: 10.1080/00140130110085583. [DOI] [PubMed] [Google Scholar]
- Chang WR, Grönqvist R, Leclercq S, Myung R, Makkonen L, Strandberg L, Brungraber RJ, Mattke U, Thorpe SC. The role of friction in the measurement of slipperiness, Part 1: friction mechanisms and definition of test conditions. Ergonomics. 2001b;44(13):1217–1232. doi: 10.1080/00140130110085574. [DOI] [PubMed] [Google Scholar]
- Courtney TK, Sorock GS, Manning DP, Collins JW, Holbein-Jenny MA. Occupational slip, trip, and fall-related injuries-can the contribution of slipperiness be isolated? Ergonomics. 2001;44(13):1118–1137. doi: 10.1080/00140130110085538. [DOI] [PubMed] [Google Scholar]
- DiDomenico A, McGorry RW, Chang CC. Association of subjective ratings of slipperiness to heel displacement following contact with the floor. Applied ergonomics. 2007;38(5):533–539. doi: 10.1016/j.apergo.2006.09.001. [DOI] [PubMed] [Google Scholar]
- Gronqvist R, Matz S, Hirvonen M. Assessment of shoe-floor slipperiness with respect to contact-time-related variation in friction during heel strike. Occupational Ergonomics. 2003;3(4):197–208. [Google Scholar]
- Grönqvist R, Roine J, Järvinen E, Korhonen E. An apparatus and a method for determining the slip resistance of shoes and floors by simulation of human foot motions. Ergonomics. 1989;32(8):979–995. doi: 10.1080/00140138908966859. [DOI] [PubMed] [Google Scholar]
- Hanson JP, Redfern MS, Mazumdar M. Predicting slips and falls considering required and available friction. Ergonomics. 1999;42(12):1619–1633. doi: 10.1080/001401399184712. [DOI] [PubMed] [Google Scholar]
- Iraqi A, Beschorner KE. Vertical ground reaction forces during unexpected human slips. Paper presented at the Proceedings of the Human Factors and Ergonomics Society Annual Meeting.2017. [Google Scholar]
- Jones T, Iraqi A, Beschorner K. Performance testing of work shoes labeled as slip resistant. Applied ergonomics. 2018;68:304–312. doi: 10.1016/j.apergo.2017.12.008. doi: https://doi.org/10.1016/j.apergo.2017.12.008. [DOI] [PubMed] [Google Scholar]
- Leamon T, Li K. Microslip length and the perception of slipping. Paper presented at the 23rd International Congress on Occupational Health; Montreal, Canada. 1990. [Google Scholar]
- Liberty Mutual Research Institute for Safety. 2017 Liberty Mutual Workplace Safety Index. Hopkinton, MA: 2017. [Google Scholar]
- Lockhart TE, Woldstad JC, Smith JL. Effects of age-related gait changes on the biomechanics of slips and falls. Ergonomics. 2003;46(12):1136–1160. doi: 10.1080/0014013031000139491. [DOI] [PMC free article] [PubMed] [Google Scholar]
- McGorry RW, DiDomenico A, Chang CC. The anatomy of a slip: Kinetic and kinematic characteristics of slip and non-slip matched trials. Applied ergonomics. 2010;41(1):41–46. doi: 10.1016/j.apergo.2009.04.002. [DOI] [PubMed] [Google Scholar]
- Menz HB, Lord S, McIntosh AS. Slip resistance of casual footwear: implications for falls in older adults. Gerontology. 2001;47(3):145–149. doi: 10.1159/000052788. [DOI] [PubMed] [Google Scholar]
- Moghaddam SRM, Beschorner KE. Sensitivity of a Multiscale Model of Shoe-Floor-Contaminant Friction to Normal Force and Shoe-Floor Contact Angle. Paper presented at the 2017 STLE Annual Meeting & Exhibition.2017. [Google Scholar]
- Moyer B, Chambers A, Redfern MS, Cham R. Gait parameters as predictors of slip severity in younger and older adults. Ergonomics. 2006;49(4):329–343. doi: 10.1080/00140130500478553. [DOI] [PubMed] [Google Scholar]
- Powers CM, Brault JR, Stefanou MA, Tsai YJ, Flynn J, Siegmund GP. Assessment of Walkway Tribometer Readings in Evaluating Slip Resistance: A Gait-Based Approach. Journal of forensic sciences. 2007;52(2):400–405. doi: 10.1111/j.1556-4029.2007.00386.x. [DOI] [PubMed] [Google Scholar]
- Redfern MS, Bidanda B. Slip resistance of the shoe-floor interface under biomechanically-relevant conditions. Ergonomics. 1994;37(3):511–524. [Google Scholar]
- Redfern MS, Cham R, Gielo-Perczak K, Grönqvist R, Hirvonen M, Lanshammar H, Marpet M, Pai CYC, IV, Powers C. Biomechanics of slips. Ergonomics. 2001;44(13):1138–1166. doi: 10.1080/00140130110085547. [DOI] [PubMed] [Google Scholar]
- Siegmund GP, Heiden TL, Sanderson DJ, Inglis JT, Brault JR. The effect of subject awareness and prior slip experience on tribometer-based predictions of slip probability. Gait & posture. 2006;24(1):110–119. doi: 10.1016/j.gaitpost.2005.08.005. [DOI] [PubMed] [Google Scholar]
- Strandberg L, Lanshammar H. The dynamics of slipping accidents. Journal of Occupational Accidents. 1981;3(3):153–162. [Google Scholar]
- Tsai YJ, Powers CM. The Influence of Footwear Sole Hardness on Slip Initiation in Young Adults*. Journal of forensic sciences. 2008;53(4):884–888. doi: 10.1111/j.1556-4029.2008.00739.x. [DOI] [PubMed] [Google Scholar]
- U.S. Department of Labor- Bureau of Labor Statistics. National Census of Fatal Occupational Injuires in 2015. Washington, D.C: 2016a. [Google Scholar]
- U.S. Department of Labor- Bureau of Labor Statistics. Nonfatal Occupational Injuires and Illnesses Requiring Days Away From Work, 2015. Washington, D.C: 2016b. [Google Scholar]
- Wilson MP. Development of SATRA slip test and tread pattern design guidelines. Slips, stumbles, and falls: pedestrian footwear and surfaces. 1990:113–123. [Google Scholar]
- Yamaguchi T, Hsu J, Li Y, Maki BE. Efficacy of a rubber outsole with a hybrid surface pattern for preventing slips on icy surfaces. Applied ergonomics. 2015;51:9–17. doi: 10.1016/j.apergo.2015.04.001. [DOI] [PubMed] [Google Scholar]
- Yamaguchi T, Masani K. Contribution of center of mass–center of pressure angle tangent to the required coefficient of friction in the sagittal plane during straight walking. Biotribology. 2016;5:16–22. [Google Scholar]


