Abstract
We present in vivo human fundus imaging using a fiber-based confocal scanning laser ophthalmoscope (SLO). Spectrally encoded confocal scanning laser ophthalmoscopy (SECSLO) utilizes a spectral encoding technique in one dimension, combined with single-axis lateral scanning, to create video-rate reflectivity maps of the fundus. This novel implementation of the SLO allows for high contrast, high resolution in vivo human retinal imaging through a single-mode optical fiber. We experimentally quantify the full confocality of SECSLO in both the spectrally encoded and laterally scanned dimensions, and demonstrate 50Hz frame rate fundus imaging.
Fundus imaging has become an essential clinical diagnostic tool in ophthalmology by allowing for noninvasive visualization of retinal structures. Scanning laser ophthalmoscopes (SLO) [1–3] can acquire video-rate fundus images by raster scanning an illumination beam and detecting the back-scattered light. These techniques offer a clear advantage over conventional fundus photography and indirect ophthalmoscopy in terms of light efficiency and image contrast. As a result of its ability to provide rapid, continuous imaging of retinal structures and versatility in accommodating a variety of illumination wavelengths, allowing for imaging of both endogenous and exogenous fluorescent contrast agents, SLO has become a powerful tool for the characterization of retinal pathologies.
Scanning laser ophthalmoscopes are most commonly implemented in a confocal arrangement (CSLO) [2], making them insensitive to scattering outside of the focal plane. Recently, a quasi-confocal implementation of the SLO was introduced, which scans a focused line, instead of a spot, across the retina [4]. This line-scanning laser ophthalmoscope (LSLO) offers imaging speeds and contrast comparable to CSLO, but with a simpler and more portable design. However, these designs all require free-space bulk-optics to accommodate rejection of out-of-focus light in CSLO, and to accommodate imaging in the slit dimension in LSLO. Although there have been several research, and at least one commercial, combinations of CLSO with spectral domain optical coherence tomography (SDOCT) as a means of image tracking [5, 6], these systems are complex and cumbersome.
Spectral encoding of spatial information has been shown to be an effective alternative to scanning confocal imaging systems in microscopy and endoscopy [7–10]. As first implemented by Tearney et al., this method disperses an illumination beam in one dimension using a diffractive element, optionally scans the dispersed line in the orthogonal dimension, and focuses the scanning line on a sample. Light back-scattered from the sample is de-scanned in the orthogonal dimension by the same scanner, and resolved in the first dimension by interferometric or diffractive spectroscopic detection, which can be done remotely. The technique reduces, to one, the number of physical scanners required in close proximity to the sample, thus simplifying construction of compact imaging probes flexibly tethered by a single-mode fiber to a remote base unit containing the light source and spectroscopy hardware. The system also maintains fully confocal imaging, as demonstrated in detail below.
The advantages of spectrally encoded imaging are particularly germane to ophthalmic imaging, where a lightweight, compact, and flexible CSLO would greatly expand the utility of this technique compared to current table-top versions. Here, we demonstrate a fiber-based spectrally encoded confocal scanning laser ophthalmoscope (SECSLO) for fundus imaging. This system combines the full-confocality of conventional CSLO with a simple fiber-based design. Furthermore, our design could readily be incorporated into conventional ophthalmic implementations of SDOCT and uniquely extended to unconventional implementations such as hand-held, catheter, or endoscopic SDOCT.
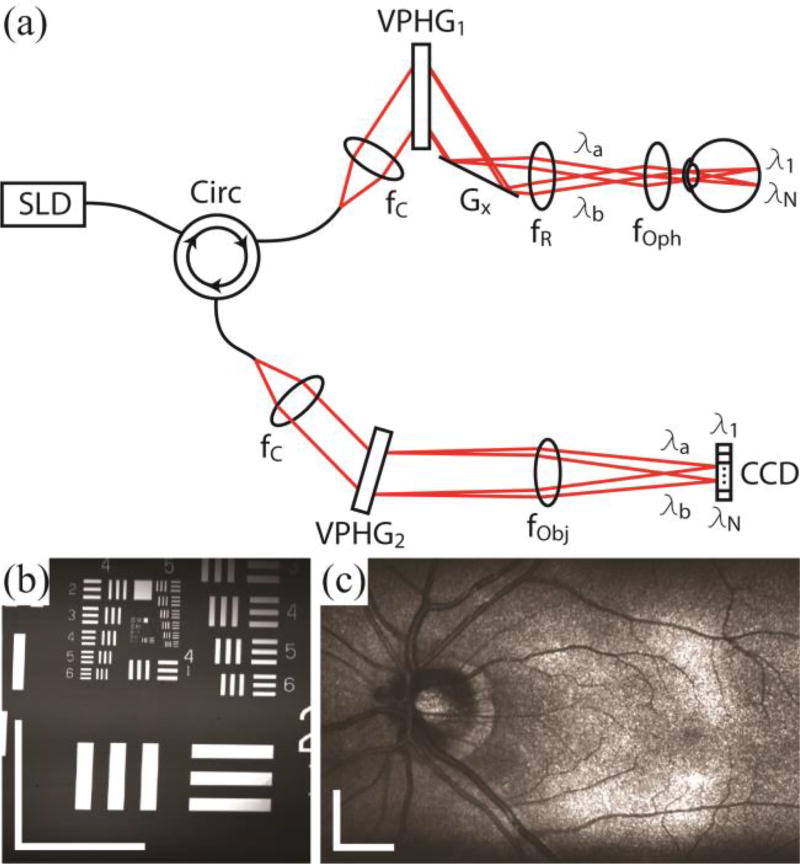
SECSLO was implemented on a modified slit lamp base for human fundus imaging [Fig. 1 (a)]. A superluminescent diode, with a center wavelength of 840 nm and bandwidth of 49 nm, was used as the illumination source. The source was input into a single-mode fiber-optic circulator and the output was collimated and relayed through the slit lamp-mounted optics. These optics consisted of an 80 % diffraction efficiency volume phase grating (Wasatch Photonics, 1200 lines/mm), single-axis galvanometer scanner arranged orthogonal to the dispersion axis, relay lens, and 40D aspheric ophthalmic lens. The back-reflected signal, after de-scanning and transmission back through the single-mode fiber-optic circulator, was detected using a custom spectrometer consisting of a collimating lens, 80 % diffraction efficiency transmission grating (Wasatch Photonics, 1800 lines/mm), focusing objective, and 1024 pixel line-scan CCD array (e2v, Ltd.) operating at 52 kHz line-rate. Custom software (Bioptigen, Inc.) performed real-time data acquisition, processing, archiving, and display.
Fig. 1.
Optical schematic and image quality of the SECSLO. (a) Fiber-based spectrally encoded ophthalmoscope. CCD, linear CCD array; f, focal length of collimating, relay, and focusing elements; G, galvanometer; VPHG, grating. (b) 2.5 × 2.5 mm image of USAF 1951 test chart. Spatial resolution was determined to be 16 µm in both lateral directions. (c) 7 × 5 mm (lateral × spectral) image of an average of 5 registered frames of in vivo human fundus. All images are acquired with 1024 × 1024 pixels at 52 kHz line-rate. Illumination power = 700 µW, scale bar = 5 deg.
The SECSLO grating was optimized for the first transmission order and arranged at an input angle of 30°. The number of resolvable points, Nr, in the spectrally encoded dimension (y) was calculated as Nr = ΔλfD / (λ0 cos θd), where Δλ is the source bandwidth, f is the grating frequency, D is the spot-size, λ0 is the center wavelength, and θd is the diffraction angle. The SECSLO was limited to 1131 resolvable points in the spectral dimension and for a 5 mm field-of-view (FOV) on the retina, as determined by the magnification of the relay optics in the slit lamp, the system was theoretically limited to a spatial resolution of 4.21 µm in the spectral dimension. This theoretical resolution limit, however, will ultimately be dominated by the confocal focused spot-size and aberrations present in the eye, which determines the spatial resolution in both the spectrally encoded and laterally scanned dimensions. The FOV in the lateral scanning dimension was limited by aperturing at the pupil, and the pivot of the scanning mirror was optically relayed to the pupil plane to facilitate lateral scanning across the entire macula. Images of a USAF 1951 test chart, positioned at the focal plane of a model eye, were used to demonstrate field flatness and image quality [Fig. 1(b)]. For an illumination spot-size of 2.5 mm at the pupil, the spatial resolution of the SECSLO was determined to be 16 µm in both the spectrally encoded and laterally scanned dimensions. In vivo imaging of a normal human fundus was performed with 700 µW illumination power at the pupil to demonstrate image quality over an 7 × 5 mm (lateral × spectral) FOV [Fig. 1(c)]. Intensity nonuniformity in fundus images may be attributed to non-telecentricity and vignetting associated with axial motion of the subject. Human images were acquired in accordance with a protocol approved by the Duke University Institutional Review Board. All images were acquired with 1024 × 1024 pixels at 52 kHz line-rate for continuous imaging at 50 Hz frame-rate. Images could then be co-registered and averaged for improved SNR and speckle reduction in post-processing.
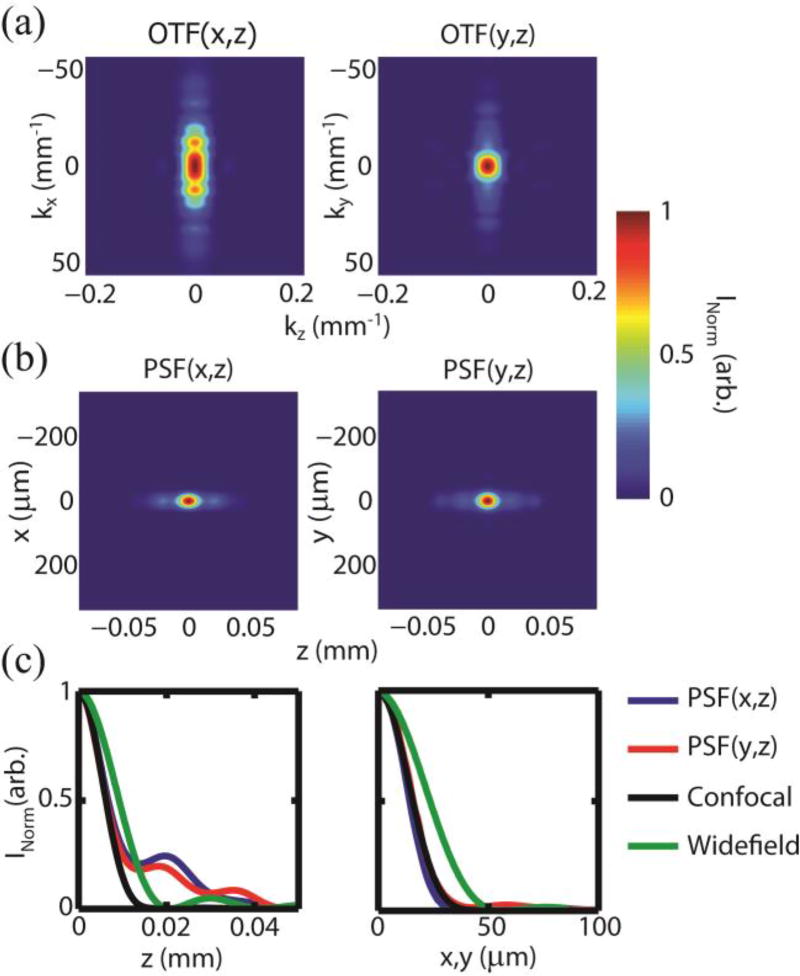
The SECSLO is a fully confocal imaging system, where the aperture size of the confocal pinhole is determined by the mode-field diameter of the single-mode illumination and collection fiber. The confocality of the SECSLO was evaluated quantitatively by measuring the optical transfer function (OTF) and subsequently calculating the point spread function (PSF) for both the lateral (x) and spectral (y) axes. The OTF was measured experimentally by acquiring a series of images of a USAF 1951 test chart while axially translating the sample into and out of the focal plane of a model eye. Axial OTF cross-sections for both axes [Fig. 2(a)] were then calculated using the normalized contrast of each group of elements. Axial PSF cross-sections for both the lateral and spectral axes [Fig. 2(b)] were calculated from the Fourier transform of the respective OTFs. Finally, axial and lateral cross-sections of the measured lateral and spectral PSF functions were compared with theoretical values for confocal and widefield imaging systems [Fig. 2(c)]. These PSFs show measured FWHM axial, lateral x (spatial), and lateral y (spectral) resolutions of 155, 16, and 16 µm, respectively. The theoretical axial and lateral PSFs for confocal systems are described by I (u) = [sinc(u / 4)]4 and I (v) = [2J1 (v) / v]4, respectively [11]. Here, u = (8π / λ)z sin2 (α / 2) and v = (2π / λ)r sin(α), where z is the axial position, r is the radial position, and α is the half-angle subtended by the objective. The measured axial PSF showed a longer axial falloff as compared to theoretical PSFs for confocal systems, which may be attributed to distortions of the effective pupil function as a result of propagating the pinhole across the relay optics of the SECSLO [12]. The lateral PSF cross-sections were, however, well correlated with theoretical values and with each other, indicating no loss of resolution as a result of cross-talk between spectral channels. Both measured axial and lateral PSFs demonstrated a confocal resolution improvement when compared with theoretical PSF cross-sections for widefield imaging.
Fig. 2.
Resolution of SECSLO. (a) Lateral (x) and spectral (y) OTF cross-sections as a function of z. (b) PSF cross-sections calculated from the Fourier transform of the OTF cross-sections. (c) Axial and lateral PSF cross-sections for both lateral and spectral axes compared with theoretical values for confocal and widefield imaging systems.
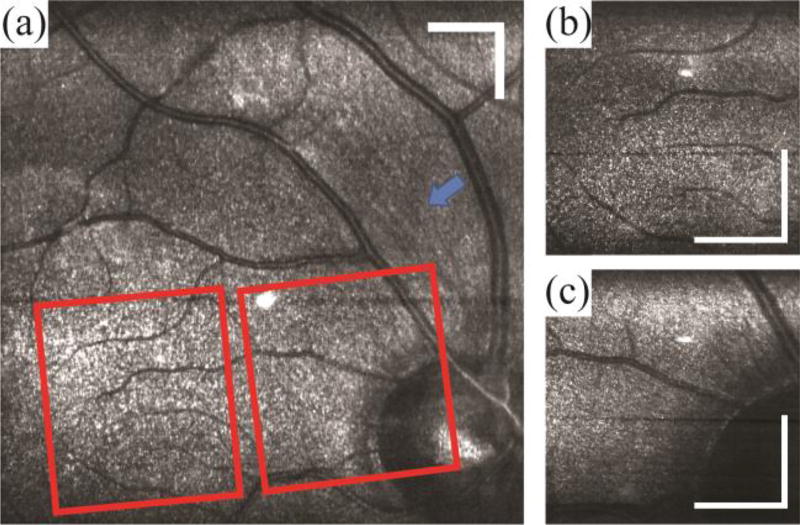
In vivo human fundus was imaged at 10 kHz line-rate with 700 µW illumination power at the pupil. Since each spectrally encoded resolution area is essentially monochromatic, SECSLO suffers from speckle noise; thus, ten sequentially acquired macula images were then co-registered and averaged for improved SNR and speckle reduction [Fig. 3(a)]. The overall magnification of the slit lamp optics was then reduced from a 5 × 5 mm to 1.5 × 1.5 mm FOV to demonstrate high resolution SECSLO fundus imaging over a smaller region. Densely sampled images of both the fovea [Fig. 3(b)] and optic nerve [Fig. 3(c)] were acquired with 1024 × 1024 pixels to demonstrate improved resolution with higher spatial sampling. Here, the structure and vasculature around the optic nerve is visualized with high contrast; furthermore, the magnified regions of optic nerve show striations, indicative of nerve fiber bundles, radially distributed around the nerve head (arrow).
Fig. 3.
Average of 10 registered images of in vivo human macula. (a) Large FOV image with optically magnified images (red boxes) of (b) fovea and (c) optic nerve superimposed. Images were acquired with 1024 × 1024 pixels at a line-rate of 10 kHz. Illumination power = 700 µW, scale bar = 3 deg.
We have demonstrated SECSLO as a novel method for video-rate in vivo human fundus imaging. The confocal nature of the system allows for high resolution, high contrast retinovitreal imaging. Since laterally imaged points in SECSLO are encoded spectrally, back-scattered information can be transmitted through single-mode fiber-optics without loss of resolution, obviating the need for a free-space bulk-optics design. Furthermore, since the SECSLO signal is detected using a spectrometer identical to those used for SDOCT, and the sample arm only differs from a conventional SDOCT scan head by the addition of the diffractive element, a joint SECSLO-SDOCT scanning system could readily be implemented for dual acquisition of depth-resolved and en face images of human retina.
Acknowledgments
This research was partially supported by grant EY-014743 from the National Institutes of Health and The Hartwell Foundation. The authors would like to thank Hansford Hendargo for his assistance.
References
- 1.Webb RH, Hughes GW. IEEE transactions on bio-medical engineering. 1981;28 doi: 10.1109/TBME.1981.324734. [DOI] [PubMed] [Google Scholar]
- 2.Webb RH, Hughes GW, Delori FC. Applied Optics. 1987;26:1492. doi: 10.1364/AO.26.001492. [DOI] [PubMed] [Google Scholar]
- 3.Webb RH, Hughes GW, Pomeranzeff O. Applied Optics. 1980;19:2991. doi: 10.1364/AO.19.002991. [DOI] [PubMed] [Google Scholar]
- 4.Hammer DX, Ferguson RD, Ustun TE, Bigelow CE, Iftimia NV, Webb RH. Journal of biomedical optics. 2006;11 doi: 10.1117/1.2335470. [DOI] [PubMed] [Google Scholar]
- 5.Podoleanu AG, Dobre GM, Cucu RG, Rosen R, Garcia P, Nieto J, Will D, Gentile R, Muldoon T, Walsh J, Yannuzzi LA, Fisher Y, Orlock D, Weitz R, Rogers JA, Dunne S, Boxer A. Journal of biomedical optics. 2004;9 doi: 10.1117/1.1627778. [DOI] [PubMed] [Google Scholar]
- 6.Rosen RB, Hathaway M, Rogers J, Pedro J, Garcia P, Dobre GM, Podoleanu AG. Invest Ophthalmol Vis Sci. 2009;50 doi: 10.1167/iovs.08-1855. [DOI] [PubMed] [Google Scholar]
- 7.Tearney GJ, Shishkov M, Bouma BE. Opt Lett. 2002;27 doi: 10.1364/ol.27.000412. [DOI] [PubMed] [Google Scholar]
- 8.Tearney GJ, Webb RH, Bouma BE. Opt Lett. 1998;23 doi: 10.1364/ol.23.001152. [DOI] [PubMed] [Google Scholar]
- 9.Kang D, Yelin D, Bouma BE, Tearney GJ. Opt Express. 2009;17 doi: 10.1364/oe.17.015239. [DOI] [PMC free article] [PubMed] [Google Scholar]
- 10.Yelin D, Rizvi I, White WM, Motz JT, Hasan T, Bouma BE, Tearney GJ. Nature. 2006;443 doi: 10.1038/443765a. [DOI] [PubMed] [Google Scholar]
- 11.Wilson T. Confocal microscopy. Academic Press; London ; San Diego: 1990. [Google Scholar]
- 12.Kimura S, Wilson T. Applied Optics. 1991;30 doi: 10.1364/AO.30.002143. [DOI] [PubMed] [Google Scholar]


