

Summary
While the majority of phosphatidylinositol-4, 5-bisphosphate (PI-4, 5-P2) in mammalian cells is generated by the conversion of phosphatidylinositol-4-phosphate (PI-4-P) to PI-4, 5-P2, a small fraction can be made by phosphorylating phosphatidylinositol-5-phosphate (PI-5-P). The physiological relevance of this second pathway is not clear. Here, we show that deletion of the genes encoding the two most active enzymes in this pathway, Pip4k2a and Pip4k2b, in the liver of mice causes a large enrichment in lipid droplets and in autophagic vesicles during fasting. These changes are due to a defect in the clearance of autophagosomes, which halts autophagy and reduces the supply of nutrients salvaged through this pathway. Similar defects in autophagy are seen in nutrient-starved Pip4k2a−/−Pip4k2b−/− mouse embryonic fibroblasts and in C. elegans lacking the PI5P4K ortholog. These results suggest that this alternative pathway for PI-4, 5-P2 synthesis evolved, in part, to enhance the ability of multicellular organisms to survive starvation.
eTOC Blurb
Lundquist et al. reveal a critical evolutionarily conserved function of the PI5P4K family of enzymes in autophagy. PI5P4Ks generate PI-4, 5-P2 from the minor lipid PI-5-P and are required for autophagosome-lysosome fusion during metabolic stress. Importantly, this study sheds light on the anticancer mechanism of PI5P4K inhibition.
Introduction
Phosphatidylinositol signaling impacts a large and diverse number of cellular processes, including proliferation, survival, glucose uptake, and cytoskeletal organization. Seven different forms of phosphorylated phosphatidylinositol or phosphoinositides have been identified in mammalian cells. The most abundant phosphoinositide species are phosphatidylinositol 4-phosphate (PI-4-P) and phosphatidylinositol 4,5-bisphosphate (PI-4,5-P2). PI-4-P is particularly abundant in the plasma membrane where it is converted to PI-4,5-P2 by the phosphatidylinositol-4-phosphate 5-kinases (PI4P5Ks). Although the majority of PI-4,5-P2 is found at the plasma membrane, many recent studies have shown that PI-4,5-P2 exists at intracellular locations, including endosomes, lysosomes, and the nucleus (Tan et al., 2015).
The phosphatidylinositol-5-phosphate 4-kinase (PI5P4K) family of enzymes provides an alternative pathway for generating PI-4,5-P2 at intracellular locations by phosphorylating phosphatidylinositol 5-monophosphate (PI-5-P) (Rameh et al., 1997). Three PI5P4K isoforms have been identified in mammals (α, β, and γ) and the genes encoding the PI5P4K enzymes are PIP4K2A, PIP4K2B and PIP4K2C. This family of PI5P4Ks is conserved back to flies and worms, but not yeast (Lecompte et al., 2008). We have generated mice with each of these genes deleted in the germline (Emerling et al., 2013; Lamia et al., 2004; Shim et al., 2016). All three knockouts are viable with normal lifespan and only subtle phenotypes. Importantly, we have shown that knocking down both the PI5P4Kα and PI5P4Kβ enzymes in TP53 mutant breast cancer cells resulted in complete inhibition of growth, due in part to the elevation of reactive oxygen species (ROS) and reduced glucose metabolism (Emerling et al., 2013). Most importantly, we found that germline deletion of two alleles of Pip4k2a and one allele of Pip4k2b in mice suppresses tumor formation with Trp53 deletion (Emerling et al., 2013).
PI-5-P is difficult to localize in the cell. It is present at very low concentrations compared to other phosphoinositides (~1% as abundant as PI-4-P) (Shisheva, 2013), and thus far attempts to develop reliable fluorescent reporters of the location of this lipid have not been successful (Rameh, 2010). Insight can be gained, however, by assessing the location of enzymes that generate PI-5-P (the PIKFYVE PI-3-P 5-kinase and myotubularin family PI-3,5-P2 3-phosphatases) and their role in intracellular membrane trafficking. By these indirect methods, it is likely that PI-5-P is localized to late endosomes, lysosomes and autophagosomes. Recently, PI-5-P was shown to be on lipid droplets (LDs) that emerge from the endoplasmic reticulum (Akil et al., 2016; Song et al., 2016). The three PI5P4K isoforms have also been localized to autophagosomes, presumably to convert PI-5-P to PI-4,5-P2 at this location (Vicinanza et al., 2015).
Mice deficient in the two most catalytically active PI5P4Ks (Pip4k2a−/−Pip4k2b−/−) develop into normal embryos, but die within 12 hours after birth (Emerling et al., 2013). A similar pattern has been reported in mice with defects in critical metabolic pathways controlling nutrient use during starvation, including mTOR signaling, insulin/IGF signaling, and autophagy (Komatsu et al., 2005; Kuma et al., 2004; Ludwig et al., 1996). Autophagy is a catabolic pathway in which normal or dysfunctional cellular components are degraded by the acidic environment of the lysosome. During the early neonatal starvation period, autophagy is needed to provide adequate amino acids and energy (Kuma et al., 2004; Mizushima and Komatsu, 2011). Similarly, adult mouse require autophagy to survive fasting (Karsli-Uzunbas et al., 2014; Mizushima et al., 2004).
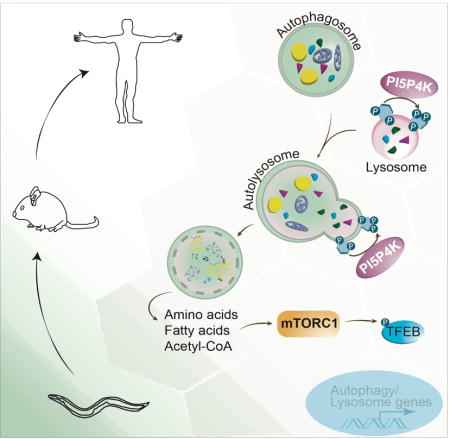
Here, we show that PI5P4Ks play a critical role in autophagy using adult mice with liver-specific deletion of Pip4k2a and germline deletion of Pip4k2b. Under normal feeding cycles, the livers of these mice do not exhibit significant abnormalities. However, upon fasting we find a deficiency in the ability to metabolize LDs in the liver, indicative of an autophagy defect. This autophagy defect reduces hepatic amino acids, glutathione, and intermediates of glucose metabolism. A similar autophagy deficit is described in Pip4k2a−/−Pip4k2b−/− mouse embryonic fibroblasts (MEFs) and ppk-2 deficient C. elegans. In Pip4k2a−/−Pip4k2b−/− MEFs, autophagic vesicles accumulate after multiple cell divisions leading to a reduction in key cellular metabolites including Acetyl-CoA. The resulting nutrient deficiency impairs mTORC1 activation, thereby enhancing the lysosomal and autophagy gene program via the transcription factor EB (TFEB). Our findings, presented here, propose a provocative, evolutionary conserved model where PI5P4K mediates autophagy in times of energy stress. When these kinases are genetically absent, cells are unable to meet the nutritional demands of starvation due to failure of autophagosome digestion by the lysosome. Our findings identify a novel regulatory step in the process of autophagy and shed light on the anti-cancer mechanism of PI5P4K inhibition.
Results
Mice lacking Pip4k2a and Pip4k2b in the liver have a defect in the ability to catabolize LDs following a period of fasting
To circumvent perinatal lethality that accompanies germline deletion of both Pip4k2a and Pip4k2b, we generated mice with germline deletion of Pip4k2b and loxP sites flanking exon 2 of Pip4k2a (Pip4k2aflx/flxPip4k2b−/−) (Emerling et al., 2013). To examine the in vivo role of the PI5P4Ks in metabolic regulation, we genetically deleted Pip4k2a in the liver of 14-16 week old male Pip4k2aflx/flxPip4k2b−/− mice by retro-orbital injection of adenovirus expressing Cre recombinase from the cytomegalovirus (CMV) promoter (Pip4k2a−/−Pip4k2b−/−) or left Pip4k2a intact by administration of an empty adenovirus (Pip4k2aflx/flxPip4k2b−/−) (Figure 1A). Due to the high tropism of adenovirus for hepatocytes (Huard et al., 1995), we observed deletion of PI5P4Kα in hepatocytes of Pip4k2aflx/flxPip4k2b−/− animals injected with adenovirus Cre with no signs of deletion in the spleen (Figures 1B and S1A). PI5P4Kβ was not detected in any tissues examined (data not shown) (Lamia et al., 2004).
Figure 1. Autophagy defects in PI5P4K deficient mouse livers.
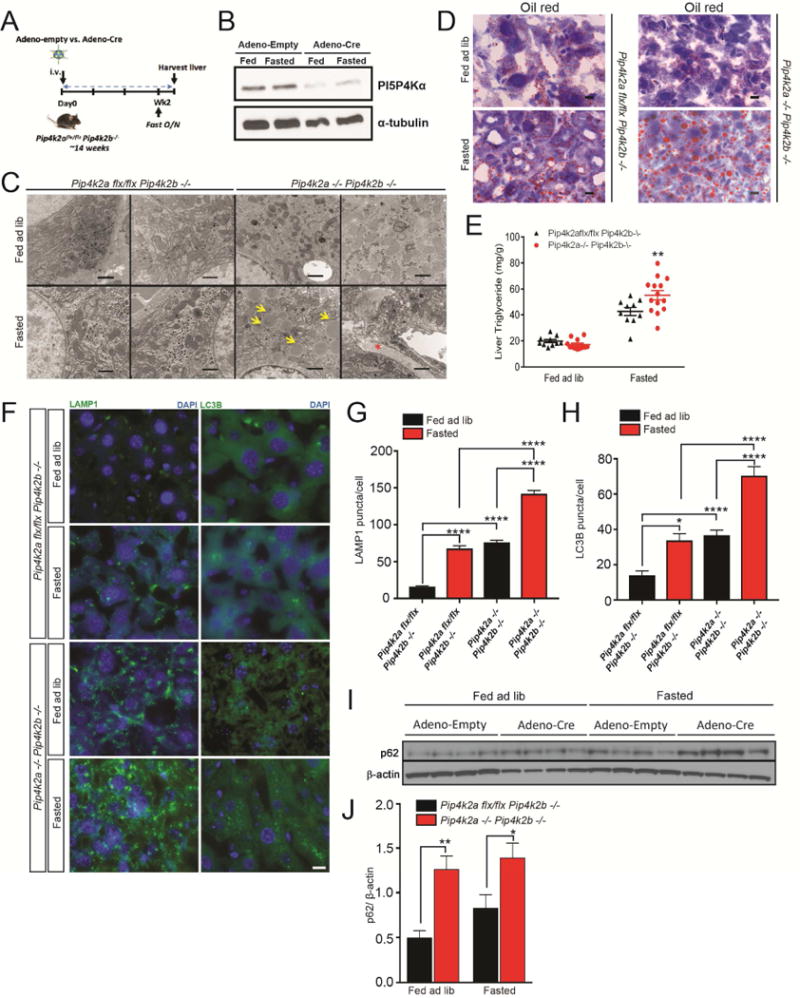
(A) Experimental design of Pip4k2aflx/flx Pip4k2b−/− and Pip4k2a−/−Pip4k2b−/− livers. Pip4k2aflx/flx Pip4k2b−/− mice (~14-16 weeks of age) were retroorbitally injected with adenovirus, empty or Cre. Two weeks post injection, mice were fasted (18 hours) and subsequently livers were harvested.
(B) Liver specific loss of Pip4k2a with Adeno-Cre virus. α-tubulin as loading control.
(C) TEM of livers. Yellow arrows indicate LDs and the red asterisk indicates collagen. Scale bars, 1 μm.
(D) Indicated livers from fed or fasted mice stained with oil red O. Scale bars, 20 μm.
(E) Triglyceride measurements of indicated livers from fed or fasted mice. **p < 0.005, Student’s t-test.
(F) Indicated livers from fed or fasted mice and stained for LC3B or LAMP1. Scale bars, 10 μm.
(G) and (H) Quantification of results in (F). The number of LC3B and LAMP1 puncta was quantified in the cytoplasm and normalized to nuclei. Statistical significance determined by ANOVA (***p < 0.0005) with Dunnett multiple comparison post-test. Each group was compared to Pip4k2aflx/flx Pip4k2b−/− livers from fed mice, (n ≥ 50).
(I) Western blot of p62 in indicated livers from fed or fasted mice. β-actin as loading control (n = 4).
(J) Quantification of the western blot in (I). **p < 0.005, *p < 0.05, Student’s t-test (n = 4).
Two weeks following adenoviral injections, Pip4k2aflx/flxPip4k2b−/− mice injected with Cre virus (Pip4k2a−/−Pip4k2b−/− livers) weighed less than Pip4k2aflx/flxPip4k2b−/− mice injected with empty virus (Figure S1B). Both groups of mice were subjected to 18 hours of fasting (free access to water without food) and, subsequently, the livers were harvested for analysis (Figure 1A). Compared to fed mice, serum glucose was reduced in fasted Pip4k2aflx/flxPip4k2b−/− mice, whereas this effect was blunted in the Pip4k2aflx/flxPip4k2b−/− mice injected with Cre virus (Pip4k2a−/−Pip4k2b−/− livers) (Figure S1B). There was a trend for serum triglyceride to increase with fasting in Pip4k2aflx/flxPip4k2b−/− mice, however not in the Pip4k2aflx/flxPip4k2b−/− mice injected with Cre virus (Pip4k2a−/−Pip4k2b−/− livers) (Figure S1B). Transmission electron microscopic (TEM) analysis was done on livers from fed and fasted mice to investigate the presence of autophagic vesicles. Normal levels of autophagy were observed in the livers of fasted Pip4k2aflx/flxPip4k2b−/− mice (Figures 1C and S1C). In contrast, we observed a significant buildup of autophagic vesicles and lysosomes in the livers of of mice with liver specific deletion of Pip4k2a and germline deletion of Pip4k2b (Pip4k2a−/−Pip4k2b−/− livers) following fasting (Figure S1C). The most striking finding revealed by TEM was the accumulation of large LDs in the Pip4k2a−/−Pip4k2b−/− livers from fasted mice compared to Pip4k2aflx/flxPip4k2b−/− livers from fasted mice (Figure 1C). We also observed the presence of large dense collagen fibrils in Pip4k2a−/−Pip4k2b−/− livers, indicative of fibrosis (Figure 1C and S1D). Fasting also increased apoptosis, as demonstrated by an increase in cleaved caspase 3, only in the PI5P4K deficient livers (Figure S1E). Consistent with the TEM, lipid staining with oil red O revealed a dramatic increase in the LD number and size in fasted mice with Pip4k2a−/−Pip4k2b−/− livers compared to mice with Pip4k2aflx/flxPip4k2b−/− livers (Figure 1D). Because lipid stains detect all neutral lipids in LDs (triglyceride and cholesterol), we also biochemically measured liver triglyceride levels. Indeed, liver triglyceride levels in fasted mice with Pip4k2a−/−Pip4k2b−/− livers were significantly increased in comparison to fasted mice with Pip4k2aflx/flxPip4k2b−/− livers (Figures 1E).
During autophagy, cytoplasmic LC3 protein is processed and recruited to the autophagosomal membranes, which then fuse with lysosomes leading to hydrolysis of the autophagosome cargo. We confirmed the increase of both autophagosomes and lysosomes upon fasting in the Pip4k2a−/−Pip4k2b−/− livers compared to Pip4k2aflx/flxPip4k2b−/− livers by immunostaining for both LC3 and LAMP1, respectively (Figure 1F). Interestingly, we observed a slight increase in LC3 and LAMP1 staining in the Pip4k2a−/−Pip4k2b−/− livers, even in the fed state, which we also confirmed with TEM (Figures 1G and 1H). Likewise, LC3-II protein levels were increased in the Pip4k2a−/−Pip4k2b−/− livers compared to Pip4k2aflx/flxPip4k2b−/− livers in both the fed and fasted state (Figures S1G and S1H). Similarly, p62 protein levels were increased in the Pip4k2a−/−Pip4k2b−/− livers compared to Pip4k2aflx/flxPip4k2b−/− livers from fasted mice (Figure 1I, J), indicating a block in autophagy (Klionsky et al, 2012).
Because autophagy can be controlled by nutrient abundance, we directly measured the liver metabolites by LC-MS/MS in the fed and fasted conditions in Pip4k2aflx/flxPip4k2b−/− and Pip4k2a−/−Pip4k2b−/−livers. We observed a significant drop in the intermediates of glucose metabolism, glutathione, and amino acids (Figure S1F, Table S1). In particular, the amino acid arginine, a known activator of mTORC1 (Ban et al., 2004; Dibble and Manning, 2013; Efeyan et al., 2012; Hara et al., 1998), was remarkably decreased (Figure S1F). Given the high level of apparently defective autophagy and the significant reduction in arginine in the Pip4k2a−/−Pip4k2b−/−livers from fasted mice, we reasoned that the mTORC1 pathway was inhibited. Indeed, compared to Pip4k2aflx/flxPip4k2b−/− livers, mTORC1 signaling was decreased in the Pip4k2a−/−Pip4k2b−/−livers of fasted mice as assessed by a decrease in downstream targets of mTORC1 (Figure S1I and S1J). Together, these results suggest that during nutrient deprivation, PI5P4K deficient livers fail to complete autophagic catabolism of LDs, which causes a decline in glycolytic metabolites, amino acids, and mTORC1 activity.
Loss of PI5P4Kα and PI5P4Kβ results in LD accumulation and autophagy defects in MEFs
Using the Pip4k2aflx/flxPip4k2b−/− mice, we generated primary MEFs. The MEFs were treated with retrovirus containing an shRNA construct against Trp53 and, subsequently, were infected with adenovirus-Cre to excise Pip4k2a, generating immortalized Pip4k2a−/−Pip4k2b−/−shTrp53 MEFs (Figures S2A and S2B). Consistent with our previous results (Emerling et al., 2013), we found that the Pip4k2a−/−Pip4k2b−/− shTrp53 (double knockout) MEFs had impaired cell growth in comparison to Pip4k2aflx/flxPip4k2b−/− shTrp53 MEFs (control) (Figure S2C). To address whether the growth impairment in the double knock out MEFs with loss of p53 was due to a defect in autophagy, we performed TEM on Pip4k2aflx/flxPip4k2b−/− shTrp53 and Pip4k2a−/−Pip4k2b−/− shTrp53 MEFs. TEM revealed a seven-fold increase in autophagic vesicles in the double knockout MEFs as compared to control MEFs (Figures 2A and 2B). Interestingly, the bulk of cargo present in the autophagic vesicles was LDs alone or mixed with cytosolic cargo (Figures 2A, 2B and S2D). Consistently, visualization of the LDs in the Pip4k2a−/−Pip4k2b−/−shTrp53 MEFs revealed an accumulation of LDs in comparsion to the control MEFs (Figures 2C and 2D).
Figure 2. Loss of PI5P4Ks in mouse cells causes autophagy defects.

(A) TEM of indicated MEFs. Red arrows indicate autophagic vacuoles (AVs). Scale bars, 1 μm.
(B) Quantification of results in (A). The number of AVs was counted per cell. ***p< 0.0005, Student’s t-test, (n ≥ 30).
(C) LDs (red) visualized in MEFs. Nuclei in blue. Scale bars, 10 μm.
(D) Quantification of results in (C). *p< 0.05, Student’s t-test, (n ≥ 25).
(E) MEFs were cultured overnight with either 10% or 0.3% serum and stained for LC3B (red) or LAMP1 (green). Nuclei in blue. Scale bars, 10 μm.
(F) Quantification of LC3B puncta per cell in (E). Statistical significance determined by ANOVA (***p < 0.0005) with Dunnett multiple comparison post-test. Each group was compared to control MEFs cultured in 10% serum, (n ≥ 25).
(G) Quantification of LAMP1 puncta per cell in (E). Statistical significance determined by ANOVA (***p < 0.0005) with Dunnett multiple comparison post-test. Each group was compared to control MEFs cultured in 10% serum, (n ≥ 25).
(H) Colocalization of LC3B and LAMP1 puncta in (E). A Pearson correlation was calculated between the puncta for the LC3B and LAMP1 immunofluorescence signal. Statistical significance determined by ANOVA (***p < 0.0005) with Dunnett multiple comparison post-test. Each group was compared to control cultured in 10% serum, (n ≥ 25).
(I) MEFs were cultured overnight with 10% serum and stained for LC3B (red) or LAMP1 (green) and visualized at 100× magnification. Autophagosomes marked by yellow and blue arrows. Nuclei in blue. Scale bars, 5 μm.
We next examined the subcellular localization and biochemical properties of LC3 and LAMP1 in these cells. As expected, LC3 and LAMP1 puncta increased under serum-starved conditions (0.3% FBS) in the Pip4k2aflx/flxPip4k2b−/− shTrp53 MEFs (Figures 2E-G). Interestingly, the number of LC3 and LAMP1 puncta present in the double knock out MEFs was roughly 4-fold greater under basal conditions with no additional increase with serum starvation (Figures 2E-G). Double immunofluorescence studies confirmed an increase in co-localization of LC3 and LAMP1 in the Pip4k2a−/−Pip4k2b−/− shTrp53 cells under basal conditions in contrast to the Pip4k2aflx/flxPip4k2b−/− shTrp53 cells (Figure 2H). When visualized at higher magnification, it is apparent that the lysosomes in Pip4k2a−/−Pip4k2b−/− shTrp53 MEFs are often larger and bound to one or several autophagosomes (Figure 2I). These data show that PI5P4K deficiency in the context of p53 loss leads to a dramatic increase in markers of autophagy. This increase could result from an enhanced induction of autophagy, a block in the turnover of LC3-bound autophagosomes, or both (Klionsky et al., 2012).
Impairment of autophagosome-lysosome fusion in MEFs lacking PI5P4Kα and PI5P4Kβ
To further explore whether PI5P4K loss enhances autophagy initiation or blocks autophagic flux, we used the tandem fluorescent-tagged LC3 reporter where the GFP tag is acid-sensitive while the mCherry tag is acid-insensitive (Hansen and Johansen, 2011). Both Pip4k2aflx/flxPip4k2b−/− shTrp53 and Pip4k2a−/−Pip4k2b−/− shTrp53 MEFs were infected with a retrovirus containing the pBabe-puro mCherry-eGFP-LC3B reporter. Again, we found that LC3B puncta and total levels of endogenous LC3-II were dramatically increased in the Pip4k2a−/−Pip4k2b−/− shTrp53 MEFs (Figures 3A, 3B, 3D, and 3E). Interestingly, we identified a significant increase in the percentage of yellow fluorescence observed in the double knockout cells implying a block in late stage autophagy (Figures 3A and 3C). Chloroquine (CQ), which impairs functional autophagy by elevating the pH in lysosomes and autophagosomes, induced a similar effect in control Pip4k2aflx/flxPip4k2b−/− shTrp53 MEFs; however, it did not exacerbate the autophagy defect in the double knockout cells (Figures 3C–3E). Consistent with a block in late-stage autophagy seen in the Pip4k2a−/−Pip4k2b−/− livers (Figures 1I and 1J), the double knockout MEFs contained significantly higher basal levels of p62 compared to the control MEFs (Figure 3F).
Figure 3. Autophagic flux perturbed in Pip4k2a−/−Pip4k2b−/− shTrp53 MEFs.

(A) MEFs were transfected with the tandem fluorescent-tagged LC3 reporter and treated +/− CQ (20 M) 12 hours before fixation. Nuclei in blue. Scale bars, 15 μm.
(B) Quantification of LC3B puncta per cell in (A). Statistical significance determined by ANOVA (*p< 0.05, ***p < 0.0005) with Dunnett multiple comparison post-test. Each group was compared to control MEFs – CQ. (n ≥ 25).
(C) Quantification of puncta color percentage in (A). Total number of autophagosomes (yellow) and autolysosomes (red) were quantified and compared to total puncta per cell (n=30 cells). Statistical significance determined by ANOVA (***p < 0.0005) with Dunnett multiple comparison post-test.
(D) Western blot of LC3B levels compared to β-actin in MEFs treated +/- 20uM CQ for 12 hours (n=4).
(F) Western blot comparison of endogenous PI5P4Kα and p62 to αtod p62enin MEFs (n =3).
(G) MEFs were infected with a lentivirus expressing GFP or GFP-PIP4K2A and stained with lysotracker (red). Nuclei in blue. Scale bars, 10 μm.
(H) Increased magnification of the box in (G). Scale bars, 4 μm.
(I) Quantification of the lysosomes in (G). Statistical significance determined by ANOVA (*p < 0.05) with Dunnett multiple comparison post-test.
We next investigated the localization of GFP-PIP4K2A when expressed in MEFs deficient in either one or two of the PIP4K2s. GFP-PIP4K2A exhibited a punctate localization when expressed in both the Pip4k2aflx/flxPip4k2b−/− shTrp53 and Pip4k2a−/−Pip4k2b−/− shTrp53 MEFs (Figure 3G). The PIP4K2A-labeled puncta were identified to be lysosomes and not LDs, as PIP4K2A-labeled puncta colocalized with lysotracker and not Red C12, a marker for LDs (Figures 3G, 3H and S3A). mCherry-PIP4K2B similarly did not colocalize with LDs when expressed in the MEFs (Figure S3B). Additionally, the total number of lysosomes was seen to significantly decrease in the GFP-PIP4K2A expressing Pip4k2a−/−Pip4k2b−/− shTrp53 MEFs compared to the Pip4k2a−/−Pip4k2b−/− shTrp53 MEFs (Figure 3I). The rescue of lysosomal number in the Pip4k2a−/−Pip4k2b−/− shTrp53 MEFs with reintroduction of PIP4K2A suggests a role for PIP4K2A in either suppressing lysosomal synthesis or enhancing lysosomal turnover or both.
Loss of PI5P4Kα and PI5P4Kβ modifies expression of lysosomal and mTORC1 genes and alters metabolism
To explore how the loss of the PI5P4Ks results in an impairment of autophagy flux we performed unbiased RNA-sequencing (RNA-seq). Gene set enrichment analysis (GSEA) revealed that genes in the lysosome pathway were significantly upregulated in the Pip4k2a−/−Pip4k2b−/− shTrp53 MEFs compared to Pip4k2aflx/flx Pip4k2b−/− shTrp53 MEFs (Figures 4A and 4B). Importantly, the majority of genes in the lysosome gene set (ko04142) were significantly increased in the Pip4k2a−/−Pip4k2b−/− shTrp53 MEFs (Figure 4C). These data are consistent with the increase in autophagic vesicles we observed using TEM and immunostaining for LAMP1 in the Pip4k2a−/−Pip4k2b−/− shTrp53 MEFs (Figure 2). Concurrently, genes from the Hallmark mTORC1 pathway are largely downregulated in the Pip4k2a−/−Pip4k2b−/− shTrp53 MEFs (Figures 4B and 4C). Since mTORC1 activity negatively regulates lysosomal biogenesis, this decrease in gene expression may trigger the increase in autophagy.
Figure 4. Loss of PI5P4Ks induces autophagy-lysosome gene program and metabolic deficiencies.

(A) Pathway enrichment for genes significantly differentially expressed (47 Genes, False Discovery Rate (FDR) <0.2) and overlapping Autophagy Signature (Perera et al., 2015), between control and double knockout MEFs. Ranked by −log10 (p-value).
(B) Normalized enrichment score (NES) for genes identified as part of the KEGG Lysosomal and Hallmark mTORC1 gene sets. The upper part shows the NES, which is calculated by ranked ordered gene set, increasing the score when a gene is in the set and decreasing it when it is not. Each blue line represents a hit from the gene set. The lower portion shows the rank ordered genes for the double knockout MEFs when compared to the control MEFs, with highly expressed to the far left and down-regulated genes to the right. Enrichment score (ES) for KEGG Lysosome=0.62 and Hallmark mTORC1 = −0.49, FDR < 0.2 for both.
(C) Heat map of lysosomal genes and mTORC1 genes from (B). P-values were adjusted for multiple testing using the Benjamini-Hochburg method with p < 0.05 and q < 0.1, (n = 3).
Metabolic perturbations play a fundamental role in regulating autophagy; therefore, we utilized targeted mass spectrometry to examine the levels of metabolites in the MEFs just as we did in the liver (Figures S4A-D). Validating our previous results in breast cancer cells (Emerling et al., 2013), we detected considerable changes in metabolites in the Pip4k2a−/−Pip4k2b−/−shTrp53 MEFs, compared to the Pip4k2aflx/flx Pip4k2b−/− shTrp53 MEFs. The most significant changes were an increase in TCA intermediates, decreases in both reduced and oxidized glutathione, amino acids shown to regulate autophagy (Figures S4C, S4D and Table S2), and Acetyl-CoA (Figure 6A) upon loss of both PI5P4Kα and PI5P4Kβ.
Figure 6. Acetyl-CoA replenishment modulates autophagy in cells lacking PI5P4K.
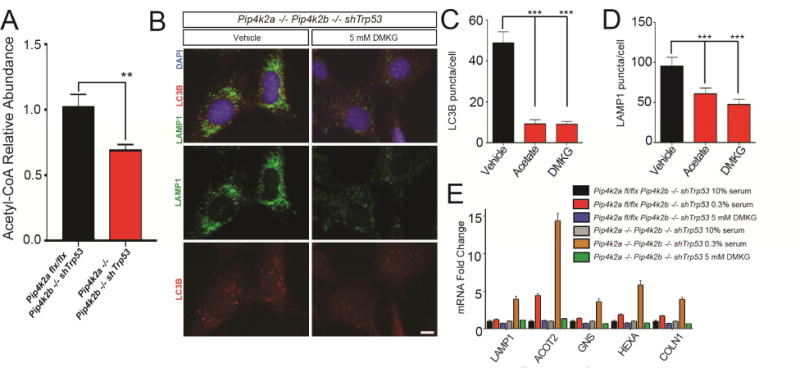
(A) Lysates from indicated MEFs were assayed by metabolomics for levels of Acetyl-CoA. *p < 0.05, Student’s t-test, (n ≥ 7).
(B) Pip4k2a−/−Pip4k2b−/− shTrp53 MEFs were cultured overnight in 10% serum +/- 5 mM DMKG and stained for LAMP1 (green) and LC3B (red). Nuclei in blue. Scale bars, 10 μm.
(C) Quantification of LC3B puncta per cell in (B). In addition to DMKG, MEFs were treated with acetate overnight. Statistical significance determined by ANOVA (***p < 0.0005) with Dunnett multiple comparison post-test. Each group was compared to vehicle treated MEFs, (n ≥ 25).
(D) Quantification of LAMP1 puncta per cell in (B). Conditions same as (C). Statistical significance determined by ANOVA (***p < 0.0005) with Dunnett multiple comparison post-test. Each group was compared to vehicle treated MEFs, (n ≥ 25).
(E) MEFs were cultured overnight in media containing 10% serum, 0.3% serum or 0.3% serum with 5 mM DMKG. The cells were then harvested for qPCR of TFEB targets. *p < 0.05, Student’s t-test, (n ≥6).
Loss of PI5P4Kα and PI5P4Kβ increases TFEB nuclear translocation and activity
A key transcription factor responsible for the expression of lysosomal and autophagic genes is TFEB. In normal or nutrient rich conditions, TFEB is localized to the cytoplasm (Sardiello et al., 2009). Starvation or metabolic stress induces TFEB nuclear translocation (Settembre and Ballabio, 2011; Stein and Wexler, 1990). We noted that the majority of the TFEB targets in the RNA-seq were significantly elevated in the Pip4k2a−/−Pip4k2b−/− shTrp53 MEFs compared to the Pip4k2aflx/flx Pip4k2b−/− shTrp53 MEFs (Figure 5A). Accordingly, we found an increase in nuclear TFEB in the Pip4k2a−/−Pip4k2b−/− shTrp53 MEFs compared to the Pip4k2aflx/flx Pip4k2b−/− shTrp53 MEFs in the presence of serum (Figures 5B and 5C). As expected, serum starvation induced nuclear translocation of TFEB in both the control and double knockout MEFs (Figures 5B, 5C, S5A, and S5B). For confirmation of TFEB activity, we analyzed a panel of known TFEB targets and found a significant increase in their expression in the double knockout MEFs upon serum starvation when compared to the control MEFs (Figure 5D). Furthermore, by re-expressing PIP4K2A in the Pip4k2a−/−Pip4k2b−/− shTrp53 MEFs we could reverse the effect of PI5P4K loss, significantly decreasing the mRNA levels of the TFEB targets (Figure 5E). Together, these data suggest that in the setting of both PI5P4K and p53 deficiency, TFEB activity increases and induces an autophagy-lysosome gene expression program.
Figure 5. TFEB nuclear localization and downstream gene activation is increased with PI5P4K loss.

(A) Heat map of TFEB-dependent genes in the double knockout MEFs compared to the control MEFs. *p < 0.05, (n = 3).
(B) MEFs were cultured in 10% or 0.3% FBS for 18 hours and stained for TFEB (green). Nuclei stained in blue. Scale bars, 10 μm.
(C) Quantification of results in (B). The intensity of TFEB immunofluorescence was quantified in the nucleus and the cytoplasm, and used to calculate the ratio. Statistical significance determined by ANOVA (***p < 0.0005) with Dunnett multiple comparison post-test. Each group was compared to control MEFs grown in 10% serum, (n ≥ 30).
(D) MEFs were serum starved for 16 hours in 0.3% serum and subsequently harvested for qPCR of TFEB targets. Fold change is calculated by comparison to MEFs grown in complete media. *p < 0.05, Student’s t-test, (n ≥ 8).
(E) Pip4k2a−/−Pip4k2b−/− shTrp53 MEFs infected with a lentivirus expressing mCherry or mCherry-PIP4K2A were serum starved for 16 hours in 0.3% serum and subsequently harvested for qPCR of TFEB targets. Fold change is calculated by comparison to MEFs grown in complete media. *p < 0.05, Student’s t-test, (n ≥ 8).
(F) Lysates from indicated MEFs were assayed for the levels and phosphorylation states of the indicated mTORC1 targets (n =3).
TFEB is regulated by mTORC1. When nutrients are present, mTORC1 phosphorylates TFEB, which localizes TFEB to the cytoplasm (Roczniak-Ferguson et al., 2012; Settembre et al., 2012). Conversely, starvation or metabolic stress inhibits mTORC1 signaling, and unphosphorylated TFEB translocates to the nucleus and induces gene expression. Consistent with the increased TFEB activity and similar to what was observed in Pip4k2a−/−Pip4k2b−/− livers of fasted mice, we observed reduced mTORC1 activity in the Pip4k2a−/−Pip4k2b−/− shTrp53 MEFs as demonstrated by a decrease in phosphorylation of known mTORC1 targets (Figures 5F and S5C and S5D).
Since mTORC1 is the central regulator of metabolism, we next asked if modulating mTORC1 activity would phenocopy the effects of PI5P4K loss. TSC2 is a negative regulator of mTORC1 activity and siRNA knockdown of TSC2 increases downstream activation of mTORC1 targets (Huang and Manning, 2008, 2009). Knockdown of TSC2 in the Pip4k2a−/−Pip4k2b−/− shTrp53 MEFs decreased the number of LAMP1 puncta by immunofluorescence and increased the phosphorylation of the downstream mTORC1 target p70S6K (Figures S5E-H). Conversely, inhibition of mTORC1 with RAD001 in the Pip4k2aflx/flxPip4k2b−/− shTrp53 MEFs demonstrated an increase in LAMP1 puncta similar to Pip4k2a loss (Figures S5I and S5J). These findings indicate that loss of PI5P4Kα and PI5P4Kβ, and p53 induces a reduction in mTORC1 activity, thereby promoting the nuclear translocation of TFEB and, ultimately, the transcription of autophagy and lysosome genes.
PI5P4K induced autophagy defects are reversed by Acetyl-CoA supplementation
We next asked if there was a metabolic defect that led to the induction of autophagy with the loss of PI5P4K function. As discussed above, we observed a significant decrease in Acetyl-CoA levels in PI5P4K deficient cells (Figure 6A). Because low levels of Acetyl-CoA induce autophagy (Marino et al., 2014), we hypothesized that elevating Acetyl-CoA could reduce the initiation of autophagy in the Pip4k2a−/−Pip4k2b−/− shTrp53 MEFs. Addition of dimethyl-ketoglutarate (DMKG), a cell-permeable agent that increases intracellular concentrations of α-ketoglutarate, thereby increasing Acetyl-CoA (Marino et al., 2014; Willenborg et al., 2009), to the Pip4k2a−/−Pip4k2b−/− shTrp53 MEFs resulted in a decrease in the LC3 and LAMP1 puncta (Figures 6B-D). Also, generating Acetyl-CoA via addition of acetate suppressed LC3 and LAMP1 puncta (Figures 6C and 6D). Supplementation with DMKG also prevented expression of the TFEB target genes in the Pip4k2a−/−Pip4k2b−/− shTrp53 MEFs (Figure 6E).
Because p53 is essential for survival after PI5P4K loss as well a key regulator of both autophagy and metabolism, we investigated the effect of PI5P4K loss in the context of functional p53. Similarly to the shTrp53 MEFs, MEFs from Pip4k2aflx/flxPip4k2b−/− mice were infected with a virus expressing SV40 and, subsequently, were infected with adenovirus-Cre to excise Pip4k2a, generating immortalized Pip4k2a−/−Pip4k2b−/− SV40 MEFs. A functional p53 response is demonstrated in both Pip4k2aflx/flxPip4k2b−/− SV40 and Pip4k2a−/−Pip4k2b−/− SV40 MEFs by the increase in the phosphorylation of p53 at serine 15 after etoposide treatment (Figures A and B). In contrast to shTrp53 immortalized MEFs, neither lysosomes nor LDs were increased with Pip4k2 loss in SV40 immortalized MEFs (Figures C-F). However, SV40 immortalized MEFs had a significant decrease in the nuclear localization and increase in cytosolic puncta with Pip4k2 loss (Figures G-I). LC3B has been previously demonstrated to reside in the nucleus under satiety and translocate to cytosolic autophagosomes under metabolic stress (Huang and Liu, 2015). This suggests a functional p53 response can partially ameliorate the loss of PI5P4K.
PI5P4K function is conserved across Taxa
Finally, we asked if PI5P4K’s role in metabolism and metabolic stress survival is conserved in more primitive animals. A single PI5P4K is present in C. elegans and is called PPK-2 (Weinkove et al., 2008). Recombinant PPK-2 is catalytically active and able to phosphorylate PI-5-P to produce PI-4, 5-P2 in vitro (Figure S7A). Several studies have shown that impaired autophagy in C. elegans reduces lifespan and enhances sensitivity to metabolic stress (Hansen et al., 2008; Possik et al., 2014). Therefore, we first performed a lifespan assay and found that ppk-2 (pk1343) mutant animals have reduced lifespan in comparison to wild-type animals (Figure 7A). This reduced lifespan could be rescued by reintroduction of ppk-2 (Figures 7A and S7B).
Figure 7. Conservation of PI5P4K pathway in C. elegans.

(A) Lifespan assay of wild-type and ppk-2 mutant animals.
(B and C) Oxidative stress resistance assay of indicated worm strains on specified conditions. Synchronized post fertile animals were transferred to plates supplemented with 4 mM paraquat and surviving animals were scored daily.
(D) Oil red O staining in wild-type and ppk-2 mutant day 1 adult animals.
(E) Quantification of the oil red O staining intensity. Data are expressed as means ±SEM. Statistical analyses for all data were performed by Student’s t-test (*p<0.05, **p<0.01).
(F) Model of PI5P4K regulation of autophagy. In WT cells, during energy stress, autophagy is activated as a cellular recycling mechanism. Cells will capture cytoplasm and organelles and consume them in the lysosome following fusion of the autophagosome to the lysosome and the PI5P4Ks are required for proper fusion. In PI5P4K deficient cells, lysosomes fail to fuse with autophagosomes at the rate needed to clear the autophagosomes when cells are under energy stress. After multiple cell divisions following the loss of PI5P4Ks, a build-up of autophagic vesicles and undigested LDs accumulate leading to a drop in cellular metabolites, in particular amino acids and Acetyl-CoA. The decrease in metabolites impairs mTORC1 activation, thereby turning on TFEB dependent gene expression.
To investigate the role of PPK-2 in metabolic stress, we subjected animals to paraquat, a superoxide inducer, which induces severe energy stress by interfering with the electron transport chain of mitochondria. The ppk-2 (pk1343) mutant animals were more sensitive to the paraquat treatment, compared to wild-type animals (Figures 7B and S7C). Moreover, we could rescue the sensitivity to paraquat treatment by re-expression of ppk-2 (Figures 7B and S7C). Next, to determine whether PPK-2 acts upstream of the major autophagy gene BECN1 (bec-1 in C. elegans), we inhibited bec-1 in ppk-2 (pk1343) mutant animals using RNAi. Interestingly, ppk-2 (pk1343) mutant animals survive similarly to wild-type animals treated with bec-1 RNAi, and treatment of ppk-2 animals with bec-1 RNAi did not further decrease their survival to paraquat, suggesting that the reduced survival and metabolic stress phenotypes in ppk-2 (pk1343) mutant animals depend on autophagy (Figures 7C and S7C).
Recent studies have demonstrated that autophagy genes are required for normal lipid storage in the gut of C. elegans (Lapierre et al., 2013). To determine whether ppk-2 (pk1343) mutant animals display impaired lipid storage similarly to what has been observed upon defective autophagy (Lapierre et al., 2013), we stained animals with oil red O. We found a significant decrease in the amount of oil red O stained neutral lipids in the gut of ppk-2 (pk1343) mutant animals compared to the wild-type animals (Figures 7D, 7E, and S7D). Notably, we observed a similar decrease in both wild-type and ppk-2 mutant animals treated with bec-1 RNAi, supporting an important role for autophagy in the restoration of normal fat storage upon loss of ppk-2 (Figures 7D, 7E, and S7D). Collectively, these data reinforce the evolutionarily conserved role of PI5P4K in metabolic stress survival.
Discussion
In this study, we define a new role for the PI5P4Ks in mediating autophagy in times of nutrient stress. We provide multiple lines of evidence, including a mouse model, cultured cells, and conservation in the nematode C. elegans, to solidify our findings. First, examining adult mice with liver-specific deletion of Pip4k2a and germline deletion of Pip4k2b, we discovered a defect in the ability to catabolize LDs in the liver following a period of fasting. The increase of LC3B and LAMP1 staining, along with the accumulation of p62 protein in nutrient deprived Pip4k2a−/−Pip4k2b−/− livers compared to Pip4k2aflx/flxPip4k2b−/− livers, was indicative of a failure to clear the autophagosomes by fusion with the lysosomes. Second, in order to uncover the biochemical mechanisms of the autophagy defect we found in the PI5P4K deficient livers from fasted mice, we generated Pip4k2aflx/flxPip4k2b−/− shTrp53 and Pip4k2a−/−Pip4k2b−/− shTrp53 MEFs and confirmed that the loss of PI5P4K impairs autophagosome-lysosome fusion. Third, using the C. elegans lacking the PI5P4K ortholog we revealed that the PI5P4K pathway is essential and conserved for autophagy during nutrient stress.
It is clear that the vast majority of PI-4,5-P2 is generated at the plasma membrane by the canonical PI4P5Ks. What is not fully appreciated is why multicellular organisms have evolved an alternative pathway to generate PI-4, 5-P2 at intracellular sites. Our findings here suggest that this second way to generate intracellular PI-4,5-P2 by the PI5P4Ks evolved for multicellular organisms to survive conditions where nutrients are inadequate. Yeast lack PI5P4Ks but can still complete autophagosome-lysosome fusion by producing PI-4,5-P2 exclusively using the canonical pathway where PI-4-P serves as the precursor. Our data support a model in which multicellular animals can also utilize the canonical PI4P5Ks to produce enough PI-4, 5-P2 for autophagosome-lysosome fusion under conditions of low metabolic stress, but require the PI5P4Ks to produce sufficient PI-4, 5-P2 in order to keep up with the demand under conditions of high metabolic stress (Figure 7F). However, our results do not imply that PI-4, 5-P2 is necessary for autophagosome-lysosome fusion. In fact, it has previously been established that autophagosome-lysosome fusion can temporally be promoted by PI-4-P generated from PI-4, 5-P2 via the oculocerebrorenal syndrome of Lowe protein (OCRL) (De Leo et al., 2016) or PI-3-P generated from PI-3, 5-P2 via inositol polyphosphate-5-phosphatase E (INPP5E) (Hasegawa et al., 2016). On their own this data would suggest that phosphorylation at the 5′-position at the lysosome blocks fusion, and would be supported by increased markers of autophagy when bathing cells in exogenous PI-5-P (Vicinanza et al., 2015). However, this model is contradicted by the lysosomal and autophagosomal dysfunction seen with the inhibition of the enzyme responsible for the bulk of PI-5-P synthesis, PIKFYVE (de Lartigue et al., 2009). Therefore, one attractive model is that it is not the PI-4, 5-P2 that is needed for fusion but rather the generation of PI-4-P that mediates autophagosome- lysosome fusion. Future work is needed to tease out these biochemical pathways and elucidate whether the main enzymatic function of the PI5P4Ks at the lysosome is the removal of PI-5-P or the generation of PI-4-P through PI-4, 5-P2. Currently, one could explain most, if not all, the observations made in Pip4k2a−/−Pip4k2b−/− mouse livers and MEFs as a consequence of a defect in fusion of autophagosomes with lysosomes (Figure 7F). The consequent defect in digestion of the autophagosome contents puts the cells in a state of metabolic stress that explains the decrease in mTORC1 activity, the activation of TFEB, and the enhanced initiation of more, albeit ineffective, autophagy (Figure 7F).
The depletion of nutrients, in particular energy-rich metabolites, induces autophagy. Recent data suggests that Acetyl-CoA plays a central role in the regulation of starvation-induced autophagy (Marino et al., 2014). Notably, we found Acetyl-CoA levels to be significantly decreased in the Pip4k2a−/−Pip4k2b−/− shTrp53 cells compared to Pip4k2aflx/flxPip4k2b−/− shTrp53 cells. In cells deficient in PI5P4Ks, autophagy ultimately fails due to loss of kinase activity at the autophagosome/lysosome, which prevents the acidification of the autophagosome and fails to provide nutrients to the cell. These defects can be circumvented by direct supplementation with metabolites, such as DMKG and acetate, which rescue Acetyl-CoA levels in the cytosol and prevent the need for autophagy induction. Overall, metabolite rescue suggests that loss of PI5P4Ks and p53 concurrently weakens the ability of cells to respond to nutrient scarcity. Similarly providing extracellular metabolites, such as glutamine, can rescue the survival of autophagy deficient cells under starvation (Guo et al., 2013). Therefore, the inability to adapt to nutrient scarcity may explain the deficits in solid tumor formation seen previously with the loss of Pip4k2a and Pip4k2b in Trp53 null mice (Emerling et al., 2013). Dissecting the distinct role(s) of the PI5P4Ks and their relationship with p53 in tumor metabolism, particularly in the regulation of lipid homeostasis warrants further investigation.
An important and exciting aspect of our findings is that the function of PI5P4K in rescuing animals from metabolic stress is conserved through evolution. C. elegans have one active PI5P4K called PPK-2 and we showed that C. elegans lacking PPK-2 have a reduced lifespan and are more sensitive to metabolic stress. In addition, we found that the ppk-2 mutant worms had a decrease in lipid storage in the gut compared to wild-type animals, supporting a conserved role of PI5P4K in facilitating lipid storage. While the decrease in lipid content observed in the ppk-2 mutant animals is opposite of what is seen in the PI5P4K deleted livers of nutrient starved mice, this finding is consistent with models of defective autophagy in non-hepatic tissues (Singh et al., 2009b; (Zhang et al., 2009). Therefore, autophagy facilitates fat breakdown in the liver yet can also promote fat storage in peripheral tissues such as adipose tissue. Because autophagy genes in C. elegans are required for lipid storage in normal development (Lapierre et al., 2013) and animals with mutations in autophagy genes fail to accumulate fat (Lapierre et al., 2013), we suspect that the regulation of lipid metabolism in C. elegans is more comparable to that of mammalian adipose tissue. In agreement with this concept, the loss of lipid in ppk-2 mutant worms is consistent with our previous report that germline deletion of Pip4k2b in mice results in a decrease in peripheral fat storage (Lamia et al., 2004). It is also consistent with the observation that deletion of the Drosophila PI5P4K (dPIP4K) results in reduced body weight and shortening of larval development (Gupta et al., 2013). Interestingly, the loss of function mutant of dPIP4K has a decrease in mTORC1 signaling (Gupta et al., 2013). Collectively, the results of this study strongly support a critical and evolutionarily conserved role for PI5P4K in the autophagic response to starvation as well as in whole peripheral body fat storage.
Perturbations of autophagy have been linked to various diseases including neurodegeneration, skeletal muscle myopathies, heart disease, liver disease, and cancer. Previously we showed that loss of both PI5P4Kα and PI5P4Kβ inhibits growth of p53 deficient tumors by mediating changes in cellular metabolism in response to stress, specifically the ROS stress that occurs in the absence of p53 (Emerling et al., 2013). At the time, the biochemical mechanism by which the PI5P4Ks protect from metabolic stress was not fully elucidated. Here we provide evidence that the PI5P4Ks have evolved for multicellular organisms to cope with metabolic stress via autophagy, which replenishes intermediates of glucose metabolism, glutathione, and amino acids. Therefore, developing treatments that target the PI5P4Ks as a means to disrupt autophagy in p53 deficient cancer cells is an exciting therapeutic strategy that could minimize toxicity.
STAR METHODS
Contact for Reagent and Resource Sharing
Further information and requests for resources and reagents should be directed to and will be fulfilled by the Lead Contact, Brooke M. Emerling (bemerling@sbpdiscovery.com).
Experimental Model and Subject Details
Mice
Pip4kaflx/flx Pip4kb−/−mice
All animal care and treatments were carried out in compliance with Institutional Animal Care and Use Committee (IACUC) guidelines. Pip4k2aflx/flx (Emerling et al., 2013) and Pip4k2b−/− (Lamia et al., 2004) were crossbred to generate Pip4kaflx/flx Pip4kb−/−mice. Adenovirus CMV-Cre was purchased from the University of Iowa Gene Transfer Vector Core (Iowa City, IA). In brief, 14-16 week old male Pip4kaflx/flx Pip4kb−/− and Pip4kaflx/flx mice were tail-vein or retro-orbital injected with 75ul of adenoviral-Cre or adenoviral empty (titer between 1-4 × 10¹⁰ pfu/ml).
C. elegans Strains, Maintenance, and RNAi Treatments
We used the following strains: N2; ppk-2 (pk1343); ppk-2 (pk1343) qaIs2900 [ppk-2, rol-6 (su1006)]. The ppk-2 deletion allele pk1343 was isolated from an EMS deletion library using nested primers specific for the gene. PCR and sequencing revealed that the deletion breakpoints lie in introns and remove exons 3 and 4. The deletion was outcrossed 7 times, using PCR to follow the allele. Overexpression of ppk-2 was achieved by using a 10.3 kilobase genomic PCR product using primers (AATACCTCTACATCCATCGTG and AAAGCAGAGCAAAATTAGCAGGAG) that was co-injected with RF4 (rol-6) DNA. One of the resulting extrachromosomal arrays was integrated with gamma-irradiation to make the allele qaIs2900. Nematodes were maintained and synchronized using standard culture methods (Brenner, 1974). The RNAi feeding experiments were performed as described in (Kamath et al., 2001), and bacteria transformed with empty vector were used as a control. For all RNAi experiments, phenotypes were scored with the F1 generation.
Cell Lines
All cells were incubated in a 37°C humidified incub ator with 5% CO2. Mouse embryonic fibroblasts (MEFs) were cultured in Dulbecco’s modified Eagle medium (Corning 10-013-CV). All the media was supplemented with 10% fetal bovine serum (Life Technologies), 100 U/ml penicillin/streptomycin (Life Technologies). For MEF generation, pregnant females were sacrificed on E13.5 and the fetuses were surgically removed, placed in a 10-cm dish, and washed twice with PBS. Head and liver were removed from each fetus and the remaining body was minced and pooled in a 50-mL tube and washed again with PBS. Tissue remnants were digested with 5mL of Trypsin 0.25% at room temperature for 30 minutes. The digestion was stopped with DMEM+10% FBS. Cells were then pelleted and washed again with DMEM+10% FBS. Finally cells were seeded in a 15cm dish and cultured in DMEM+10% CS + 0.1 mM β-mercaptoethanol. MEF DNA was prepared from the head using DNeasy (Qiagen) and genotyped using the primer pairs as previously described (Emerling et al., 2013; Lamia et al., 2004). For immortalization of MEFs, the retroviral construct pCMSCV shTrp53-GFP was used (generously provided by Scott Lowe, MSKCC).
For the generation of SV40 MEFs, the retroviral construct pBabe-Zeo-LT-ST was used (generously provided by Jorge Moscat, SBPMDI) and cells were selected post-infection in zeocin (Invivogen). To evaluate p53 response in SV40 MEFs, MEFs were treated with vehicle (DMSO) or 10uM Etoposide (Sigma). 24hrs post-treatment, the media was removed and new media without drug was added back and cells were allowed to grow for 2 more days before being lysed. Cells were washed with ice-cold PBS and lysed with RIPA lysis buffer (Cell Signaling Technology) supplemented with protease and phosphatase inhibitors (Sigma). Protein concentration was measured using Bradford assay (Bio-Rad) and 30ug of protein was loaded and run on 10% SDS-polyacrylamide gels. The proteins were transferred on to nitrocellulose membrane and probed with primary antibody overnight at 4°C. Antibodies used are as follows: anti-p53 (2524; Cell Signaling), P-p53 (9284; Cell Signaling) and α-tubulin (T6199; Sigma).
Method Details
Virus production and infection
293T packaging cell line was used for retroviral amplification. In brief, viruses were collected 48 hours after infection, filtered, and used for infecting cells in the presence of 8 μg/ml polybrene (Sigma), prior to puromycin selection or upon cell sorting for GFP. The packaging plasmid used for retroviral infection was pCL-Eco (Naviaux et al., 1996).
Immunoblot analysis and antibodies
Total cell lysates were prepared by washing cells with cold phosphate-buffered saline. The cells were then lysed with buffer containing 20 mM Tris/HCl (pH 7.5), 150 mM NaCl, 1 mM EDTA, 1mM EGTA, and 1% Triton, as well as protease and phosphatase inhibitors. Protein was measured using the Bradford assay (Bio-Rad) and at least 50 μg of total cell lysates were run on a SDS–polyacrylamide gel electrophoresis. The proteins were transferred on to a nitrocellulose membrane and membranes were probed overnight at 4°C with the appropriate primary antibody. Antibodies used were as follows: PIP4K2α (5527; Cell Signaling), PIP4K2β (9694; Cell Signaling), P-p70S6K (9234; Cell Signaling), p70S6K (9202; Cell Signaling), P-S6 (2211; Cell Signaling), S6 (2217; Cell Signaling), P-4E-BP1 (2855; Cell Signaling), 4E-BP1 (9452; Cell Signaling), LC3B (3868; Cell Signaling), TSC2 (need), MEK1/2 (need) and p53 (2524; Cell Signaling), LC3B (NB600-1384; Novus) and p62 (H00008878-M01; Novus), SREBP1 (sc-366; Santa Cruz), TFEB (Need) and α-tubulin (T6199; Sigma), and GAPDH (ab9485; Abcam) and β-actin (ab8226; Abcam).
Subcellular fractionation
Nuclear and cytosolic fractions of Pip4k2aflx/flx Pip4k2b−/− shTrp53 and Pip4k2a−/−Pip4k2b−/−shTrp53 MEFs were isolated using standard procedures. Briefly, MEFs were plated in 10 cm plates and grown overnight in either 10% FBS or 0.3% FBS overnight. Cells were then washed with PBS, trypsinized and normalized by cell count before proceeding with the subcellular fractionation. Cell pellets were resuspended in lysis buffer (20 mM Hepes pH 7.4, 10 mM KCl, 2 mM MgCl2 1 mM EDTA, 1 mM EGTA, 0.1% NP-40) with DTT and protease inhibitor cocktail (Sigma) and lysed with a dounce homogenizer. Lysed cells were left on ice for 30 min before being spun at 3,000 rpm for 5 min at 4°C. The supernatant was taken as the cytosolic fraction, while the nuclear pellet was washed twice with lysis buffer before being resuspended and sonicated in high salt buffer (20 mM HEPES, pH 7.9, and 1 mM EDTA, 1% SDS) with DTT and protease inhibitors.
Transmission electron microscopic (TEM) analysis
Samples were fixed with a modified Karmovsky’s fix and a secondary fixation in reduced osmium tetroxide. Following dehydration, samples were embedded in an epon analog resin. Ultrathin sections (65 nm) were contrasted with lead citrate and viewed on a JEM 1400 electron microscope (JEOL, USA, Inc., Peabody, MA) operated at 120 kV. Digital images were captured on a Veleta 2K × 2K CCD camera (Olympus-SIS, Germany).
Serum assays
Whole blood glucose was measured in mice using a One Touch UltraMini (LifeScan, Milpitas, CA). Mice were then euthanized with carbon dioxide and cardiac blood was collected for serum separation, which was stored at −20°C. For tissue triglyceride measurement, frozen tissue was weighed and digested in 6 volumes of alcoholic KOH (2:1 EtOH to 30% KOH) at 60°C until tissue was completely dissolved. 500 μL of digest was added to 540 μL of 1M MgCl2 and mixed well. After 10-minute incubation on ice, samples were centrifuged for 30 minutes at max speed. The supernatant was aspirated into a new tube and glycerol content was measured using calorimetric assay (Stanbio, Boerne, TX).
Metabolic analysis by LC/MS/MS
For steady state metabolomic analysis, cell lines were grown to ~50% confluence in growth media on 6 cm dishes in biological quadruplicate. Three wells were used for metabolite extraction (triplicate) and one well for total protein analysis of specific cell line. A complete media change was performed two hours prior to metabolite collection. Cell samples for metabolites were extracted as follows: media aspiration, addition of 1 mL pre-cooled methanol, and immediate cell disruption by cell scraper performed on dry ice. The well for protein analysis was as follows: media aspiration, wash with PBS, cell disruption using 1× lysis buffer (9803; Cell Signaling) using cell scraper on ice. Metabolite samples were added to pre-cooled (dry ice) 2 mL tubes and stored at −80°C. Protein analysis was performed by Bradford Assay for each cell line sample. Appropriate amounts of methanol were extracted to normalize each sample to an equal protein concentration. Samples were then lyophilized for 8 hours and subsequently re-suspended in 20 uL of HPLC grade water.
For liver metabolite preparation, mice were sacrificed using a CO2 induction chamber. Mice were then placed on a surgical stage for necropsy. The abdomen was wetted with 70% ethanol and cardiac puncture was performed for serum analysis. The skin was then cut along the abdomen and pulled aside, revealing the liver. The liver was then removed and the gallbladder carefully excised to avoid puncture. Post-extraction, the liver was carefully patted with lint-free paper and placed on a plastic weigh boat to be sectioned for triplicate samples of appropriate weight measurements (30-60 mg). The sectioning was performed using a sterile, disposable scalpel and quickly weighed using an analytical balance. Weighed samples were then placed in pre-labeled 2 mL tubes and snap-frozen in liquid nitrogen. Frozen samples were then stored at −80°C until extraction. Metabolite extraction was performed utilizing an optimized protocol consisting of a bead-based homogenization step followed by lyophilization. Each sample was transferred to a pre-cooled (dry ice) 2 mL homogenization tube containing a single stainless steel bead (5 mm). Pre-cooled methanol (1 mL) was added to each sample and homogenization was performed using the Qiagen TissueLyser II. Homogenization settings were the same for all samples: three times 30 seconds, 25.0 Hz, with a 2 minute pause between each cycle to place sample on dry ice and maintain freezing temperatures. Samples were then subsequently centrifuged at 4°C for 15 minutes at 14,000 rpm. Th e supernatants were extracted and normalized based on tissue weight. Supernatants were lyophilized for 8 hours and then re-suspended in 20 uL of HPLC grade water. 5 μL aliquots were injected for targeted LC/MS/MS on a 5500 QTRAP hybrid triple-quadrupole mass spectrometer coupled to a Prominence ultrafast liquid chromatography (UFLC) system from 287 selected reaction monitoring (SRM) transitions with positive/negative polarity switching. Samples were separated on a 4.6 mm i.d. × 100 mm Amide XBridge hydrophilic interaction liquid chromatography (HILIC) column at 360 μL/min starting from 85% buffer B (100% ACN) and moving to 0% B over 16 minutes. Buffer A was 20 mM NH4 OH/20 mM CH3 COONH4 (pH = 9.0) in 95:5 water/ACN.
Autophagy flux assays
Autophagy flux was measured using an expression vector encoding the fusion protein mCherry-eGFP-LC3B, which distinguished autophagosomes (mCherry and GFP double positive) and autolysosomes (mCherry only). An increase of total LC3 puncta could either be caused by reduced autophagic degradation (reduction of mCherry puncta) or induced autophagic degradation (increase of mCherry puncta). A pBabe-puro mCherry-eGFP-LC3B plasmid was packaged into retrovirus and transiently infected MEFs (N’Diaye et al., 2009). After puromycin selection, MEFs were grown on cover slips and treated with or without 20μM CQ (StressMarq) for 4 hours. MEFs were then fixed in 4% PFA for 20 minutes and mounted in VECTASHIELD Antifade Mounting Medium with DAPI (Vector lab, CA). Total number of autophagosomes (yellow puncta) and autolysosomes (red puncta) were quantified and compared to total puncta per cell (N=30 cells per condition) for at least three independent experiments. Whole-cell lysates were extracted from MEFs with or without CQ treatment (20μM CQ for 24 hours) and subjected to immunoblot analysis using an anti-LC3 antibody (NB600-1384; Novus) to monitor LC3-I to LC3-II conversion ratio.
RNA-seq analysis
Total RNA from cells was prepared using RNeasy (Qiagen). For mouse livers, livers were snap-frozen for RNA extraction. Extracted RNAs were processed and labeled. 1 ug of total RNA of each sample was submitted to the WCM Genomics Resources Core Facility. Raw sequenced reads were aligned to the Human reference genome (Version Hg19 from UCSC) using STAR (Version 2.4.2) aligner. Aligned reads were quantified against the reference annotation (Hg19 from UCSC) to obtain FPKM (Fragments per Kilobase per million) and raw counts using CuffLinks (v 2.2.1).
qRT-PCR
Total RNA was prepared using RNeasy (Qiagen). cDNA was synthesized using Superscript Vilo (Thermo) and qRT-PCR performed utilizing Fast SYBR green (Thermo) and the Realplex Mastercycler (Eppendorf). For a list of primers used see Table S1. Isolation of mRNA and qPCR was performed as follows. 200,000 cells were plated in 6-well plastic dishes. 24 hours later, the RNA in the lysates was extracted using the RNeasy protocol. The RNA was resuspended in 50 μl H2O at a concentration of 1 μg/μL. cDNA was transcribed using the SuperScript Vilo. The sequences of the oligonucleotides used as primers in the PCR reactions are given in Table S1. The genes that were quantified here were previously shown to be regulated by TFEB (Perera et al., 2015).
Fluorescence microscopy
Pip4k2aflx/flx Pip4k2b−/− shTrp53 and Pip4k2a−/−Pip4k2b−/− shTrp53 MEFs were grown on glass coverslips or on glass bottom plates pre-treated with poly-d-lysine. For serum starvation experiments cells were grown for 18 hours in either DMEM with 10% FBS or 0.3% FBS. When indicated Pip4k2aflx/flx Pip4k2b−/− shTrp53 MEFs were treated with 100nM Torin-1(Tocris) for 2 hours. Adherent cell lines were rinsed with phosphate-buffered saline, pH 7.4 (PBS) and fixed with 4% paraformaldehyde (PFA) in PBS for 15 minutes at room temperature. After fixation, the cells were permeabilized for 10 minutes with PBS/0.1% Triton X-100, blocked for 30 minutes in blocking buffer (PBS with 3% BSA) and labeled with primary antibodies in blocking buffer for 1 hour at room temperature or overnight at 4°C. Alter natively, for staining, LC3B and LAMP1 (ab25245; Abcam) cells were fixed/permeabilized in −20 MeOH for 20 minutes. Coverslips were washed three times with blocking buffer and incubated with Alexa Fluor-conjugated goat secondary antibodies in blocking buffer for 1 hour at room temperature. After incubation with secondary antibodies, coverslips were washed three times with PBS, once with water, and then mounted on a glass microscope slide with Prolong Gold with DAPI (Thermo). The following primary antibodies were used: TFEB (SAB4503154; Sigma), LC3B (3868; Cell signaling), LAMP1 (ab25245; Abcam). Alexa Fluor-conjugated secondary antibodies (Thermo) were used at 1:1000. Fluorescent and phase contrast images were acquired on a Nikon Eclipse Ti microscope equipped with an Andor Zyla sCMOS camera. Within each experiment, exposure times were kept constant and in the linear range throughout. When using the 60× and 100× oil immersion objectives, stacks of images were taken and deconvoluted using AutoQuant (Media Cybernetics).
siRNA transfections
TSC2 and non-targeting siRNAs (Dharmacon) were transfected using the RNAiMAX transfection reagent (Thermo). MEFs in either 6-well plates for western blot or on glass coverslips were transfected with siRNA and assessed at 48 hours post-transfection.
Generation and transduction of GFP and mCherry PIP4K2 lentiviral constructs
Replication-deficient lentiviruses were prepared using a third-generation lentiviral system. Human PIP4K2A or PIP4K2B were inserted into either pRRL-GFP or pRRL-mCherry lentiviral vectors (generously provided by Samie Jaffrey, WCM). Virus was generated by cotransfecting three helper plasmids (pLP1, pLP2, pVSV-G) (generously provided by Samie Jaffrey, WCM) and the vector containing the gene of interest with cis-acting sequences for proper packaging were used to generate pseudovirions. A subconfluent culture of HEK293T cells was transfected using the CalPhos Mammalian Transfection Kit (Clontech). The titer of each virus was determined using HEK293T cells. Viral supernatant was then used to express PIP4K2s in MEFs.
Fluorescent visualization of lipid droplets and lysosomes
MEFs were incubated with 1 μM BODIPY 558/568 C12 (Thermo) or BODIPY 493/503 (Thermo) in DMEM with 10% FBS for 16 hours. Cells were washed three times with PBS, then incubated for 1 hour in order to allow the fluorescent lipids to incorporate into LDs or cellular membranes. To image lysosomes, cells were incubated with 50 nM of either Lysotracker Red DND-99 (Thermo) or Green DND-26 (Thermo) for 1 hour and imaged.
Histology
Fresh liver pieces were fixed for 12 hours in 4% buffered paraformaldehyde (Affymetrix) at 4°C on a shaker and were embedded into paraffin. Standard hematoxylin and eosin staining was performed.
Oil Red O stain of mouse livers
Fresh liver pieces were snap frozen in a 2-methyl butane/dry ice solution and embedded in a cryomold covered with OCT solution (Tissue Tek) in a cryostat. OCT was covered with a cork disk/cryostat holder and 5μM sections at a 5° angle were cut and stored at −80 °C. Sections were fixed in 10% buffered formalin for 10 minutes and rinsed in distilled water. After washing, slides were stained according to the Oil Red O staining kit (Poly Scientific).
Immunofluorescence staining of mouse livers
Freshly harvested liver pieces were fixed for 12 hours in 4% buffered paraformaldehyde (Affymetrix) at 4°C on a shaker. The livers were ch anged into a 30% sucrose in 1X PBS solution for 3 days at 4°C on a shaker. Previously frozen su crose-infiltrated liver pieces were dried using kimwipes. Dry liver pieces were placed into a cryomold, covered with OCT solution (Tissue Tek), and slowly frozen in a cryostat. OCT was covered with a cork disk/cryostat holder. 5 μM sections at a 5° angle were cut and stored at −80°C. Sections were air dried for 12 hours prior to soaking in 1xPBS for 10 minutes at R.T. Tissues were permeabilized by incubating slides in 0.5% Triton-X1 (EMD Chemicals) in 1XPBS for 15 min. Sections were circled with a hydrophobic barrier pen and blocked in 10% goat serum in 1% BSA solution for 1 hour at R.T. Antibodies for LC3B (3868; Cell Signaling) and LAMP-1 (ab25245; Abcam) were used at a 1:100 dilution in 10% goat serum/1% BSA solution overnight at 4°C. After three wash steps in 1xPBS for 10 minutes each, slides were incubated with a CY5 labeled secondary antibody (A-21247 and A-31573; Thermo), at 1:1500 for 45 minutes at R.T. Slides were washed twice using 1xPBS for 10 minutes and cover slipped using the ProLong Gold antifade reagent with DAPI (Thermo).
Immunohistochemistry of mouse livers
Paraffin Sections were dewaxed in xylene and hydrated into graded alcohols. Endogenous peroxidase activity was blocked by immersing the slides in 1% hydrogen peroxide in PBS for 15 minutes. Pretreatment was performed in a steamer using 10mM citrate buffer, pH6.0 for 30 minutes. Sections were incubated overnight with primary antibody Phospho-H2A.X (07-164; Millipore) diluted at 1:500. Sections were washed with PBS and incubated with the appropriate secondary antibody followed by avidin-biotin complexes (PK-6100; Vector Laboratories). Antibody reaction was visualized with 3-3′ Diaminobenzidine (Sigma) and counterstained with hematoxylin. Tissue sections were dehydrated in graded alcohols, cleared in xylene, and mounted. Immunohistochemistry of Cleaved Caspase-3 was performed on a Leica Bond™ RX using the Bond™ Polymer Refine Detection Kit (DS9800; Leica). The sections stained with Cleaved Caspase-3 (9661; Cell Signaling) diluted 1:250, were pre-treated using heat mediated antigen retrieval with Citrate, pH 6 and Epitope Retrieval 1 kit (AR9961; Leica) for 20 minutes. DAB was used as the chromogen, counterstained with hematoxylin, and mounted.
For P-4EBP1 and P-S6 staining, tissues were deparafinized, followed by a retrieval solution of pH 6/H2O for ten minutes. Peroxide solution of 30% in H2O for 25 minutes and primary P-4E-BP1 (2855; Cell Signaling) diluted 1:500 and primary P-S6 ribosomal protein (2211; Cell Signaling) diluted 1:200 for one hour at room temperature. Secondary rabbit-on-rodent HRP (RMR622; Biocare) followed by DAB, counter staining with Hematoxylin and dehydrated stepwise in graded alcohol (70%, 95%, 100%) to Xylene and mounted.
For trichrome staining (K037; Poly Scientific), tissues were deparafinized, followed by mordant in Bouin’s solution for one hour at 56°C, washed in running tap water to remove picric acid for 5 minutes, and rinsed with distilled water. Slides were then placed in Weigert’s working hematoxylin for 10 minutes, washed again in running tap water for 10 minutes, and then rinsed with distilled water three times. Slides were placed in phosphotungstic/phosphomolybdic acid for 15 minutes, and solution was discarded. Slides were transferred directly to aniline blue for 15 minutes and rinsed in distilled water quickly. Slides then were rinsed in 1% acetic acid for 1 minute and transferred to 95% alcohol for 1 minute and then to 100% 2× for 2 minutes each. Slides were transferred to xylene 2× for 2 minutes each and coverslips were mounted with Cytoseal 60.
Cell proliferation assays
To determine cell proliferation, cells were plated at 103 cells per 96-well plate in triplicate. Cells were incubated and assayed at indicated time points using Cell Titer-Glo Luminescent Cell Viability assay (Promega). Cells were allowed to equilibrate to room temperature for 30 minutes; at which time an equal volume of the Cell Titer-Glo reagent was added to cells and mixed for 2 minutes on an orbital shaker, then incubated for 10 minutes at room temperature to stabilize signal, and luminescence was recorded according to the manufacturer’s protocol.
Purification and analysis of C. elegans orthologs
The ppk-1 and ppk-2 coding sequences were amplified out of a C. elegans cDNA library (generously provided by Jeremy Dittman, WCM), cloned into an E. coli expression vector pGEX-4T-2 (GE Healthcare) and purified via GST affinity chromatography using glutathione sepharose (GE Life Sciences). The purified products were incubated with 20 uM of PI-4-P and PI-5-P (Avanti) in a 1:2 mass ratio in phosphatidylserine in the presence of gamma-32P radiolabeled ATP (Perkin Elmer) for 1 hour at 30° C, in a soluti on containing 50 mM HEPES pH 7.3, 10 mM MgCl2, 1 mM EGTA, 2 mM DTT, 50 uM ATP, and 10 uCi of γ-32P radiolabeled ATP. The radiolabeled PI-4,5-P2 products were resolved by thin layer chromatography on a silica membrane with a 65:35 (vol:vol) mixture of 1-propanol and 2 M acetic acid as the mobile phase. The plates were imaged on a Typhoon FLA 7000 (GE).
Oxidative stress resistance assay in C. elegans
Synchronized post fertile animals were transferred to NGM plates supplemented with 4 mM paraquat dichloride (Sigma) and surviving animals were scored daily. For RNAi based experiments, adult worms were allowed to reach the post-fertile phase on RNAi plates to ensure uniformity in the knockdown. Animals that responded by movement to touch with the platinum wire were scored as alive.
Lifespan assay in C. elegans
Wild-type and ppk-2 (pk1343) synchronized first day adult animals were maintained on NGM seeded with OP50 at 20°C and the number of dead animals was monitored daily. Animals that responded by movement to touch with the platinum wire were scored as alive. The assay ended when all animals were scored dead.
Oil-red-O staining for lipids in C. elegans
Oil red O staining in wild-type and ppk-2 (pk1343) animals was performed in synchronized one day old animals. Animals were washed twice in PBS, fixed in 60% isopropanol and incubated for 15 min at room temperature with gentle agitation. Animals were resuspended into oil red O dye solution (0.5% oil red O in 100% isopropanol) and incubated overnight on rotating rack. The next day, dye was removed and animals were washed twice in 1 ml of PBS, mounted, and imaged using the ×10 objective. Oil red O staining was quantified using ImageJ from at least 30 animals per condition. Experiments have been performed three times. The quantification of the staining intensity has been performed using Image J.
Quantification and Statistical Analysis
For metabolite analysis, Q3 peak areas were integrated by use of MultiQuant 2.1 software (AB/SCIEX). Qlucore Omics Explorer 3.0 software (Qlucore) was used to normalize data, calculate heat maps, and to perform pathway analysis.
For statistical analysis of RNA-sequencing, the normalized expression values (FPKM) were performed using the Qlucore Omics Explorer 3.0 software (Qlucore). The identification of significantly differential variables between the subgroups of mRNA expression was performed using either two- or multi-group comparisons. P-values were adjusted for multiple tests using the Benjamini-Hochberg method (Benjamini and Hochberg, 1995), and variables with adjusted p-values below 0.05 were considered significant. Pathway analysis using GSEA (Gene Set Enrichment Analysis) software from Broad institute was used to identify functions of differentially expressed genes. Genes were ranked by the t-statistic value obtained from comparisons and the pre-ranked version of the tool was used to identify significantly enriched KEGG pathways. ConsensusPathDB was used for gene-symbol based pathway analysis (http://cpdb.molgen.mpg.de/). Pathways were considered significant with an FDR cutoff of 0.1. Hierarchical cluster analysis of differentially expressed mRNA was performed using the Qlucore OMICS explorer.
Statistical analysis of fluorescence intensity values (arbitrary units, AU) were calculated using NIS-Elements Advanced Research version 3.1 software (Nikon). All graphs and statistical P values were generated using Prism version 4.0. All data are presented as mean ± SEM. For nuclear imaging, the randomly selected fields were selected based exclusively on the presence of nuclei, as assessed by DAPI staining, not on TFEB levels. Cellular fluorescence was quantified using a deconvolution microscope (Nikon TE-2000) with a 60× or 100× oil immersion objective. An optical stack of 3 μm thickness divided into 11 images was centered on the point at which the edge of the nuclei was in focus. Autoquant software from Media Cybernetics was used to deconvolute Z-series images. Care was taken to ensure the morphology, size, and height of each nuclei relative to the cell body was consistent among all treatments.
For all C. elegans experiments, data is expressed as means ±SEM. Statistical analyses for all data were performed by student’s t-test, using Excel (Microsoft, Albuquerque, NM, USA). For survival lifespan and oxidative stress curve comparisons we used the Log-rank Mantel Cox test using GraphPad software. Statistical significance is indicated in figures (* p<0.05, **p<0.01, ***p<0.001) or included in the supplemental tables.
KEY RESOURCES TABLE
| REAGENT or RESOURCE | SOURCE | IDENTIFIER |
|---|---|---|
| Antibodies | ||
| anti-p53 | Cell Signaling Technology | Cat# 2524, RRID:AB_331743 |
| anti-p53 HUMAN | Cell Signaling Technology | Cat# 9282, RRID:AB_331476 |
| anti-phospho-p53 | Cell Signaling Technology | Cat# 9284, RRID:AB_331464 |
| anti-α-tubulin | Sigma | Cat# T6199, RRID: AB_477583 |
| anti-PIP4K2α | Cell Signaling Technology | Cat# 5527, RRID:AB_2722636 |
| anti-PIP4K2β | Cell Signaling Technology | Cat# 9694, RRID:AB_2164572 |
| anti-phospho-p70 S6 kinase | Cell Signaling Technology | Cat# 9234, RRID:AB_2269803 |
| anti-p70 S6 kinase | Cell Signaling Technology | Cat# 9202, RRID:AB_331676 |
| anti-phospho-S6 | Cell Signaling Technology | Cat# 2211, RRID:AB_331679 |
| anti-S6 | Cell Signaling Technology | Cat# 2217, RRID:AB_331355 |
| anti-phospho-4E-BP1 | Cell Signaling Technology | Cat# 2855, RRID:AB_560835 |
| anti-4E-BP1 | Cell Signaling Technology | Cat# 9452, RRID:AB_331692 |
| anti-LC3B | Cell Signaling Technology | Cat# 3868, RRID:AB_2137707 |
| anti-TSC2 | Cell Signaling Technology | Cat# 4308, RRID:AB_10547134 |
| anti-MEK1/2 | Cell Signaling Technology | Cat# 8727, RRID:AB_10829473 |
| anti-LC3B | Novus Biologicals | Cat# NB600-1384, RRID:AB_669581 |
| anti-p62/SQSTM1 | Novus Biologicals | Cat# H00008878-M01, RRID:AB_548364 |
| anti-SREBP-1 | Santa Cruz Biotechnology, Inc. | Cat# sc-366, RRID:AB_2194229 |
| anti-TFEB | Sigma | Cat# SAB4503154, RRID:AB_10761398 |
| anti-GAPDH | Abcam | Cat# ab9485, RRID:AB_307275 |
| anti b-actin | Abcam | Cat# ab8226, RRID:AB_306371 |
| Donkey anti-Rabbit IgG Alexa Fluor 647 | Thermo | Cat# A-31573, RRID:AB_2536183 |
| Donkey anti-Mouse IgG Alexa Fluor 647 | Thermo | Cat# A-31571, RRID:AB_162542 |
| Donkey anti-Mouse IgG Alexa Fluor 488 | Thermo | Cat# A-21202, RRID:AB_141607 |
| Donkey anti-Rabbit IgG Alexa Fluor 488 | Thermo | Cat# A-21206, RRID:AB_2535792 |
| Goat anti-Rat IgG Alexa Fluor 647 | Thermo Fisher | Cat# A-21247, RRID:AB_141778 |
| anti-LAMP1 | Abcam | Cat# ab25245, RRID:AB_449893 |
| anti-phospho-H2A.X | Millipore | Cat# 07-164, RRID:AB_310406 |
| anti-cleaved caspase-3 | Cell Signaling Technology | Cat# 9961, RRID:AB_10697500 |
| anti-rabbit-on-rodent HRP-POLYMER | Biocare Medical | Cat# RMR622 |
| Bacterial and Virus Strains | ||
| Ad5CMVCre | University of Iowa Gene Transfer Vector Core | VVC-U of Iowa-5 |
| Ad5CMVEmpty | University of Iowa Gene Transfer Vector Core | VVC-U of Iowa-272 |
| Chemicals, Peptides, and Recombinant Proteins | ||
| Etoposide | Sigma | Cat# E1383 |
| RIPA lysis buffer | Cell Signaling Technology | Cat# 9806 |
| cOmplete™ ULTRA Tablets, Protease Inhibitor Cocktail | Sigma | Cat# 5892970001 |
| Lysis Buffer | Cell Signaling Technology | Cat# 9803 |
| BODIPY 558/568 C12 | Thermo | Cat# D3835 |
| BODIPY 493/503 | Thermo | Cat# D3922 |
| paraquat | Sigma | Cat# 36541 |
| zeocin | Invivogen | Cat# ant-zn-1 |
| Polybrene | Millipore Sigma | Cat# TR-1003-G |
| Puromycin | Invivogen | Cat# ant-pr-1 |
| Chloroquine | StressMarq Biosciences inc | Cat# SIH-405 |
| Torin-1 | Tocris | Cat# 4247 |
| 4% buffered paraformaldehyde | Affymetrix/Alfa Aesar | Cat# J19943K2 |
| OCT Solution | TissueTek | Cat# 4583 |
| Lysotracker Red DND-99 | Thermo Fisher | Cat# L7528 |
| Lysotraker Green DND-26 | Thermo Fisher | Cat# L7526 |
| VECTASHIELD Antifade Mounting Medium with DAPI | Vector Lab | Cat# H-1200 |
| Superscript Vilo | Thermo Fisher | Cat# 11756050 |
| Fast SYBR green | Thermo Fisher | Cat# 4385610 |
| Prolong Gold with DAPI | Thermo Fisher | Cat# P36941 |
| RNAiMAX transfection reagent | Thermo Fisher | Cat# 13778500 |
| 3-3′ Diaminobenzidine | Sigma | Cat# D8001 |
| Trichrome Stain | Poly Scientific | Cat# K037 |
| Methyl viologen dichloride hydrate | Sigma | Cat# 856177 |
| gamma-32P radiolabeled ATP | Perkin Elmer | Cat# NEG002A100UC |
| Critical Commercial Assays | ||
| Bio-Rad Protein Assay Kit II | Bio-Rad | Cat# 5000002 |
| RNeasy Mini Kit | Qiagen | Cat# 74104 |
| CalPhos Mammalian Transfection Kit | Clontech | Cat# 631312 |
| Oil Red O Kit | Poly Scientific R&D | Cat# k043 |
| Bond™ Polymer Refine Detection Kit | Leica | Cat# DS9800 |
| Leica Biosystem Epitope Retrieval 1 | Leica | Cat# AR9961 |
| Cell Titer-Glo Luminescent Cell Viability assay | Promega | Cat# G7570 |
| Triglyceride Liquid Calorimetric Assay | Stanbio (EKF) | Cat# 2100-430 |
| VECTASTAIN® Elite® ABC-HRP Kit | Vector Laboratories | Cat# PK-6100 |
| DNeasy Blood & Tissue Kit | Qiagen | Cat# 69504 |
| Experimental Models: Cell Lines | ||
| 293T | ATCC | CRL-3216™ |
| Mouse embryonic fibroblast cells | This paper | N/A |
| Experimental Models: Organisms/Strains | ||
| Pip4kaflx/flx Pip4kb−/−mice | This Paper | N/A |
| Pip4kaflx/flx | This Paper | N/A |
| ppk-2 (pk1343) | This Paper | N/A |
| ppk-2; rol-6 (su1006) | This Paper | N/A |
| Oligonucleotides | ||
| A full list of qPCR primers synthesized is included in Table S4 | This Paper | N/A |
| Primer ppk-2 F: AATACCTCTACATCCATCGTG | This Paper | N/A |
| Primer ppk-2 R:AAAGCAGAGCAAAATTAGCAGGAG | This Paper | N/A |
| Recombinant DNA | ||
| pCMSCV shTrp53-GFP | gift from Scott Lowe | N/A |
| pBabe-Zeo-LT-ST | gift from Jorge Moscat | N/A |
| pCL-Eco | Verma et al., 1996 | Addgene Plasmid #12371 |
| pBabe-puro mCherry-eGFP-LC3B | Debnath et al., 2009 | Addgene Plasmid # 22418 |
| pLP1 | gift from Samie Jaffrey | N/A |
| pLP2 | gift from Samie Jaffrey | N/A |
| pVSV-G | gift from Samie Jaffrey | N/A |
| pGEX-4T-2 | GE Healthcare | Cat# 28954550 |
| pRRL-GFP | gift from Samie Jaffrey | N/A |
| pRRL-mCherry | gift from Samie Jaffrey | N/A |
| pRRL-GFP-PIP4K2A | This Paper | N/A |
| pRRL-mCherry-PIP4K2A | This Paper | N/A |
| pRRL-GFP-PIP4K2B | This Paper | N/A |
| pRRL-mCherry-PIP4K2B | This Paper | N/A |
| Software and Algorithms | ||
| MultiQuant 2.1 software | AB/SCIEX | https://sciex.com/products/software/multiquant-software |
| Qlucore Omics Explorer 3.0 | Qlucore | https://www.qlucore.com/ |
| STAR 2.4.2 (Version Hg19) | UCSC | http://hgdownload.cse.ucsc.edu/downloads.html |
| CuffLinks 2.2.1 | Trapnell Lab | http://cole-trapnell-lab.github.io/cufflinks/install/ |
| GSEA | Broad Institute | http://software.broadinstitute.org/gsea/index.jsp |
| ConsensusPathDB | Kamburov et al. | http://cpdb.molgen.mpg.de/ |
| AutoQuant X3 | Media Cybernetics | http://www.mediacy.com/autoquantx3 |
| NIS-Elements Advanced Research 3.1 | Nikon | https://www.nikoninstruments.com/Products/Software/NIS-Elements-Advanced-Research |
| Image J | Public Domain | http://imagej.net/ |
| Prism v4 | GraphPad Software | https://www.graphpad.com/scientific-software/prism/ |
| Other | ||
| TSC2 and non-targeting siRNAs | Dharmacon | Cat# L-047050-00-0005 NT D-001810-01-05 |
| glutathione sepharose | GE Life Sciences | Cat# 17075601 |
| 18:1 PI(4)P | Avanti | Cat# 850151P |
| 18:1 PI(5)P | Avanti | Cat# 850152P |
| DMEM | Corning | 10-013-CV |
| C. elegans cDNA library | Gift from Jeremy Dittman, WCM | N/A |
Supplementary Material
Table S1. Related to Figures 1 and S1. Mouse liver metabolites.
Table S2. Related to Figures 4 and 5. MEF RNA-Sequencing.
Table S3. Related to Figures 6 and S4. MEF metabolites.
Highlights.
Multicellular organisms evolved the PI5P4K pathway to survive metabolic stress
PI5P4K loss induces decreased mTORC1 and increased TFEB pathway signaling
PI5P4Ks are required for autophagosome-lysosome fusion
PI5P4Ks are attractive targets for cancer and autophagy-related conditions
Acknowledgments
Research was supported by grants from DOD (W81XWH-14-10440), Mary Kay Foundation (011-15.16), and AACR (16-20-26) to B.M.E; NIH (R35 CA197588, R01 GM41890) and The Lustgarten Foundation to L.C.C; NCI (R01CA157490, R01CA188048 and P01CA117969), ACS Research Scholar (RSG-13-298-01-TBG), and NIH (R01GM095567) to A.C.K. We thank Maria Jiaom and Kim McBride of the MSKCC Laboratory of Comparative Pathology, Jason McCormick of the WCM Flow Cytometry Core, Lee Cohen-Gould and Juan Pablo Jimenez of the WCM Imaging Core, and Gia Garcia and Monica Sevilla of the SBP Histology Core (NCI P30 CA030199) for technical assistance. We thank Oksana Mashadova and Costas Lyssiotis for technical help with metabolite processing and analysis. We thank Lavinia Palamiuc for artwork and Tara Mabry for critical reading of the manuscript.
Footnotes
Publisher's Disclaimer: This is a PDF file of an unedited manuscript that has been accepted for publication. As a service to our customers we are providing this early version of the manuscript. The manuscript will undergo copyediting, typesetting, and review of the resulting proof before it is published in its final citable form. Please note that during the production process errors may be discovered which could affect the content, and all legal disclaimers that apply to the journal pertain.
Author Contributions
B.M.E, M.R.L, M.D.G., and L.C.C devised and coordinated project; B.M.E., M.R.L., R.M.L., M.D.G., A.Y., A.R., Z.Y., K.S.H, performed experiments; C.P. provided pathologist expertise for histological analysis; T.V and E.P performed C. elegans experiments; D.W and N.D. generated ppk-2 C. elegans; A.V. participated in the generation and RNA-seq data; J.A. performed targeted LC/MS/MS on metabolites; J.L.J, J.Y. and Y.M performed in vitro kinase assays; O.E., M.R., A.K., A.P. analyzed data; R.M.L designed artwork model; B.M.E., L.C.C., M.R.L., and M.D.G. wrote manuscript.
Declaration of Interests
L.C.C is a founder and member of the SAB and BOD of Agios and Petra Pharma, companies developing drugs to target metabolism. B.M.E is a consultant for Petra Pharma. A.C.K has financial interests in Vescor Therapeutics, LLC. A.C.K. is an inventor on patents pertaining to Kras regulated metabolic pathways, redox control pathways in pancreatic cancer, targeting GOT1 as a therapeutic approach, and the autophagic control of iron metabolism. A.C.K is on the SAB of Cornerstone Pharmaceuticals.
References
- Akil A, Peng J, Omrane M, Gondeau C, Desterke C, Marin M, Tronchere H, Taveneau C, Sar S, Briolotti P, et al. Septin 9 induces lipid droplets growth by a phosphatidylinositol-5-phosphate and microtubule-dependent mechanism hijacked by HCV. Nat Commun. 2016;7:12203. doi: 10.1038/ncomms12203. [DOI] [PMC free article] [PubMed] [Google Scholar]
- Ban H, Shigemitsu K, Yamatsuji T, Haisa M, Nakajo T, Takaoka M, Nobuhisa T, Gunduz M, Tanaka N, Naomoto Y. Arginine and Leucine regulate p70 S6 kinase and 4E-BP1 in intestinal epithelial cells. Int J Mol Med. 2004;13:537–543. [PubMed] [Google Scholar]
- Benjamini Y, Hochberg Y. Controlling the False Discovery Rate: A Practical and Powerful Approach to Multiple Testing. Journal of the Royal Statistical Society. Series B (Methodological) 1995;57:289–300. [Google Scholar]
- Brenner S. The genetics of Caenorhabditis elegans. Genetics. 1974;77:71–94. doi: 10.1093/genetics/77.1.71. [DOI] [PMC free article] [PubMed] [Google Scholar]
- de Lartigue J, Polson H, Feldman M, Shokat K, Tooze SA, Urbe S, Clague MJ. PIKfyve regulation of endosome-linked pathways. Traffic. 2009;10:883–893. doi: 10.1111/j.1600-0854.2009.00915.x. [DOI] [PMC free article] [PubMed] [Google Scholar]
- De Leo MG, Staiano L, Vicinanza M, Luciani A, Carissimo A, Mutarelli M, Di Campli A, Polishchuk E, Di Tullio G, Morra V, et al. Autophagosome-lysosome fusion triggers a lysosomal response mediated by TLR9 and controlled by OCRL. Nat Cell Biol. 2016;18:839–850. doi: 10.1038/ncb3386. [DOI] [PMC free article] [PubMed] [Google Scholar]
- Dibble CC, Manning BD. Signal integration by mTORC1 coordinates nutrient input with biosynthetic output. Nat Cell Biol. 2013;15:555–564. doi: 10.1038/ncb2763. [DOI] [PMC free article] [PubMed] [Google Scholar]
- Efeyan A, Zoncu R, Sabatini DM. Amino acids and mTORC1: from lysosomes to disease. Trends Mol Med. 2012;18:524–533. doi: 10.1016/j.molmed.2012.05.007. [DOI] [PMC free article] [PubMed] [Google Scholar]
- Emerling BM, Hurov JB, Poulogiannis G, Tsukazawa KS, Choo-Wing R, Wulf GM, Bell EL, Shim HS, Lamia KA, Rameh LE, et al. Depletion of a putatively druggable class of phosphatidylinositol kinases inhibits growth of p53-null tumors. Cell. 2013;155:844–857. doi: 10.1016/j.cell.2013.09.057. [DOI] [PMC free article] [PubMed] [Google Scholar]
- Guo JY, Karsli-Uzunbas G, Mathew R, Aisner SC, Kamphorst JJ, Strohecker AM, Chen G, Price S, Lu W, Teng X, et al. Autophagy suppresses progression of K-ras-induced lung tumors to oncocytomas and maintains lipid homeostasis. Genes Dev. 2013;27:1447–1461. doi: 10.1101/gad.219642.113. [DOI] [PMC free article] [PubMed] [Google Scholar]
- Gupta A, Toscano S, Trivedi D, Jones DR, Mathre S, Clarke JH, Divecha N, Raghu P. Phosphatidylinositol 5-phosphate 4-kinase (PIP4K) regulates TOR signaling and cell growth during Drosophila development. Proc Natl Acad Sci U S A. 2013;110:5963–5968. doi: 10.1073/pnas.1219333110. [DOI] [PMC free article] [PubMed] [Google Scholar]
- Hansen M, Chandra A, Mitic LL, Onken B, Driscoll M, Kenyon C. A role for autophagy in the extension of lifespan by dietary restriction in C. elegans. PLoS Genet. 2008;4:e24. doi: 10.1371/journal.pgen.0040024. [DOI] [PMC free article] [PubMed] [Google Scholar]
- Hansen TE, Johansen T. Following autophagy step by step. BMC Biol. 2011;9:39. doi: 10.1186/1741-7007-9-39. [DOI] [PMC free article] [PubMed] [Google Scholar]
- Hara K, Yonezawa K, Weng QP, Kozlowski MT, Belham C, Avruch J. Amino acid sufficiency and mTOR regulate p70 S6 kinase and eIF-4E BP1 through a common effector mechanism. J Biol Chem. 1998;273:14484–14494. doi: 10.1074/jbc.273.23.14484. [DOI] [PubMed] [Google Scholar]
- Hasegawa J, Iwamoto R, Otomo T, Nezu A, Hamasaki M, Yoshimori T. Autophagosome-lysosome fusion in neurons requires INPP5E, a protein associated with Joubert syndrome. Embo J. 2016;35:1853–1867. doi: 10.15252/embj.201593148. [DOI] [PMC free article] [PubMed] [Google Scholar]
- Huang J, Manning BD. The TSC1-TSC2 complex: a molecular switchboard controlling cell growth. Biochem J. 2008;412:179–190. doi: 10.1042/BJ20080281. [DOI] [PMC free article] [PubMed] [Google Scholar]
- Huang J, Manning BD. A complex interplay between Akt, TSC2 and the two mTOR complexes. Biochem Soc Trans. 2009;37:217–222. doi: 10.1042/BST0370217. [DOI] [PMC free article] [PubMed] [Google Scholar]
- Huang R, Liu W. Identifying an essential role of nuclear LC3 for autophagy. Autophagy. 2015;11:852–853. doi: 10.1080/15548627.2015.1038016. [DOI] [PMC free article] [PubMed] [Google Scholar]
- Huard J, Lochmuller H, Acsadi G, Jani A, Massie B, Karpati G. The route of administration is a major determinant of the transduction efficiency of rat tissues by adenoviral recombinants. Gene Ther. 1995;2:107–115. [PubMed] [Google Scholar]
- Kamath RS, Martinez-Campos M, Zipperlen P, Fraser AG, Ahringer J. Effectiveness of specific RNA-mediated interference through ingested double-stranded RNA in Caenorhabditis elegans. Genome Biol. 2001;2 doi: 10.1186/gb-2000-2-1-research0002. RESEARCH0002. [DOI] [PMC free article] [PubMed] [Google Scholar]
- Karsli-Uzunbas G, Guo JY, Price S, Teng X, Laddha SV, Khor S, Kalaany NY, Jacks T, Chan CS, Rabinowitz JD, et al. Autophagy is required for glucose homeostasis and lung tumor maintenance. Cancer Discov. 2014;4:914–927. doi: 10.1158/2159-8290.CD-14-0363. [DOI] [PMC free article] [PubMed] [Google Scholar]
- Klionsky DJ, Abdalla FC, Abeliovich H, Abraham RT, Acevedo-Arozena A, Adeli K, Agholme L, Agnello M, Agostinis P, Aguirre-Ghiso JA, et al. Guidelines for the use and interpretation of assays for monitoring autophagy. Autophagy. 2012;8:445–544. doi: 10.4161/auto.19496. [DOI] [PMC free article] [PubMed] [Google Scholar]
- Komatsu M, Waguri S, Ueno T, Iwata J, Murata S, Tanida I, Ezaki J, Mizushima N, Ohsumi Y, Uchiyama Y, et al. Impairment of starvation-induced and constitutive autophagy in Atg7-deficient mice. J Cell Biol. 2005;169:425–434. doi: 10.1083/jcb.200412022. [DOI] [PMC free article] [PubMed] [Google Scholar]
- Kuma A, Hatano M, Matsui M, Yamamoto A, Nakaya H, Yoshimori T, Ohsumi Y, Tokuhisa T, Mizushima N. The role of autophagy during the early neonatal starvation period. Nature. 2004;432:1032–1036. doi: 10.1038/nature03029. [DOI] [PubMed] [Google Scholar]
- Lamia KA, Peroni OD, Kim YB, Rameh LE, Kahn BB, Cantley LC. Increased insulin sensitivity and reduced adiposity in phosphatidylinositol 5-phosphate 4-kinase beta−/− mice. Mol Cell Biol. 2004;24:5080–5087. doi: 10.1128/MCB.24.11.5080-5087.2004. [DOI] [PMC free article] [PubMed] [Google Scholar]
- Lapierre LR, Silvestrini MJ, Nunez L, Ames K, Wong S, Le TT, Hansen M, Melendez A. Autophagy genes are required for normal lipid levels in C. elegans. Autophagy. 2013;9:278–286. doi: 10.4161/auto.22930. [DOI] [PMC free article] [PubMed] [Google Scholar]
- Lecompte O, Poch O, Laporte J. PtdIns5P regulation through evolution: roles in membrane trafficking? Trends Biochem Sci. 2008;33:453–460. doi: 10.1016/j.tibs.2008.07.002. [DOI] [PubMed] [Google Scholar]
- Ludwig T, Eggenschwiler J, Fisher P, D’Ercole AJ, Davenport ML, Efstratiadis A. Mouse mutants lacking the type 2 IGF receptor (IGF2R) are rescued from perinatal lethality in Igf2 and Igf1r null backgrounds. Dev Biol. 1996;177:517–535. doi: 10.1006/dbio.1996.0182. [DOI] [PubMed] [Google Scholar]
- Marino G, Pietrocola F, Eisenberg T, Kong Y, Malik SA, Andryushkova A, Schroeder S, Pendl T, Harger A, Niso-Santano M, et al. Regulation of autophagy by cytosolic acetyl-coenzyme A. Mol Cell. 2014;53:710–725. doi: 10.1016/j.molcel.2014.01.016. [DOI] [PubMed] [Google Scholar]
- Mizushima N, Komatsu M. Autophagy: renovation of cells and tissues. Cell. 2011;147:728–741. doi: 10.1016/j.cell.2011.10.026. [DOI] [PubMed] [Google Scholar]
- Mizushima N, Yamamoto A, Matsui M, Yoshimori T, Ohsumi Y. In vivo analysis of autophagy in response to nutrient starvation using transgenic mice expressing a fluorescent autophagosome marker. Mol Biol Cell. 2004;15:1101–1111. doi: 10.1091/mbc.E03-09-0704. [DOI] [PMC free article] [PubMed] [Google Scholar]
- N’Diaye EN, Kajihara KK, Hsieh I, Morisaki H, Debnath J, Brown EJ. PLIC proteins or ubiquilins regulate autophagy-dependent cell survival during nutrient starvation. EMBO Rep. 2009;10:173–179. doi: 10.1038/embor.2008.238. [DOI] [PMC free article] [PubMed] [Google Scholar]
- Naviaux RK, Costanzi E, Haas M, Verma IM. The pCL vector system: rapid production of helper-free, high-titer, recombinant retroviruses. J Virol. 1996;70:5701–5705. doi: 10.1128/jvi.70.8.5701-5705.1996. [DOI] [PMC free article] [PubMed] [Google Scholar]
- Perera RM, Stoykova S, Nicolay BN, Ross KN, Fitamant J, Boukhali M, Lengrand J, Deshpande V, Selig MK, Ferrone CR, et al. Transcriptional control of autophagy-lysosome function drives pancreatic cancer metabolism. Nature. 2015;524:361–365. doi: 10.1038/nature14587. [DOI] [PMC free article] [PubMed] [Google Scholar]
- Possik E, Jalali Z, Nouet Y, Yan M, Gingras MC, Schmeisser K, Panaite L, Dupuy F, Kharitidi D, Chotard L, et al. Folliculin regulates ampk-dependent autophagy and metabolic stress survival. PLoS Genet. 2014;10:e1004273. doi: 10.1371/journal.pgen.1004273. [DOI] [PMC free article] [PubMed] [Google Scholar]
- Rameh LE. Type 2 PIP4-kinases In Handbook of Cellular Signaling. Elsevier; 2010. pp. 1043–1048. [Google Scholar]
- Rameh LE, Tolias KF, Duckworth BC, Cantley LC. A new pathway for synthesis of phosphatidylinositol-4,5-bisphosphate. Nature. 1997;390:192–196. doi: 10.1038/36621. [DOI] [PubMed] [Google Scholar]
- Roczniak-Ferguson A, Petit CS, Froehlich F, Qian S, Ky J, Angarola B, Walther TC, Ferguson SM. The transcription factor TFEB links mTORC1 signaling to transcriptional control of lysosome homeostasis. Sci Signal. 2012;5:ra42. doi: 10.1126/scisignal.2002790. [DOI] [PMC free article] [PubMed] [Google Scholar]
- Sardiello M, Palmieri M, di Ronza A, Medina DL, Valenza M, Gennarino VA, Di Malta C, Donaudy F, Embrione V, Polishchuk RS, et al. A gene network regulating lysosomal biogenesis and function. Science. 2009;325:473–477. doi: 10.1126/science.1174447. [DOI] [PubMed] [Google Scholar]
- Settembre C, Ballabio A. TFEB regulates autophagy: an integrated coordination of cellular degradation and recycling processes. Autophagy. 2011;7:1379–1381. doi: 10.4161/auto.7.11.17166. [DOI] [PubMed] [Google Scholar]
- Settembre C, Zoncu R, Medina DL, Vetrini F, Erdin S, Erdin S, Huynh T, Ferron M, Karsenty G, Vellard MC, et al. A lysosome-to-nucleus signalling mechanism senses and regulates the lysosome via mTOR and TFEB. Embo J. 2012;31:1095–1108. doi: 10.1038/emboj.2012.32. [DOI] [PMC free article] [PubMed] [Google Scholar]
- Shim H, Wu C, Ramsamooj S, Bosch KN, Chen Z, Emerling BM, Yun J, Liu H, Choo-Wing R, Yang Z, et al. Deletion of the gene Pip4k2c, a novel phosphatidylinositol kinase, results in hyperactivation of the immune system. Proc Natl Acad Sci U S A. 2016;113:7596–7601. doi: 10.1073/pnas.1600934113. [DOI] [PMC free article] [PubMed] [Google Scholar]
- Shisheva A. PtdIns5P: news and views of its appearance, disappearance and deeds. Arch Biochem Biophys. 2013;538:171–180. doi: 10.1016/j.abb.2013.07.023. [DOI] [PMC free article] [PubMed] [Google Scholar]
- Song K, Russo G, Krauss M. Septins As Modulators of Endo-Lysosomal Membrane Traffic. Front Cell Dev Biol. 2016;4:124. doi: 10.3389/fcell.2016.00124. [DOI] [PMC free article] [PubMed] [Google Scholar]
- Stein BL, Wexler MJ. Preoperative parathyroid localization: a prospective evaluation of ultrasonography and thallium-technetium scintigraphy in hyperparathyroidism. Can J Surg. 1990;33:175–180. [PubMed] [Google Scholar]
- Tan X, Thapa N, Choi S, Anderson RA. Emerging roles of PtdIns(4,5)P2–beyond the plasma membrane. J Cell Sci. 2015;128:4047–4056. doi: 10.1242/jcs.175208. [DOI] [PMC free article] [PubMed] [Google Scholar]
- Vicinanza M, Korolchuk VI, Ashkenazi A, Puri C, Menzies FM, Clarke JH, Rubinsztein DC. PI(5)P Regulates Autophagosome Biogenesis. Mol Cell. 2015 doi: 10.1016/j.molcel.2014.12.007. [DOI] [PMC free article] [PubMed] [Google Scholar]
- Weinkove D, Bastiani M, Chessa TA, Joshi D, Hauth L, Cooke FT, Divecha N, Schuske K. Overexpression of PPK-1, the Caenorhabditis elegans Type I PIP kinase, inhibits growth cone collapse in the developing nervous system and causes axonal degeneration in adults. Dev Biol. 2008;313:384–397. doi: 10.1016/j.ydbio.2007.10.029. [DOI] [PMC free article] [PubMed] [Google Scholar]
- Willenborg M, Panten U, Rustenbeck I. Triggering and amplification of insulin secretion by dimethyl alpha-ketoglutarate, a membrane permeable alpha-ketoglutarate analogue. Eur J Pharmacol. 2009;607:41–46. doi: 10.1016/j.ejphar.2009.02.014. [DOI] [PubMed] [Google Scholar]
- Zhang Y, Goldman S, Baerga R, Zhao Y, Komatsu M, Jin S. Adipose-specific deletion of autophagy-related gene 7 (atg7) in mice reveals a role in adipogenesis. Proc Natl Acad Sci U S A. 2009;106:19860–19865. doi: 10.1073/pnas.0906048106. [DOI] [PMC free article] [PubMed] [Google Scholar]
Associated Data
This section collects any data citations, data availability statements, or supplementary materials included in this article.
Supplementary Materials
Table S1. Related to Figures 1 and S1. Mouse liver metabolites.
Table S2. Related to Figures 4 and 5. MEF RNA-Sequencing.
Table S3. Related to Figures 6 and S4. MEF metabolites.