Abstract
The architecture of multi-layer imagers (MLIs) can be exploited to provide megavoltage spectral imaging (MVSPI) for specific imaging tasks. In the current work, we investigated bone suppression and gold fiducial contrast enhancement as two clinical tasks which could be improved with spectral imaging. A method based on analytical calculations that enables rapid investigation of MLI component materials and thicknesses was developed and validated against Monte Carlo computations. The figure of merit for task-specific imaging performance was the contrast-to-noise ratio (CNR) of the gold fiducial when the CNR of bone was equal to zero after a weighted subtraction of the signals obtained from each MLI layer. Results demonstrated a sharp increase in the CNR of gold when the build-up component or scintillation materials and thicknesses were modified. The potential for low-cost, prompt implementation of specific modifications (e.g. composition of the build-up component) could accelerate clinical translation of MVSPI.
1. Introduction
Megavoltage spectral imaging (MVSPI) of clinical radiotherapy x-ray beams was recently proposed with a novel multi-layered imager (MLI) (Myronakis et al., 2017). The MLI design was composed of four layers of conventional electronic portal imaging devices (EPID) made of copper (Cu), gadolinium oxysulfide (GOS) and amorphous silicon (aSi) components (Rottmann et al., 2016). Initial results have shown some enhancement in visibility of gold fiducials, which can be obscured by bone in conventional MV EPID images.
Spectral separation using layered detectors is determined, by the difference in the absorbed energy spectrum between each layer. The energy absorption spectrum depends on the quantum efficiency and the energy absorption efficiency of each layer. In the MLI, the similar energy absorption characteristics of each phosphor component limits the separation of the energy-absorption spectrum between different layers. We hypothesize that detector parameters such as the number of layers, scintillation material and thickness can be optimized for specific tasks (e.g. bone suppression and/or fiducial enhancement).
Material enhancement/suppression has been demonstrated by spectral imaging in kV x-ray beams (Alvarez and Macovski, 1976; Brooks and Di Chiro, 1978; Brody et al., 1981; Kalender et al., 1986; Cardinal and Fenster, 1990; Shkumat et al., 2008; Hoggarth et al., 2013; Patel et al., 2014). Earlier studies enhanced or suppressed specific materials through decomposition based on a predefined attenuation calibration (Alvarez and Macovski, 1976; Brooks and Di Chiro, 1978; Brody et al., 1981; Kalender et al., 1986; Cardinal and Fenster, 1990). More recent studies used a weighted subtraction approach that does not require such calibration and can be readily implemented computationally (Shkumat et al., 2008; Hoggarth et al., 2013; Patel et al., 2014). Our previous work used this to take advantage of beam hardening between the MLI components at clinical photon beam energies (Myronakis et al., 2017).
The photon energy range present in clinical megavoltage beams (e.g. 6 MV) spans from a few keV up to 6 MeV. This range offers opportunities and challenges not found in diagnostic (kV) beams. For example, an optimized spectral separation across the clinically available energy range, requires a smaller, bounded range that could be determined by focusing on this specific imaging task. In clinical megavoltage imaging, a common task is identification of implanted gold fiducials for image-guided adaptive radiotherapy. Figure 1, demonstrates the subject contrast on top of the detector surface for a 6 MV x-ray beam that passes through 25 cm of soft-tissue, 5 cm of bone and 0.1 cm of gold fiducial thickness. The solid (-) and dashed (- -) lines correspond to subject contrast of bone and gold respectively. The dotted line (·) is their difference. There is an energy region between 0.06 MeV and 1 MeV where the contrast difference is maximized. This plot was generated using equations (1) to (7) and the geometry shown in figure 2.
Figure 1.
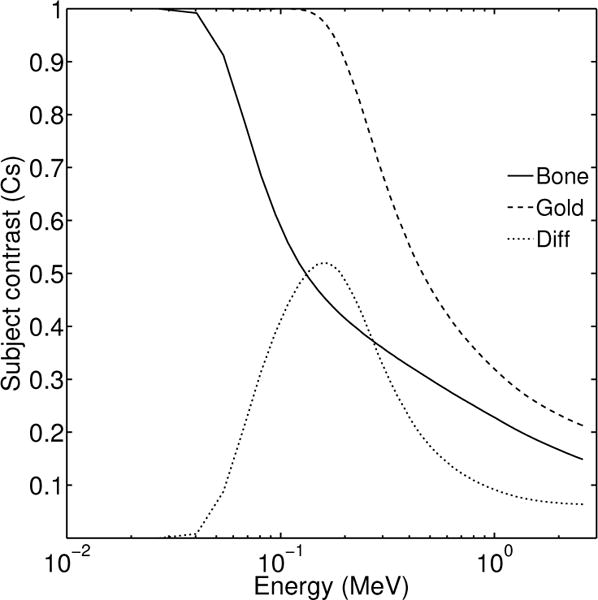
Subject contrast for bone (-) and gold (- -). The difference in subject contrast is also shown (·). The energy axis range is from 0.01 up to 3 MeV.
Figure 2.
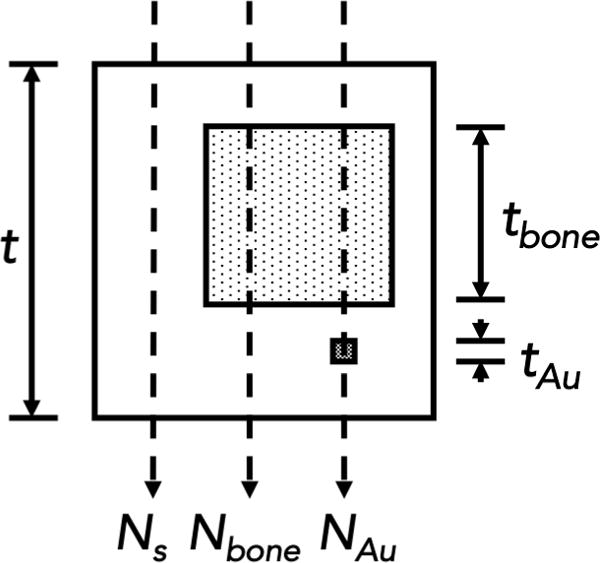
Imaging task of the current work. The x-rays pass through soft-tissue, bone and a gold fiducial located directly below the bone structure.
The scope of the current work was to develop a rapid analytical method for design optimization of a layered detector suitable for MVSPI based on a specific clinically-relevant imaging task: the separation of a gold fiducial from bone in a soft-tissue background. Our goals are to provide an energy range in which the available contrast between gold, bone and soft-tissue is maximized, and to suggest optimal combinations of materials and thicknesses that satisfy the requirements of MVSPI for maximized Contrast-to-Noise Ratio (CNR).
2. Methods
2.1. Imaging task
X-rays with specific energy, N0(E), pass through tissues and objects with different attenuation properties before detection. Assuming the simple structure shown in figure 2, the x-rays can interact with soft-tissue, soft-tissue and bone, and soft-tissue, bone and gold. This structure is a simplification of a common situation encountered in radiation therapy portal imaging with implanted gold fiducials for patient positioning and tumor tracking. Potential clinical applications include any situation where a fiducial is implanted nearby a bone structure. More likely, these include the pelvic area, thorax region and areas near the spinal cord. The number of x-rays exiting this structure and reaching the detector can be analytically approximated for each of the aforementioned cases using
| (1) |
| (2) |
| (3) |
where Ns(E), Nbone(E) and NAu(E) refer to the number of transmitted x-rays through soft-tissue, soft-tissue and bone and soft-tissue, bone and gold respectively.
The subject contrast for bone , gold and their difference (dCs) can be calculated using
| (4) |
| (5) |
| (6) |
Substitution of equations (1)–(3) in equation (6) gives
| (7) |
As there are two materials of interest, namely, bone and gold, a dual-layer detector design will be considered for material separation in this study. Since equation (7) is a function of energy, analytical determination of maxima and minima requires the expression of the attenuation coefficient with a continuous function for the energy range of interest. Alternatively, numerical estimation of equations 1–7 is possible. The specific dimensions of soft-tissue, bone and gold fiducial for this analysis were 25, 5 and 0.1 cm respectively. Alternative values could be easily substituted, if desired.
2.2. Detection
The energy-absorption characteristics of a detector depend on the material used and its thickness. In a two layer configuration (figure 3), each layer is expected to have a different energy-absorption spectrum with different mean absorption energy per detector layer. The top and bottom detector quantum efficiency ( and respectively) could be analytically approximated for each incident energy using the attenuation coefficients (μt and μb) of each layer
| (8) |
where dt and db were the thicknesses of the top and bottom scintillation components. In equation (8), the quantum efficiency is defined as the number of x-rays detected relative to the number of incident x-rays.
Figure 3.
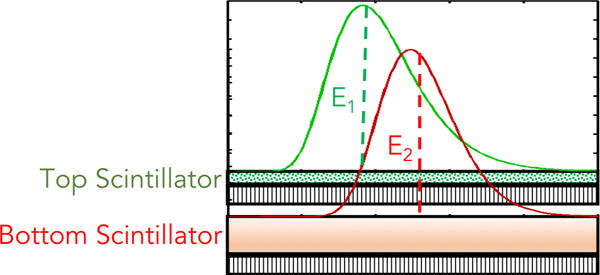
A typical, generic schematic of a two-layer MLI design with scintillator components that have different absorption characteristics.
Similarly, the energy efficiency, , can be calculated for each layer using mass energy-absorption coefficients (Hubbell, 1982; Seltzer, 1993; Boone and Chavez, 1996)
| (9) |
In principle, x-ray detection follows a binomial distribution, which for large numbers of x-rays is approximated by the normal distribution. The signal in integrating detectors is proportional to the absorbed energy per detected x-ray in the scintillation material and the number of detected x-rays. Assuming a large number of x-rays incident on the MLI, the signal I that corresponds to a specific tissue type (figure 1) and is generated from N x-rays of energy E can be estimated using , and N (i.e. Nb for bone and NAu for gold) as
| (10) |
and the associated noise will be
| (11) |
where σe is the detector electronic noise (the energy dependence notation was dropped for conciseness). This last term (σe) can be ignored if we assume a quantum limited detector. When the delivered dose per imaging frame is low (≪1 cGy), as in megavoltage cone-beam computed tomography (MVCBCT), σe may have to be taken into account and will depend on the design of the flat-panel array electronics.
2.3. Validation
Values of and were analytically calculated for the materials and thicknesses used in this work (table 1) using equations (8) and (9). The results were compared with and obtained from Monte Carlo simulations. Mono-energetic pencil beams from 30 keV up to 6.5 MeV were used to score energy depositions over an area equal to 1×1 cm2. For each material, a specific thickness was selected for the validation reference. Each pencil beam simulation initially generated and tracked 107 x-rays. The Monte Carlo tool used was the Geant4 Application for Tomographic Emission (GATE), which is suitable and well validated for imaging and radiotherapy applications (Jan et al., 2004; Jan et al., 2011; Grevillot et al., 2011; Sarrut et al., 2014).
Table 1.
Materials and corresponding thickness used for validation of the computation method described in this study.
| Material | Composition | Thickness (cm) | Density (g/cm3) |
|---|---|---|---|
| Cesium Iodide (CsI) | CsI | 0.1 | 4.51 |
| Gadolinium Oxysulfide (GOS) | Gd2O2S | 0.0290 | 4.58 |
| Bismuth Germanate (BGO) | Bi4Ge3O12 | 0.1 | 7.13 |
| Cadmium Tungstate (CWO) | CdWO4 | 0.1 | 7.9 |
| Copper (Cu) | Cu | 0.1 | 8.96 |
| Lead (Pb) | Pb | 0.1 | 11.34 |
| Tungsten (W) | W | 0.1 | 19.25 |
2.4. Weighted subtraction
Weighted subtraction is in principle a weighted division of intensities, i.e.
| (12) |
where Iw refers to the signal obtained after weighted subtraction of signals generated at the top (It) and bottom (Ib) layer of the MLI, and w is the weighting factor. Use of logarithmic expressions simplifies these calculations. Using equations (10) and (12)
| (13) |
It and Ib were estimated for each tissue of the imaging task investigated; i.e. , and The noise in the weighted image was calculated as
| (14) |
The weighting factor values used in this study ranged from 0 to 2 with step equal to 10−5.
2.5. CNR estimation
CNR was estimated using the calculated number of x-ray photons that pass through the different materials and are detected:.
| (15) |
where NAu refers to the number of x-rays in the weighted image that have passed through soft-tissue, bone and gold, NSoft are those that have passed through soft-tissue only, and NBone are those that have passed through soft-tissue and bone. The corresponding noise (σ) for each case is labeled similarly.
2.6. Weighted subtraction CNR estimation
Figure 4 demonstrates the CNR of bone (solid line) and gold (dashed line) after weighted subtraction, for weighting factor values ranging between 0 and 2. When CNRBone ≈ 0, the bone is not visible (i.e. bone removal). The CNRAu at the weighting factor value for which bone is removed, is shown in the inset of figure 4. This procedure was repeated for various scintillation and build-up materials to investigate the CNRAu after weighted subtraction. The overall goal is to maximize CNRAu when CNRBone equals zero.
Figure 4.
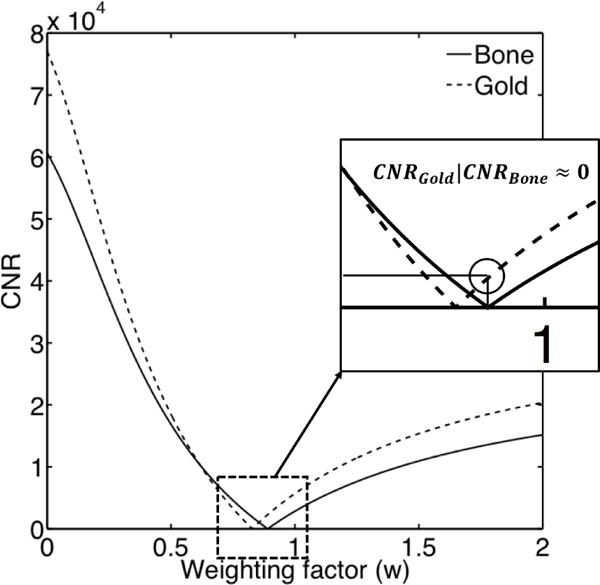
CNR after weighted subtraction of the first layer from the second layer for various w values. The solid line corresponds to CNR of bone and the dashed line to the CNR of the gold fiducial.
2.7. Simulated setup
The x-ray energies and fluence used in this work were determined from the 2.5 MV and 6 MV beam spectra provided by Varian (figure 5). The fluence for the 2.5 MV beam was 3.74 × 10⁷ x-rays/mm2/cGy at 100 cm distance from source for a Varian Truebeam linear accelerator. The 2.5 MV beam was specifically developed for MV imaging and was recently implemented in Truebeam and EDGE linear accelerators. The fluence for the 6 MV beam was 1.89×10⁷ x-rays/mm2/cGy at 100 cm distance from source. Three MLI design cases, using two layers of imagers, were assessed for the task of gold fiducial enhancement and simultaneous bone suppression. The logarithms of the intensities obtained at each MLI layer were weighted and subtracted, with the CNR of the gold fiducial calculated at the weighting factor for which the CNR of bone was zero. This procedure is described in previous sections (2.4–2.6).
Figure 5.
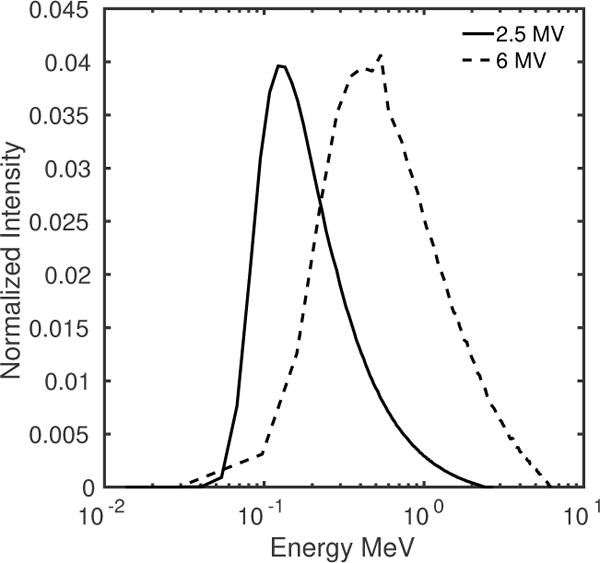
Varian Truebeam 2.5 MV (solid line) and 6 MV (dashed line) beam spectra used in this work.
2.7.1. Modification of the build-up components
Currently, copper is used most commonly as the build-up material in commercial MV EPIDs. In order to create a large difference in spectrum between layers, we simulated different build up materials between the top and bottom layers. Successive computations of CNRAu were performed using copper, tungsten and lead as the bottom layer build-up material with a thickness between 0.1 and 1.0 cm. The phosphor in the bottom layer was GOS with thickness equal to 0.0290 cm. The top layer had a 0.1 cm copper build up layer and a 0.029 cm GOS phosphor layer, the actual component materials and thicknesses found in the Varian as1200 EPID.
2.7.2. Modification of the scintillator components
The GOS phosphor in one of the two layers was replaced in turn by Bismuth Germanate (BGO), Cesium Iodide (CsI) and Cadmium Tungstate (CdWO4 or CWO). The thickness of the new material was linearly varied between 0.1 and 1 cm. CNRAu was calculated for a two layer design with the GOS phosphor in the top layer (i.e. Cu-GOS/CsI, Cu-GOS/BGO and Cu-GOS/CWO) or in the bottom layer (i.e. CsI/Cu-GOS, BGO/Cu-GOS, CWO/Cu-GOS). The Cu build-up thickness was 0.1 cm and the GOS thickness was 0.0290 cm, for every case.
The CNRAu was calculated after weighted subtraction of the intensities obtained in the top and bottom imager layers. The materials investigated were GOS (baseline), Bismuth Germanate (BGO), Cesium Iodide (CsI) and Cadmium Tungstate (CdWO4 or CWO). Six combinations of these materials were investigated. In each combination above, the material thicknesses were varied from 0.1 to 1 cm. The absorbed energy spectra are modified by the scintillator parameters, changing the quantum and energy efficiencies of each layer. CsI and BGO have been previously studied, as individual detectors, in MV imaging (Wang et al., 2009) as well as in kV (mainly CsI) (Zhao et al., 2004) with good performance across thicknesses ranging from 150 μm to 4 cm. CWO was also studied for MV (Star-Lack et al., 2015) and kV imaging (Kwak et al., 2005) within a range of thicknesses up to 3 cm.
3. Results
3.1. Validation of the analytical method
The comparison between analytically and computationally obtained values of and is displayed in figures 6 and 7, respectively. There was very good agreement between analytical and simulated quantum efficiency, , (figure 6) and energy efficiency, , values (figure 7). The greatest discrepancies were observed near absorption edges.
Figure 6.
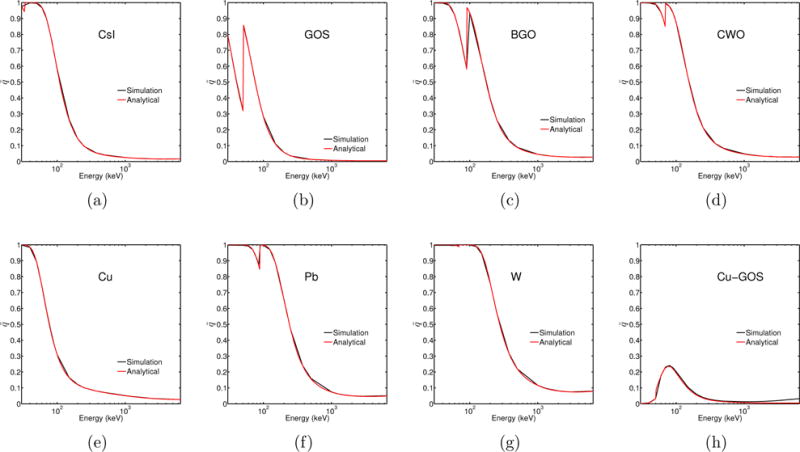
Quantum efficiency of materials used in this work, obtained from analytical calculations (red) and Monte Carlo simulations (black).
Figure 7.
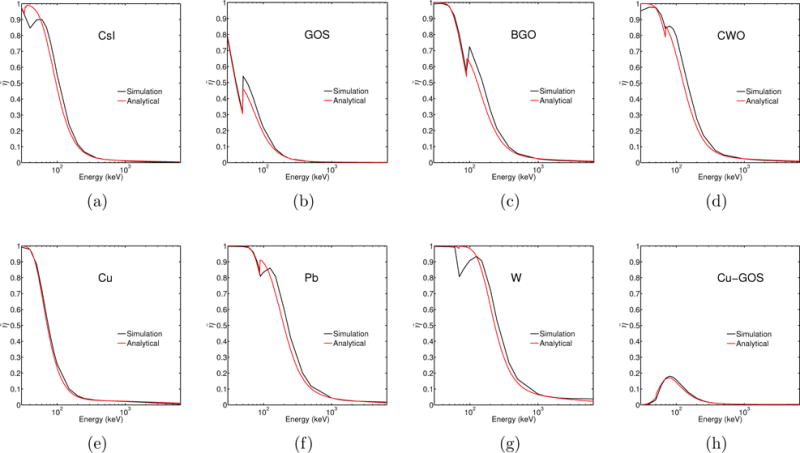
Energy efficiency of materials used in this work, obtained from analytical calculations (red) and Monte Carlo simulations (black).
3.2. Modification of the build-up components
In figure 8, the CNRAu for the first design case is shown. Build-up modification in the bottom layer of the MLI produced approximately 5 times higher CNRAu when copper was replaced by tungsten or lead.
Figure 8.
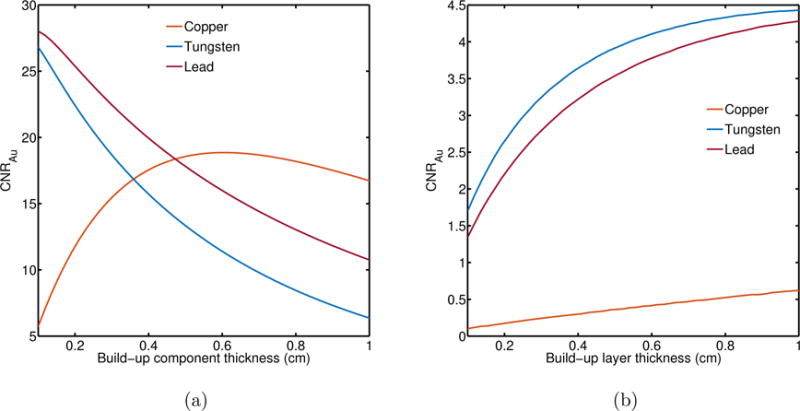
CNRAu for different build-up materials and thicknesses in the bottom layer of a two-layer MLI. Both layers employ GOS phosphor (0.029 cm). (a) 2.5 MV beam and (b) 6 MV beam
3.3. Modification of the scintillator components
The results for a two layer imager with different scintillating material in either the top or bottom layer are shown in figures 9a and 9b for 2.5 MV and figures 9c and 9d for the 6 MV beam. The red straight line indicates the baseline of CNRAu for two layers with Cu-GOS at the reference thicknesses (0.1 cm and 0.029 cm, respectively) using the 2.5 MV beam. There was a decreasing trend in CNRAu when the top layer Cu-GOS was replaced by a different scintillating material. At higher thicknesses, CNRAu becomes lower than the CNRAu obtained using the Cu-GOS combination for the top layer. Similar trend is observed when the 6 MV beam is used (figure 9c). When a different scintillation material is used for the bottom layer, there is generally an increase in CNRAu in relation with that obtained using Cu-GOS for both 2.5 MV and 6 MV. BGO was an exception at 0.1 cm thickness and 6 MV beam.
Figure 9.
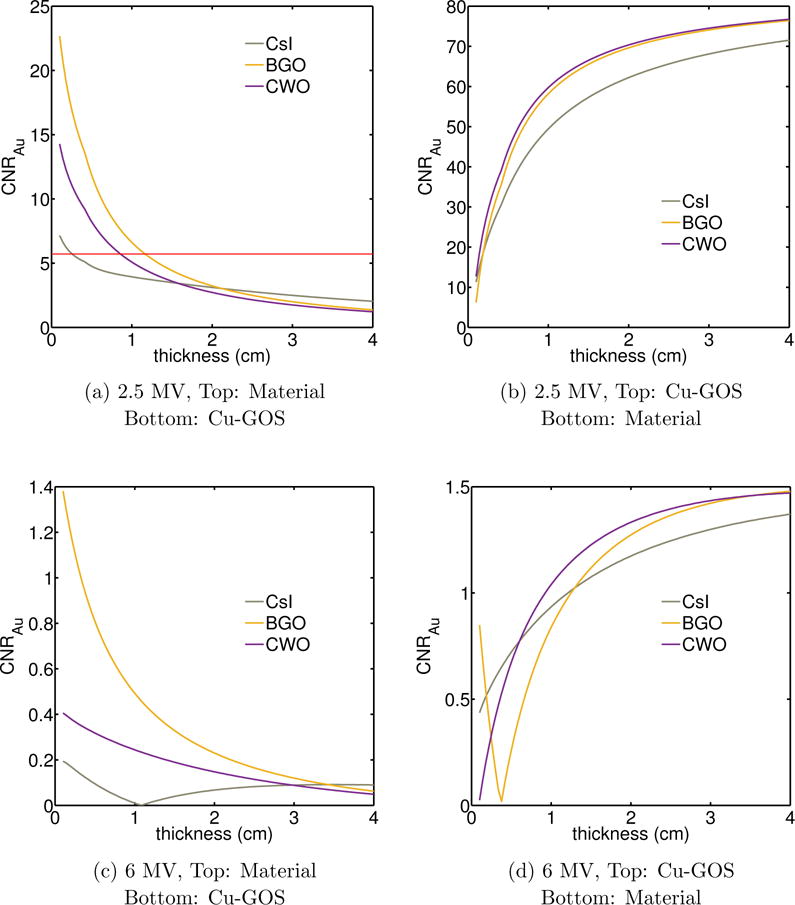
(a) CNRAu for different materials and thicknesses used for the top detector layer. The bottom layer was a copper/GOS combination. (b) The same materials used as the bottom layer. The top layer was a copper/GOS combination. The red, solid line in figure 9a indicates the CNRAu when both layers are composed of Cu-GOS combination with 0.1 and 0.029 cm thickness respectively. The beam energy for (a) and (b) was 2.5 MV. (c) and (d) similar plots as (a) and (b) for 6 MV beam.
4. Discussion
Megavoltage spectral imaging is a novel approach for image acquisition in radiation therapy. As such, EPID optimization for MVSPI is an open area for investigation. The analytical calculation method described in this work enables rapid investigation of (a) the energy range suitable for a specific imaging task and (b) the performance change based on modifications of the imager design.
Validation of the analytical method by comparison of quantum and energy efficiency values obtained from Monte Carlo simulations demonstrated good agreement for the materials considered in this study (figure 6 and 7). Discrepancies observed near absorption edges and at higher energies had minor impact for the energy ranges of interest in this work.
As shown in figure 4, the key performance parameter considered in subsequent calculations was the visibility of a gold fiducial, quantified with CNRAu, at the weighting factor value where the bone signal was suppressed (CNRBone ≈ 0). This separation is accomplished by beam hardening between layers of the imager and the absorption characteristics of each scintillation material (Myronakis et al., 2017).
Modification of the build-up component in the bottom layer of a two-layer GOS-based MLI (figure 8), demonstrated a sharp increase in CNRAu using the 2.5 MV beam (figure 8a). This was particularly evident for lead and tungsten build-up materials because of increased beam hardening. At larger build-up thickness, self-absorption decreased the available signal for the bottom detector and CNR deteriorated. Copper had a markedly different behavior mainly due to the lower density and atomic number compared to lead and tungsten. As the copper thickness increased, beam hardening increased and CNRAu increased. After a certain thickness, approximately 0.6 cm, CNRAu began to decrease due to build-up self-absorption and beam hardening effects. For the 6 MV beam (figure 8b), there was an increasing trend in all build-up materials although the CNRAu was below or at the threshold of detectability, according to the Rose criterion. Rose suggested a signal detectability limit, suitable for human perception, between 3 and 5 (Rose, 1948).
Replacement of the GOS phosphor with another scintillation material in the top layer (figure 9a) yielded generally higher CNRAu at 0.1 cm thickness. Increased thickness of scintillation material in the top layer was associated with a decrease in CNRAu due to increased absorption and reduced available signal at the bottom layer of Cu-GOS combination. This trend was observed at both beam energies (figures 9a and 9c). Replacement of the GOS phosphor at the bottom layer, produced generally higher CNRAu for both beam energies (figure 9b and 9d). There was a sharp drop for BGO around 0.34 cm thickness. Due to higher absorption in BGO, the signal ratio between bone and gold was higher than for a top layer of Cu-GOS, up to a thickness of around 0.4 cm. The result was an abrupt drop in CNRAu as the signal ratio became gradually smaller than the top one, with higher BGO thickness. In general, as BGO thickness (and absorption) increased, the signal ratio of bone and gold became closer to unity (i.e. similar). However, at 6 MV, the CNRAu was generally much lower than the detectability threshold regardless of the modified layer. The red solid line shown in figure 9a, indicates the CNRAu when both layers are composed of Cu-GOS combination with 0.1 and 0.029 cm thickness respectively. Its sole purpose is to provide a threshold, below which there is not any advantage in using a combination other than Cu-GOS for both layers. In figures 9b, 9c and 9d, the CNRAu is either much higher or lower than this threshold, hence the line is not depicted.
The results obtained when the thickness and scintillation material of both top and bottom layers were allowed to vary are presented in figure 10. The use of large scintillation material thickness in the top layer is detrimental to CNRAu and subsequently to the spectral imaging technique. This is due to photon attenuation, where little signal is left for the bottom layer.
Figure 10.
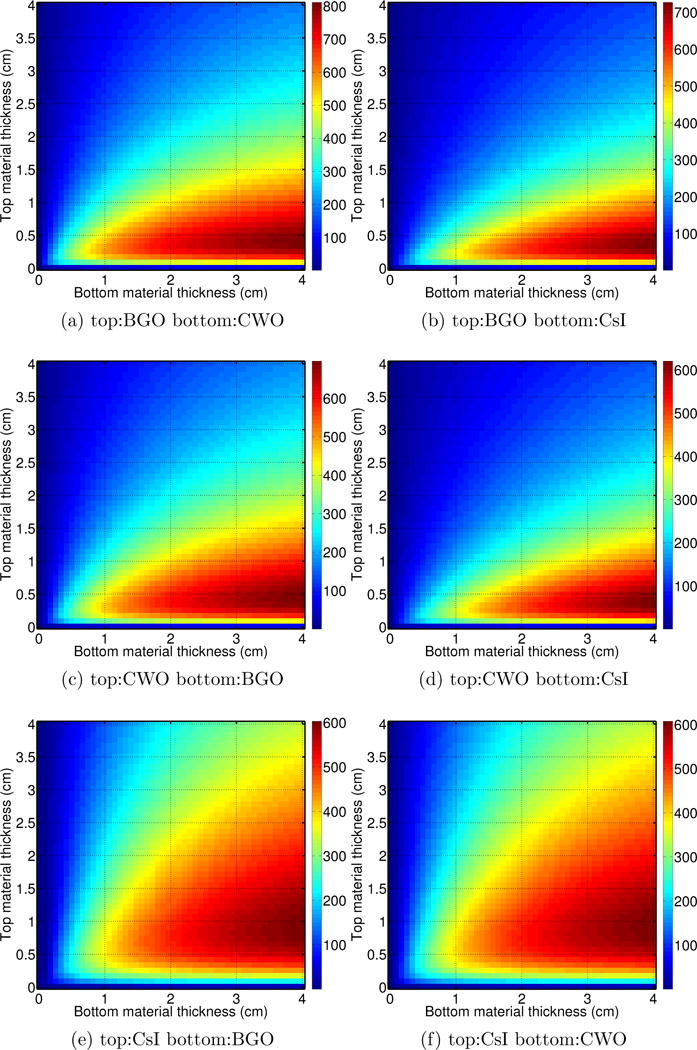
CNRAu for a two layer imager with various combinations of top and bottom scintillator materials and thicknesses. 2.5 MV beam.
The higher the signal difference between top and bottom layers the better the imaging performance using MVSPI. In all material combinations investigated, a top layer with a scintillation material thickness around 0.5 cm and a bottom layer with material thickness larger than 2 cm produced the highest CNRAu.
GOS is commonly used for MV imaging (Antonuk, 2002). Due to the relatively low cost of sourcing this material, the most cost effective way to improve MVSPI is to use two GOS layers with a different build-up layer between them. We calculated that modifications of this component could improve CNRAu by a factor 5 for a 2.5 MV beam and a factor of 8 for a 6 MV beam.
There are some physical parameters which are not included in the analytical method. Although optical transport was not modeled, previous studies have shown that optical transport has small impact on the performance of BGO, CWO and CsI within the thickness range investigated in this work (Zhao et al., 2004; Kwak et al., 2005; Wang et al., 2009; Star-Lack et al., 2015). The impact of patient scatter on imager signal and subsequently on CNRAu was not considered. However, for the same imaged patient, the distribution of patient scattered x-rays is expected to be similar, irrespective of the material used. In general, the relative performance between the MLI design employing different materials would not be largely affected and the findings of the current study would remain valid.
5. Conclusion
Improved multi-layer imager design for MV spectral imaging was shown to increase the CNR of gold fiducials while simultaneously suppressing the signal from bone. Specific improvements regarding the build-up component of each layer, the scintillation materials and thicknesses were suggested. The implementation of low cost modifications, such as the change in the build-up component is particularly attractive for immediate realization of an MLI design capable for MVSPI in a clinical setting.
Acknowledgments
The project described was supported, in part by a grant from Varian Medical Systems, Inc. and by Award Number R01CA188446 from the National Cancer Institute. The content is solely the responsibility of the authors and does not necessarily represent the views of the National Cancer Institute or the National Institutes of Health.
Footnotes
Submitted to: Phys. Med. Biol.
References
- Alvarez RE, Macovski A. Energy-selective reconstructions in X-ray computerized tomography. Physics in medicine and biology. 1976;21(5):733–44. doi: 10.1088/0031-9155/21/5/002. URL: http://www.ncbi.nlm.nih.gov/pubmed/967922. [DOI] [PubMed] [Google Scholar]
- Antonuk LE. Electronic portal imaging devices: a review and historical perspective of contemporary technologies and research. Physics in medicine and biology. 2002;47(6):R31–65. URL: http://www.ncbi.nlm.nih.gov/pubmed/11936185. [PubMed] [Google Scholar]
- Boone JM, Chavez AE. Comparison of x-ray cross sections for diagnostic and therapeutic medical physics. Medical Physics. 1996;23(12):1997–2005. doi: 10.1118/1.597899. URL: http://doi.wiley.com/10.1118/1.597899. [DOI] [PubMed] [Google Scholar]
- Brody WR, Butt G, Hall A, Macovski A. A method for selective tissue and bone visualization using dual energy scanned projection radiography. Medical Physics. 1981;8(3):353–357. doi: 10.1118/1.594957. URL: http://doi.wiley.com/10.1118/1.594957. [DOI] [PubMed] [Google Scholar]
- Brooks RA, Di Chiro G. Split-detector computed tomography: a preliminary report. Radiology. 1978;126(1):255–7. doi: 10.1148/126.1.255. URL: http://pubs.rsna.org/doi/10.1148/126.1.255. [DOI] [PubMed] [Google Scholar]
- Cardinal HN, Fenster A. An accurate method for direct dual-energy calibration and decomposition. Medical Physics. 1990;17(3):327–341. doi: 10.1118/1.596512. URL: http://doi.wiley.com/10.1118/1.596512. [DOI] [PubMed] [Google Scholar]
- Grevillot L, Frisson T, Maneval D, Zahra N, Badel JN, Sarrut D. Simulation of a 6 MV Elekta Precise Linac photon beam using GATE/GEANT4. Physics in medicine and biology. 2011;56(4):903–918. doi: 10.1088/0031-9155/56/4/002. [DOI] [PubMed] [Google Scholar]
- Hoggarth MA, Luce J, Syeda F, Bray TS, Block A, Nagda S, Roeske JC. Dual energy imaging using a clinical on-board imaging system. Physics in Medicine and Biology. 2013;58(12):4331–4340. doi: 10.1088/0031-9155/58/12/4331. URL: http://stacks.iop.org/0031-9155/58/i=12/a=4331?key=crossref.c3b7968cbf02f8d3c46e377471201e69. [DOI] [PubMed] [Google Scholar]
- Hubbell JH. Photon mass attenuation and energy-absorption coefficients. The International Journal Of Applied Radiation And Isotopes. 1982;33(11):1269–1290. [Google Scholar]
- Jan S, Benoit D, Becheva E, Carlier T, Cassol F, Descourt P, Frisson T, Grevillot L, Guigues L, Maigne L, Morel C, Perrot Y, Rehfeld N, Sarrut D, Schaart DR, Stute S, Pietrzyk U, Visvikis D, Zahra N, Buvat I. GATE V6: a major enhancement of the GATE simulation platform enabling modelling of CT and radiotherapy. Physics in medicine and biology. 2011;56(4):881–901. doi: 10.1088/0031-9155/56/4/001. URL: http://www.ncbi.nlm.nih.gov/pubmed/21248393. [DOI] [PubMed] [Google Scholar]
- Jan S, Santin G, Strul D, Staelens S, Assié K, Autret D, Avner S, Barbier R, Bardiès M, Bloomfield PM, Brasse D, Breton V, Bruyndonckx P, Buvat I, Chatziioannou AF, Choi Y, Chung YH, Comtat C, Donnarieix D, Ferrer L, Glick SJ, Groiselle CJ, Guez D, Honore PF, Kerhoas-Cavata S, Kirov AS, Kohli V, Koole M, Krieguer M, van der Laan DJ, Lamare F, Largeron G, Lartizien C, Lazaro D, Maas MC, Maigne L, Mayet F, Melot F, Merheb C, Pennacchio E, Perez J, Pietrzyk U, Rannou FR, Rey M, Schaart DR, Schmidtlein CR, Simon L, Song TY, Vieira JM, Visvikis D, de Walle RV, Wieërs E, Morel C. GATE: a simulation toolkit for PET and SPECT. Physics in Medicine and Biology. 2004;49(19):4543–4561. doi: 10.1088/0031-9155/49/19/007. URL: http://stacks.iop.org/0031-9155/49/i=19/a=007?key=crossref.be1d0bbaf1d502515584e510c77393cb. [DOI] [PMC free article] [PubMed] [Google Scholar]
- Kalender WA, Perman WH, Vetter JR, Klotz E. Evaluation of a prototype dual-energy computed tomographic apparatus. I Phantom studies. Medical Physics. 1986;13(3):334–339. doi: 10.1118/1.595958. URL: http://doi.wiley.com/10.1118/1.595958. [DOI] [PubMed] [Google Scholar]
- Kwak SW, Cho G, Kim BH, Kim I, Sung Jae M. Comparative study of CWO and ZnSe(Te) scintillation detector on the performance of X-ray imaging system. Nuclear Instruments and Methods in Physics Research Section A: Accelerators, Spectrometers, Detectors and Associated Equipment. 2005;537(1–2):449–453. URL: http://linkinghub.elsevier.com/retrieve/pii/S0168900204018716. [Google Scholar]
- Myronakis ME, Fueglistaller R, Rottmann J, Hu YH, Wang A, Baturin P, Huber P, Morf D, Star-Lack JM, Berbeco RI. Spectral imaging using clinical megavoltage beams and a novel multi-layer imager. Physics in Medicine and Biology. 2017;62(23):9127–9139. doi: 10.1088/1361-6560/aa94f9. URL: http://iopscience.iop.org/article/10.1088/1361-6560/aa94f9. [DOI] [PMC free article] [PubMed] [Google Scholar]
- Patel R, Panfil J, Campana M, Block AM, Harkenrider MM, Surucu M, Roeske JC. Markerless motion tracking of lung tumors using dual-energy fluoroscopy. Medical Physics. 2014;42(1):254–262. doi: 10.1118/1.4903892. URL: http://doi.wiley.com/10.1118/1.4903892. [DOI] [PubMed] [Google Scholar]
- Rose A. The sensitivity performance of the human eye on an absolute scale. J Opt Soc Am. 1948;38(2):196–208. doi: 10.1364/josa.38.000196. URL: http://www.osapublishing.org/abstract.cfm?URI=josa-38-2-196. [DOI] [PubMed] [Google Scholar]
- Rottmann J, Morf D, Fueglistaller R, Zentai G, Star-Lack J, Berbeco R. A novel EPID design for enhanced contrast and detective quantum efficiency. Physics in Medicine and Biology. 2016;61(17):6297–6306. doi: 10.1088/0031-9155/61/17/6297. URL: http://stacks.iop.org/0031-9155/61/i=17/a=6297?key=crossref.192d768d2569fdc9cf57ae41e001a619. [DOI] [PMC free article] [PubMed] [Google Scholar]
- Sarrut D, Bardiès M, Boussion N, Freud N, Jan S, Létang JM, Loudos G, Maigne L, Marcatili S, Mauxion T, Papadimitroulas P, Perrot Y, Pietrzyk U, Robert C, Schaart DR, Visvikis D, Buvat I. A review of the use and potential of the GATE Monte Carlo simulation code for radiation therapy and dosimetry applications. Medical Physics. 2014;41(6):064301. doi: 10.1118/1.4871617. URL: http://scitation.aip.org/content/aapm/journal/medphys/41/6/10.1118/1.4871617. [DOI] [PubMed] [Google Scholar]
- Seltzer S. Calculation of Photon Mass Energy-Transfer and Mass Energy-Absorption Coefficients. Radiation Research. 1993;136(2):147–170. [PubMed] [Google Scholar]
- Shkumat NA, Siewerdsen JH, Richard S, Paul NS, Yorkston J, Van Metter R. Dual-energy imaging of the chest: optimization of image acquisition techniques for the ’bone-only’ image. Medical physics. 2008;35(2):629–632. doi: 10.1118/1.2828186. [DOI] [PubMed] [Google Scholar]
- Star-Lack J, Shedlock D, Swahn D, Humber D, Wang A, Hirsh H, Zentai G, Sawkey D, Kruger I, Sun M, Abel E, Virshup G, Shin M, Fahrig R. A piecewise-focused high DQE detector for MV imaging. Medical physics. 2015;42(9):5084–99. doi: 10.1118/1.4927786. URL: http://scitation.aip.org/content/aapm/journal/medphys/42/9/10.1118/1.4927786. [DOI] [PMC free article] [PubMed] [Google Scholar]
- Wang Y, Antonuk LE, El-Mohri Y, Zhao Q. A Monte Carlo investigation of Swank noise for thick, segmented, crystalline scintillators for radiotherapy imaging. Medical physics. 2009;36(7):3227–3238. doi: 10.1118/1.3125821. [DOI] [PMC free article] [PubMed] [Google Scholar]
- Zhao W, Ristic G, Rowlands JA. X-ray imaging performance of structured cesium iodide scintillators. Medical Physics. 2004;31(9):2594–2605. doi: 10.1118/1.1782676. URL: http://doi.wiley.com/10.1118/1.1782676. [DOI] [PubMed] [Google Scholar]


