Abstract
Background
There is evidence that glaucoma is a neurodegenerative disease involving the whole visual pathway. We prospectively examined potential benefits of volumetry of the lateral geniculate nucleus (LGN) and diffusion tensor imaging (DTI) using a new 7T scanner.
Methods
20 patients with normal tension glaucoma and 16 control individuals were examined. LGN volume and fractional anisotropy (FA) of the optic tract (OT) and the optic radiation (OR) and their correlation with RNFL (retinal nerve fiber layer) thickness were analyzed.
Results
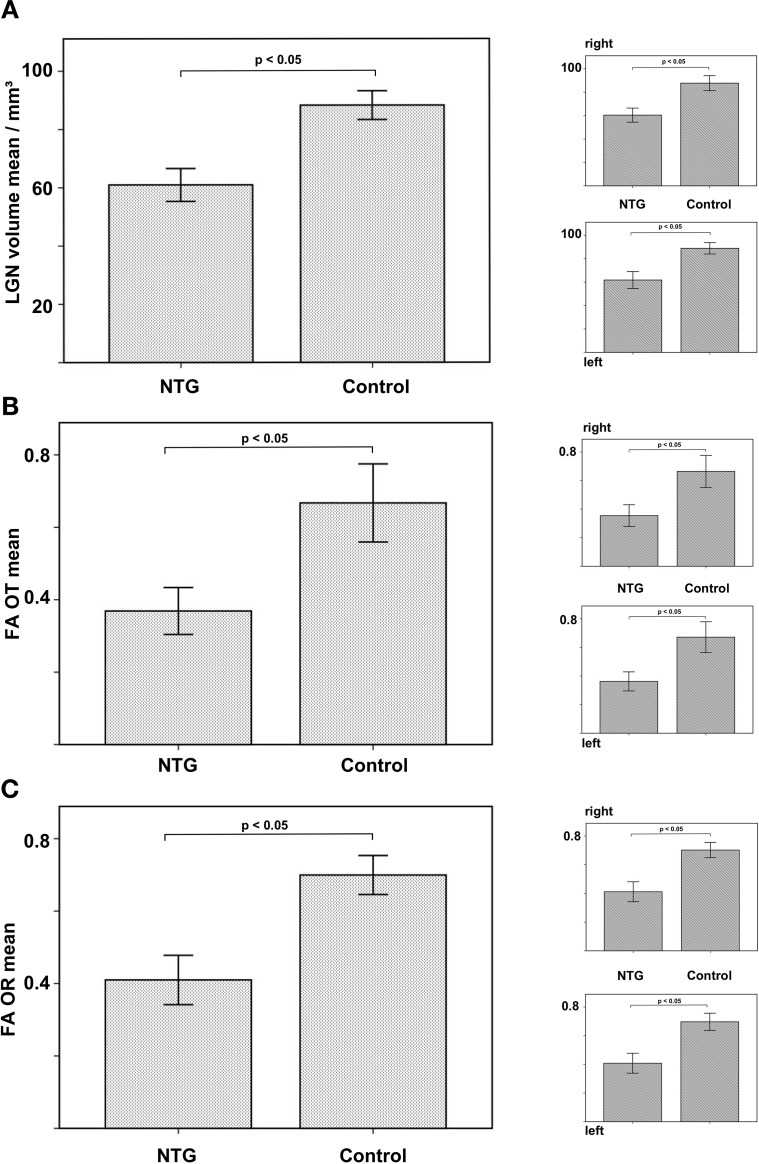
LGN volume was significantly reduced in NTG (60.9 vs 88.3; p < 0.05). FA of the OT (right: 0.35 vs 0.66, left: 0.36 vs 0.67; p < 0.05) and of the OR (right: 0.41 vs 0.70, left: 0.41 vs 0.69; p < 0.05) was also significantly reduced. Nasal RNFL thickness correlated with the volume of the contralateral LGN (r = 0.471, p = 0.05). Temporal RNFL thickness correlated with the volume of the ipsilateral LGN (r = 0.603, p = 0.015).
Conclusion
NTG leads to significant atrophy of the LGN compared to controls. FA of the optic tract and the optic radiation is reduced in NTG as sign of axonal degeneration. RNFL thickness but not FA correlates with LGN volume.
Introduction
Magnetic resonance imaging has been used to analyze the visual pathway in glaucoma; including morphological examinations [1, 2] as well as functional measurements by means of diffusion tensor imaging (DTI) [3, 4]. Thereby, glaucoma is more and more classified as a neurodegenerative disease [5] and previous histopathological examinations demonstrated degenerative tissue changes of the intracranial optic nerve, the lateral geniculate nucleus (LGN) as well as the optic cortex [6] and even in structures outside the visual pathway such as the amygdala [7] in primary open-angle glaucoma. These degenerative processes can also be found in vivo by MRI/DTI as atrophy of the LGN [8, 9] as well as reduced fractional anisotropy (FA) of the optic nerve [10, 11] have been found. Regarding volumetry of the LGN, even ultra high-field (UHF) MRI data have been analyzed and revealed atrophy of the LGN in primary open-angle glaucoma (POAG) [12, 13]. The potential benefit of a higher field strength is a higher signal to noise ratio (SNR), which can be used to increase the spatial resolution [14] resulting in a higher accuracy in delineating such small structures as the LGN. Examinations of LGN atrophy in glaucoma were focused on POAG as the most common etiology in the past. The idea of glaucoma being always related to an elevated intraocular pressure (IOP) with the mechanistic explanation of pressure induced damage of the optic nerve is widespread, however, up to 40% of glaucoma patients in Caucasian populations present with an IOP within the physiological range (≤ 21 mmHg). This subtype of normal tension glaucoma (NTG) shows the same peripapillary retinal nerve fiber layer (RNFL) thinning and subsequent visual field defects as the high pressure glaucoma phenotype [15].
The pathophysiological essentials of NTG are not well understood. Neurodegeneration beyond the visual pathway has been shown in NTG [16], but further investigation, e.g. correlation with ophthalmological measures of disease severity, is necessary. This is especially important because the most noticeable feature of glaucomatous optic neuropathy, the elevated IOP is absent in NTG, making the disease difficult to diagnose.
Aim of our study was to assess the integrity of the optic tract and the optic radiation by selective tractography based on high resolution DTI and to evaluate LGN atrophy in NTG using 7T UHF-MRI to investigate the potential to complement ophthalmological diagnosis of NTG.
Material and methods
Subjects
We included 20 patients with a history of binocular NTG (mean age +/- SD = 55y +/- 8.7) who were recruited through the Department of Ophthalmology of the University Hospital Erlangen-Nuremberg. All patients underwent full ophthalmological examination including perimetry and measurement of RNFL.
Intraocular pressure was < 21 mmHg in all patients. Patients with severe neurological conditions such as (minor and major) stroke or postischemic defects, inflammatory CNS diseases and intracranial masses were excluded. The control group comprised 16 healthy volunteers (mean age +/- SD = 47y +/- 9.5) without any signs of glaucoma. The Clinical Investigation Ethics Committee of the University of Erlangen-Nuremberg approved the protocol of this prospective study and the research was conducted in accordance with the Declaration of Helsinki. All participants gave written informed consent prior to all measurements.
RNFL measurements
Current RNFL data (not older than 6 months regarding the date of image acquisition) was available for 13 of the 20 NTG patients.
We used spectral domain optical coherence tomography (SD-OCT; Spectralis OCT, Heidelberg Engineering GmbH, Heidelberg, Germany). For SD-OCT, simultaneous measurements of multiple wavelengths of reflected light across a spectrum are used to produce detailed, cross-sectional 3D images of the retina. An automatic positioning system creates an anatomical map of every patient based on the position of the fovea and the center of optic nerve head. The neuroretinal rim area is measured in 6 sectors (temporal superior, nasal superior, nasal, nasal inferior, temporal inferior and temporal) as well as globally. RNFL thickness is measured as the difference between the inner margin of the ILM (internal limiting membrane) and the outer margin of the RNFL and the obtained values are automatically compared to a normative database [17, 18].
Imaging protocol
We used a 7T ultra high-field scanner (Magnetom Terra, Siemens Healthineers, Erlangen, Germany) with a gradient field strength of up to 80 mT/m with a slewrate of 200 T/m/s. For signal reception, a 32-channel receive array head coil (Nova Medical, Wilmington, MA, USA) was used.
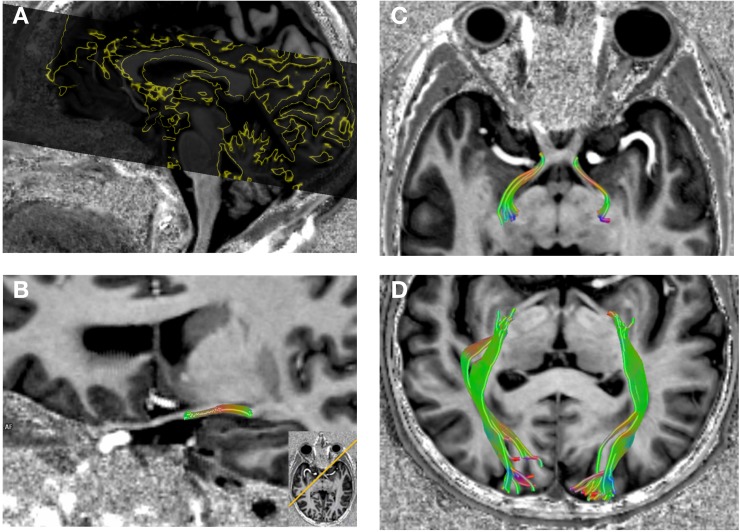
Axial high resolution DTI was performed with 1.3 mm isotropic resolution using a readout-segmented echo planar imaging sequence [19] (TR = 7700 ms, TE = 57 ms, echo-spacing = 0.36 ms, 5 segments, FoV = 220 x 220 mm2) resulting in a slab of 66.3 mm with 51 contiguous slices covering the whole visual pathway (Fig 1). Diffusion weighting was carried out with a maximal b-value of 1000 s/mm2 along 20 directions complemented by one scan with a b-value of zero. Manually adjusted B0-shimming was optimized to reduce distortion artifacts, especially regarding the suprasellar cistern.
Fig 1.
DTI coverage of the visual pathway (A). Reconstruction of the DTI dataset as selective tractography of the optic tract (B and C) and the optic radiation (D) in NTG.
Anatomical information was obtained through a high-resolution 3D MP2RAGE (Magnetization Prepared 2 Rapid Acquisition Gradient Echoes) [20] which improves the gray/white matter contrast (0.8 mm isotropic resolution, TR = 4530 ms, TE = 1.92 ms, TI1 = 700 ms, TI2 = 2700 ms, FoV = 226 x 240 mm2).
For comparison, all patients received a 3D MPRAGE (Magnetization Prepared Rapid Acquisition Gradient Echo) with a clinical 3T scanner (Magnetom Trio, Siemens Healthineers, Erlangen, Germany). Sequence parameters were as follows: slice thickness = 0.8 mm, TR = 2400 ms, TE = 3.59 ms, TI = 900 ms, FoV = 256 x 256 mm2.
Image analysis and statistics
LGN was identified on coronal slices on the MP2RAGE in thin slice data above the hippocampus and the temporal horn of the lateral ventricle, beneath and lateral to the thalamus, and medial to the optic radiation as previously described [12, 21, 22]. LGN volumes were measured manually by circling its cross-sectional area by hand on every slice it was visible (3 to 5 slices) by using a commercially available software plug-in (Neuro 3D, syngo.via, Siemens Healthineers, Erlangen, Germany). The measured areas of the LGN in each slice were then summed up and multiplied with the slice thickness to derive the volume in mm3. Measurements were obtained by a neuroradiologist and performed twice, average values of both measurements were used for statistical analysis.
Selective deterministic tractography followed by region-of-interest analysis was performed to obtain FA values for the optic tract and the optic radiation. We chose to examine the optic tracts and not the optic nerves to avoid susceptibility artifacts of the anterior clinoid processes impairing the tractography results. For that, the DTI dataset was fused with the high resolution MP2RAGE for anatomical information and manual seed regions of interest (ROIs) were set as following: 1. for the optic tract immediate behind the optic chiasm to the LGN for each side separately 2. for the optic radiation from the LGN to the optic cortex for both sides, respectively (Fig 1).
Normal distribution of the variables was assessed by a Kolmogorov-Smirnov test.
Unpaired Student’s t-tests were performed to describe differences in LGN volume, FA of the optic tract and optic radiation as well as RNFL thickness.
Pearson product-moment correlation coefficient was used for correlation analysis between LGN volumes, FA of the optic tract and optic radiation and RNFL thickness in NTG (without correction for multiple comparisons). P values ≤ 0.05 were considered statistically significant. All statistical analyses were performed using SPSS version 19.0 (SPSS, Inc., Chicago, IL, USA).
Results
RNFL (retinal nerve fiber layer) thickness was significantly reduced bilaterally in 12 patients compared to an age-matched normative database provided through the device software by the manufacturer (Spectarils OCT, see above). In one patient reduced RNFL was limited to the right eye. RNFL measurements are summarized in Table 1.
Table 1. RNFL thickness and LGN volumes of NTG patients.
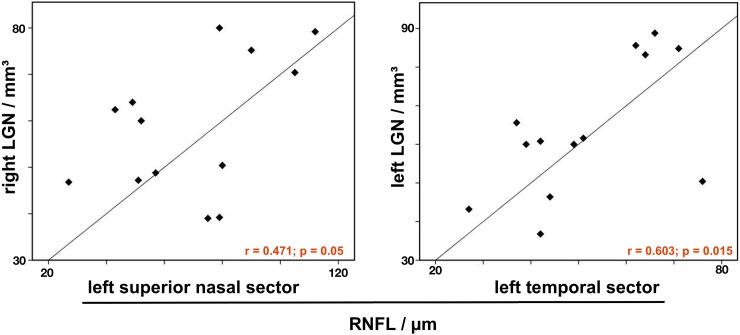
Significant correlation of the nasal sector RNFL thickness (crossing axons of the ganglion cells in the optic chiasm) with the volume of the contralateral LGN. In contrast, the temporal sector RNFL thickness (non-crossing axons of the ganglion cells in the optic chiasm) correlates with the volume of the ipsilateral LGN.
| RNFL thickness, μm, right eye | LGN volume / mm3 | ST* | T* | IT | IN | N | SN* |
| patient no | |||||||
| 1 | 70.4 | 95 | 34 | 50 | 86 | 55 | 107 |
| 2 | 80 | 119 | 74 | 145 | 53 | 27 | 66 |
| 3 | 46.8 | 81 | 58 | 106 | 69 | 66 | 50 |
| 4 | 60 | 59 | 127 | 62 | 11 | 38 | 74 |
| 5 | 79.2 | 68 | 51 | 31 | 55 | 59 | 92 |
| 6 | 75.2 | 75 | 36 | 47 | 32 | 39 | 62 |
| 7 | 62.4 | 99 | 54 | 97 | 83 | 49 | 95 |
| 8 | 39.2 | 115 | 74 | 87 | 50 | 26 | 55 |
| 9 | 39 | 98 | 51 | 80 | 69 | 57 | 88 |
| 10 | 50.4 | 61 | 35 | 99 | 69 | 62 | 57 |
| 11 | 47.2 | 37 | 30 | 29 | 56 | 42 | 46 |
| 12 | 64 | 80 | 88 | 70 | 52 | 54 | 60 |
| 13 | 48.8 | 56 | 30 | 91 | 98 | 64 | 72 |
| RNFL thickness, μm, left eye | ST* | T* | IT | IN | N | SN* | |
| patient no | |||||||
| 1 | 83.2 | 104 | 64 | 128 | 96 | 56 | 105 |
| 2 | 88.8 | 125 | 66 | 80 | 117 | 50 | 79 |
| 3 | 85.6 | 88 | 62 | 138 | 84 | 66 | 27 |
| 4 | 60 | 46 | 49 | 63 | 67 | 51 | 52 |
| 5 | 84.8 | 90 | 71 | 68 | 54 | 56 | 112 |
| 6 | 65.6 | 85 | 37 | 43 | 48 | 49 | 90 |
| 7 | 36.8 | 55 | 42 | 107 | 55 | 38 | 43 |
| 8 | 50.4 | 122 | 76 | 107 | 62 | 34 | 79 |
| 9 | 46.4 | 84 | 44 | 82 | 62 | 54 | 75 |
| 10 | 61.6 | 107 | 51 | 111 | 64 | 62 | 80 |
| 11 | 60.8 | 62 | 42 | 54 | 69 | 34 | 51 |
| 12 | 60 | 82 | 39 | 47 | 46 | 35 | 49 |
| 13 | 43.2 | 54 | 27 | 58 | 81 | 69 | 57 |
RNFL = retinal nerve fiber layer, ST = superior temporal, T = temporal, IT = inferior temporal, IN = inferior nasal, N = nasal, SN = superior nasal.
* indicates significant correlations (p < 0.05).
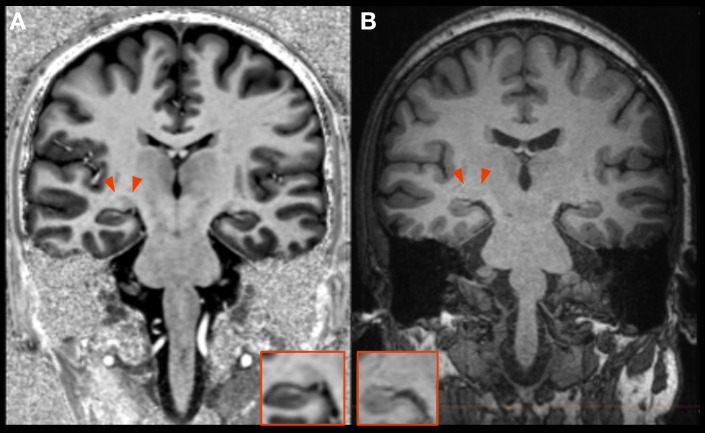
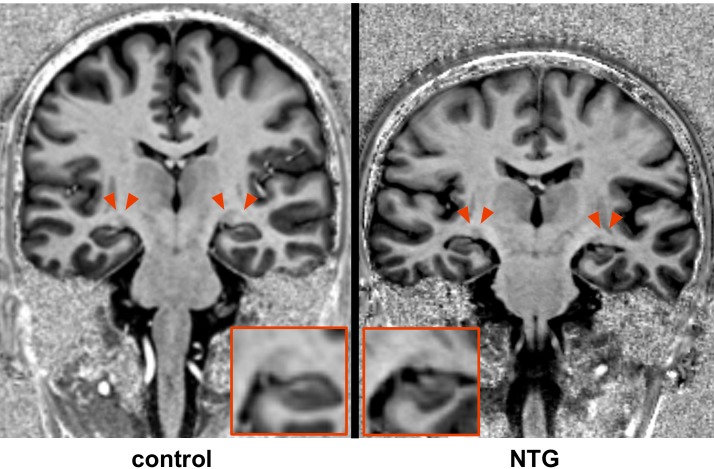
The LGN can be superiorly delineated at a field strength of 7T compared to standard imaging at 3T (Fig 2). LGN volume was significantly reduced in NTG on the right (60.4 mm3 vs 87.7 mm3, p < 0.05) and reduced on the left (61.8 mm3 vs 88.8 mm3, p < 0.05; combined right and left 60.9 vs 88.3, p = 0.05; Figs 3 and 4A). There was a strong positive correlation of LGN volumes of both sides in NTG (r = 0.768, p = 0.001).
Fig 2. Comparison of LGN imaging at 7T and 3T.
The LGN can be clearly identified on a coronal MP2RAGE (A) at 7T whereas this is not the case on a standard MPRAGE at 3T (B).
Fig 3. Distinct atrophy of the LGN (red arrows) in NTG compared to healthy control.
Fig 4.
LGN volume in NTG compared to controls (A). FA of the optic tract (OT) in NTG compared to controls (B). FA of the optic radiation (OR) in NTG compared to controls (C).
Regarding selective tractography, FA of the optic tract was significantly reduced compared to controls (right 0.35 vs 0.66, p < 0.05; left 0.36 vs 0.67, p < 0.05; combined 0.37 vs 0.67, p < 0.05; Fig 4B). FA of the optic radiation was also significantly reduced in NTG (right 0.41 vs 0.70, p < 0.05; left 0.41 vs 0.69, p < 0.05; combined 0.41 vs 0.69, p < 0.05; Fig 4C).
Correlation analysis revealed a significant positive correlation of LGN volume and RNFL thickness. The nasal sector RNFL thickness (superior nasal sector, SN) correlated with the volume of the contralateral LGN (r = 0.471, p = 0.05), whereas the temporal sector RNFL thickness (superior temporal, ST and temporal, T) correlated with the volume of the ipsilateral LGN (r = 0.509, p = 0.038 and r = 0.603, p = 0.015).
Fig 5 shows scatter plots of the correlation between LGN volume and RNFL thickness. There was no correlation between LGN volume and FA of the optic tract or the optic radiation and no correlation of RNFL thickness and FA values of the visual pathway.
Fig 5. Correlation analysis reveals a strong correlation of RNFL thickness and LGN volume in NTG according to the complex anatomy of the optic tracts and the optic chiasm.
The nasal sector RNFL thickness (crossing axons of the ganglion cells in the optic chiasm) correlates with the volume of the contralateral LGN, whereas the temporal sector RNFL thickness (non-crossing axons of the ganglion cells in the optic chiasm) correlates with the volume of the ipsilateral LGN.
Discussion
To the best of our knowledge, these are the first ultra high-field MRI data of NTG patients obtained at a magnetic field strength of 7T.
Our results reveal significant atrophy of the LGN in NTG compared to healthy controls. Furthermore, we demonstrate reduced FA of the optic tract in the NTG group as a marker of axonal degeneration.
The LGN, located in the metathalamus, is the relay station of the intracranial visual pathway and of utmost importance providing the interconnection of the 3rd (optic nerve and optic tract) and the 4th neuron (optic radiation). In an experimental primate model of glaucoma, atrophy of the LGN has been described firstly: Yücsel et. al reported degenerative changes in magnocellular, parvocellular and koniocellular pathways in the LGN and these changes were related to intraocular pressure and the severity of optic nerve damage [23].
The high spatial resolution at 7T imaging allows for accurate and possibly superior delineation of the LGN based on high-resolution anatomical datasets compared to standard imaging at 3T with the same acquisition time (Fig 2). Thus, direct volumetry of the LGN was possible without the need for further post-processing. Our results show distinct atrophy of the LGN (Figs 3 and 4A) and are in accordance with the single study that investigated LGN atrophy in NTG so far [24]. However, this previous study has certain limitations. MRI data was obtained at a magnetic field strength of 1.5T and the volume of the LGN could not be directly estimated, requiring extensive postprocessing and the use of atlas information for identification and volumetry of the LGN. Instead, we used a superior MP2RAGE sequence which has an improved gray/white matter contrast allowing to identify the LGN [25]. Together with improved signal-to-noise ratio and higher spatial resolution due to the higher magnetic field strength of 7T, LGN volumes could be obtained during clinical reading of the examination without extensive post-processing. The merit of the higher field strength is a higher signal to noise ratio, which allows for accurate delineation of the LGN without increasing the acquisition time of the anatomical dataset.
We analyzed the correlation of LGN atrophy with the glaucoma stage described by RNFL thickness, which is a reliable measurement and is widely used to classify glaucoma stage [26]. RNFL was significantly reduced in NTG providing an objective measurement of disease severity in these patients.
There was a strong positive correlation of LGN volume and RNFL thickness (Fig 5). The anatomy of the optic tracts and the optic chiasm is complex. In humans, the axons of the ganglion cells of the temporal half of the retina do not cross in the optic chiasm and transmit their signal to the ipsilateral LGN. In contrast, the axons of the ganglion cells of the nasal half of the retina decussate in the optic chiasm and transmit their signal to the contralateral LGN. Accordingly, the temporal RNFL thickness (superior temporal and temporal retinal sectors) correlated with the volume of the ipsilateral LGN, whereas the nasal sector RNFL thickness (superior nasal sector) correlated with the volume of the contralateral LGN.
Our data shows, that degeneration patterns of the LGN in normal tension glaucoma correspond to retinal degenerative processes regarding the anatomy of the visual pathway. Thus, high-resolution imaging of the LGN may complement glaucoma diagnosis and follow-up and may give new insights into the pathophysiology of these degenerative processes when combined with functional imaging. Especially UHF-MRI of the visual pathway is promising, because no further post-processing for volumetry of the LGN is required due to the high spatial resolution. Today, UHF scanners (7T and above) are limited to few specialized research centers. The first clinical 7T scanners are expected to receive FDA approval in the near future, and as soon as they are established, UHF-MRI will become more widely available. All patients suffered from binocular NTG and except for one patient RNFL was significantly reduced in both eyes (Table 1). Degeneration of the LGN and its correlation with disease severity has also been found in primary open-angle glaucoma [8, 9, 12].
Given degenerative volume loss of the RNFL and the LGN, we performed selective tractography of the optic tract and the optic radiation to assess axonal damage. The high spatial information of the acquired MP2RAGE anatomical sequence allows the identification of the LGN, resulting in more precise diffusion measurements [27]. To further improve ROI based diffusion measurements, we performed selective tractography of the optic tracts and the optic radiations. Fractional anisotropy of the axons of the 3rd neuron, i.e. the optic tract, was significantly reduced compared to healthy controls (Fig 4B). Our results are in agreement with earlier measurements of FA of the optic nerves in NTG [24]. Reduced FA of the optic tracts implies axonal damage of the 3rd neuron and is linked to HRT-based indices of glaucoma severity and impairment of the spatial-temporal contrast sensitivity [28].
Regarding the axons of the 4th neuron, there was significantly reduced FA of the optic radiations in patients compared to controls. Degeneration of the 4th neuron has been described before [16]. We assume a—potentially time dependent—anterior-posterior gradient of axonal degeneration of the visual pathway in NTG. The concept of transsynaptic degeneration in glaucoma has been described by Gupta et al. [5]. This concept may apply for NTG patients with progressed disease leading to degeneration of the optic radiation in late stages.
This study has limitations. Although data was obtained with an ultra high-field scanner delivering very high anatomical resolution, further studies comprising more patients need to be performed for characterization of degeneration of the optic radiation in late stages of the disease. One drawback is that control subjects were not age-matched. Therefore, we cannot exclude effects of ageing in our results. However, regarding comparison to healthy controls, our results corroborate previously reported data. Additionally, LGN atrophy could only be correlated with glaucoma stage determined by RNFL thickness rather than histopathological morphology. Therefore, human postmortem studies would be beneficial.
Conclusion
UHF-MRI including DTI of the visual pathway reliably reveals axonal degeneration of the optic tract and optic radiation in NTG as well as atrophy of the LGN correlating with disease severity measured by RNFL thickness loss. UHF-MRI can thus complement ophthalmological diagnosis of NTG and potentially serve as a powerful tool for treatment monitoring and follow-up.
Data Availability
All relevant files are available from the figshare database (DOI: 10.6084/m9.figshare.6197141).
Funding Statement
This work was supported by the Interdisciplinary Center for Clinical Research (IZKF Erlangen, project J53, MAS). Siemens Healthcare AG provided support in the form of salaries for authors [RH, TK], but did not have any additional role in the study design, data collection and analysis, decision to publish, or preparation of the manuscript.
References
- 1.Chen WW, Wang N, Cai S, Fang Z, Yu M, Wu Q, et al. Structural brain abnormalities in patients with primary open-angle glaucoma: a study with 3T MR imaging. Investigative ophthalmology & visual science. 2013;54(1):545–54. Epub 2012/12/22. doi: 10.1167/iovs.12-9893 . [DOI] [PubMed] [Google Scholar]
- 2.Li C, Cai P, Shi L, Lin Y, Zhang J, Liu S, et al. Voxel-based morphometry of the visual-related cortex in primary open angle glaucoma. Current eye research. 2012;37(9):794–802. Epub 2012/05/29. doi: 10.3109/02713683.2012.683506 . [DOI] [PubMed] [Google Scholar]
- 3.Engelhorn T, Michelson G, Waerntges S, Struffert T, Haider S, Doerfler A. Diffusion tensor imaging detects rarefaction of optic radiation in glaucoma patients. Academic radiology. 2011;18(6):764–9. Epub 2011/03/08. doi: 10.1016/j.acra.2011.01.014 . [DOI] [PubMed] [Google Scholar]
- 4.Schmidt MA, Mennecke A, Michelson G, Doerfler A, Engelhorn T. DTI Analysis in Patients with Primary Open-Angle Glaucoma: Impact of Registration on Voxel-Wise Statistics. PloS one. 2014;9(6):e99344 Epub 2014/06/06. doi: 10.1371/journal.pone.0099344 . [DOI] [PMC free article] [PubMed] [Google Scholar]
- 5.Gupta N, Yucel YH. Glaucoma as a neurodegenerative disease. Current opinion in ophthalmology. 2007;18(2):110–4. Epub 2007/02/16. doi: 10.1097/ICU.0b013e3280895aea . [DOI] [PubMed] [Google Scholar]
- 6.Gupta N, Ang LC, Noel de Tilly L, Bidaisee L, Yucel YH. Human glaucoma and neural degeneration in intracranial optic nerve, lateral geniculate nucleus, and visual cortex. The British journal of ophthalmology. 2006;90(6):674–8. Epub 2006/02/09. doi: 10.1136/bjo.2005.086769 ; PubMed Central PMCID: PMC1860237. [DOI] [PMC free article] [PubMed] [Google Scholar]
- 7.Wang J, Li T, Sabel BA, Chen Z, Wen H, Li J, et al. Structural brain alterations in primary open angle glaucoma: a 3T MRI study. Scientific reports. 2016;6:18969 Epub 2016/01/09. doi: 10.1038/srep18969 ; PubMed Central PMCID: PMCPMC4705520. [DOI] [PMC free article] [PubMed] [Google Scholar]
- 8.Dai H, Mu KT, Qi JP, Wang CY, Zhu WZ, Xia LM, et al. Assessment of lateral geniculate nucleus atrophy with 3T MR imaging and correlation with clinical stage of glaucoma. AJNR American journal of neuroradiology. 2011;32(7):1347–53. Epub 2011/07/16. doi: 10.3174/ajnr.A2486 . [DOI] [PMC free article] [PubMed] [Google Scholar]
- 9.Chen Z, Wang J, Lin F, Dai H, Mu K, Zhang H. Correlation between lateral geniculate nucleus atrophy and damage to the optic disc in glaucoma. Journal of neuroradiology Journal de neuroradiologie. 2013;40(4):281–7. Epub 2013/02/26. doi: 10.1016/j.neurad.2012.10.004 . [DOI] [PubMed] [Google Scholar]
- 10.Engelhorn T, Michelson G, Waerntges S, Otto M, El-Rafei A, Struffert T, et al. Changes of radial diffusivity and fractional anisotropy in the optic nerve and optic radiation of glaucoma patients. TheScientificWorldJournal. 2012;2012:849632 Epub 2012/05/18. doi: 10.1100/2012/849632 ; PubMed Central PMCID: PMC3349161. [DOI] [PMC free article] [PubMed] [Google Scholar] [Retracted]
- 11.Nucci C, Mancino R, Martucci A, Bolacchi F, Manenti G, Cedrone C, et al. 3-T Diffusion tensor imaging of the optic nerve in subjects with glaucoma: correlation with GDx-VCC, HRT-III and Stratus optical coherence tomography findings. The British journal of ophthalmology. 2012;96(7):976–80. Epub 2012/05/26. doi: 10.1136/bjophthalmol-2011-301280 . [DOI] [PubMed] [Google Scholar]
- 12.Lee JY, Jeong HJ, Lee JH, Kim YJ, Kim EY, Kim YY, et al. An investigation of lateral geniculate nucleus volume in patients with primary open-angle glaucoma using 7 tesla magnetic resonance imaging. Investigative ophthalmology & visual science. 2014;55(6):3468–76. Epub 2014/04/12. doi: 10.1167/iovs.14-13902 . [DOI] [PubMed] [Google Scholar]
- 13.Wang J, Miao W, Li J, Li M, Zhen Z, Sabel B, et al. Automatic segmentation of the lateral geniculate nucleus: Application to control and glaucoma patients. Journal of neuroscience methods. 2015;255:104–14. Epub 2015/08/19. doi: 10.1016/j.jneumeth.2015.08.006 . [DOI] [PubMed] [Google Scholar]
- 14.Kraff O, Fischer A, Nagel AM, Monninghoff C, Ladd ME. MRI at 7 Tesla and above: demonstrated and potential capabilities. Journal of magnetic resonance imaging: JMRI. 2015;41(1):13–33. Epub 2014/01/31. doi: 10.1002/jmri.24573 . [DOI] [PubMed] [Google Scholar]
- 15.Esporcatte BL, Tavares IM. Normal-tension glaucoma: an update. Arquivos brasileiros de oftalmologia. 2016;79(4):270–6. Epub 2016/09/15. doi: 10.5935/0004-2749.20160077 . [DOI] [PubMed] [Google Scholar]
- 16.Boucard CC, Hanekamp S, Curcic-Blake B, Ida M, Yoshida M, Cornelissen FW. Neurodegeneration beyond the primary visual pathways in a population with a high incidence of normal-pressure glaucoma. Ophthalmic & physiological optics: the journal of the British College of Ophthalmic Opticians (Optometrists). 2016;36(3):344–53. Epub 2016/04/27. doi: 10.1111/opo.12297 . [DOI] [PubMed] [Google Scholar]
- 17.Sehi M, Iverson SM. Glaucoma Diagnosis and Monitoring Using Advanced Imaging Technologies. US ophthalmic review. 2013;6(1):15–25. Epub 2014/01/29. ; PubMed Central PMCID: PMCPMC3901957. [PMC free article] [PubMed] [Google Scholar]
- 18.Shin HJ, Cho BJ. Comparison of retinal nerve fiber layer thickness between Stratus and Spectralis OCT. Korean journal of ophthalmology: KJO. 2011;25(3):166–73. Epub 2011/06/10. doi: 10.3341/kjo.2011.25.3.166 ; PubMed Central PMCID: PMCPMC3102819. [DOI] [PMC free article] [PubMed] [Google Scholar]
- 19.Porter DA, Heidemann RM. High resolution diffusion-weighted imaging using readout-segmented echo-planar imaging, parallel imaging and a two-dimensional navigator-based reacquisition. Magnetic resonance in medicine: official journal of the Society of Magnetic Resonance in Medicine / Society of Magnetic Resonance in Medicine. 2009;62(2):468–75. Epub 2009/05/19. doi: 10.1002/mrm.22024 . [DOI] [PubMed] [Google Scholar]
- 20.Marques JP, Kober T, Krueger G, van der Zwaag W, Van de Moortele PF, Gruetter R. MP2RAGE, a self bias-field corrected sequence for improved segmentation and T1-mapping at high field. NeuroImage. 2010;49(2):1271–81. Epub 2009/10/13. doi: 10.1016/j.neuroimage.2009.10.002 . [DOI] [PubMed] [Google Scholar]
- 21.Horton JC, Landau K, Maeder P, Hoyt WF. Magnetic resonance imaging of the human lateral geniculate body. Archives of neurology. 1990;47(11):1201–6. Epub 1990/11/01. . [DOI] [PubMed] [Google Scholar]
- 22.Tamraz J. Neuroradiologic investigation of the visual system using magnetic resonance imaging. Journal of clinical neurophysiology: official publication of the American Electroencephalographic Society. 1994;11(5):500–18. Epub 1994/09/01. . [DOI] [PubMed] [Google Scholar]
- 23.Yucel YH, Zhang Q, Weinreb RN, Kaufman PL, Gupta N. Effects of retinal ganglion cell loss on magno-, parvo-, koniocellular pathways in the lateral geniculate nucleus and visual cortex in glaucoma. Progress in retinal and eye research. 2003;22(4):465–81. Epub 2003/05/14. . [DOI] [PubMed] [Google Scholar]
- 24.Zhang YQ, Li J, Xu L, Zhang L, Wang ZC, Yang H, et al. Anterior visual pathway assessment by magnetic resonance imaging in normal-pressure glaucoma. Acta ophthalmologica. 2012;90(4):e295–302. Epub 2012/04/12. doi: 10.1111/j.1755-3768.2011.02346.x . [DOI] [PubMed] [Google Scholar]
- 25.Okubo G, Okada T, Yamamoto A, Kanagaki M, Fushimi Y, Okada T, et al. MP2RAGE for deep gray matter measurement of the brain: A comparative study with MPRAGE. Journal of magnetic resonance imaging: JMRI. 2016;43(1):55–62. Epub 2015/06/03. doi: 10.1002/jmri.24960 . [DOI] [PubMed] [Google Scholar]
- 26.Schulze A, Lamparter J, Pfeiffer N, Berisha F, Schmidtmann I, Hoffmann EM. Diagnostic ability of retinal ganglion cell complex, retinal nerve fiber layer, and optic nerve head measurements by Fourier-domain optical coherence tomography. Graefe's archive for clinical and experimental ophthalmology = Albrecht von Graefes Archiv fur klinische und experimentelle Ophthalmologie. 2011;249(7):1039–45. Epub 2011/01/18. doi: 10.1007/s00417-010-1585-5 . [DOI] [PubMed] [Google Scholar]
- 27.Naess-Schmidt E, Tietze A, Blicher JU, Petersen M, Mikkelsen IK, Coupe P, et al. Automatic thalamus and hippocampus segmentation from MP2RAGE: comparison of publicly available methods and implications for DTI quantification. International journal of computer assisted radiology and surgery. 2016. Epub 2016/06/22. doi: 10.1007/s11548-016-1433-0 . [DOI] [PubMed] [Google Scholar]
- 28.Michelson G, Engelhorn T, Warntges S, El Rafei A, Hornegger J, Doerfler A. DTI parameters of axonal integrity and demyelination of the optic radiation correlate with glaucoma indices. Graefe's archive for clinical and experimental ophthalmology = Albrecht von Graefes Archiv fur klinische und experimentelle Ophthalmologie. 2013;251(1):243–53. Epub 2012/03/01. doi: 10.1007/s00417-011-1887-2 . [DOI] [PubMed] [Google Scholar]
Associated Data
This section collects any data citations, data availability statements, or supplementary materials included in this article.
Data Availability Statement
All relevant files are available from the figshare database (DOI: 10.6084/m9.figshare.6197141).


