Abstract
Purpose
The aim of the study was to establish a standardized quantitative evaluation of corneal temperature (CT) that includes anchoring reference points in the topography and minimization of artifacts. We further investigated the distribution and the short- and long-term reproducibility of the CT values, as well as the influence of the core temperatures.
Methods
The CT values in both eyes of 40 healthy subjects were measured through thermography. These examinations took place over the course of four visits within 2 consecutive weeks. At each visit, the CTs were measured twice in both eyes with intervals of 15 minutes between measurements.
Results
CT values were not significantly different between the right and left eyes and their distribution was nearly normal. The CTs increased slightly when measured twice over the 15-minute intervals (short-term reproducibility) but remained stable over a period of 2 weeks (long-term reproducibility). In addition, the CT values depended on the core temperatures.
Conclusions
Ocular surface thermography is a fast and noninvasive examination. The methods of optimized and standardized evaluation of the CT values facilitate comparisons and follow-ups.
Translational Relevance
Thermography can be used clinically and scientifically only if both the measurement and its evaluation are efficient and standardized and if the outcomes are highly reproducible.
Keywords: corneal temperature, normal values, ocular surface thermography, reproducibility
Introduction
Thermography produces contactless measurements of the temperature of the surface of a selected object. A thermographic camera provides a large number of individual local temperatures and represents these as false-color images.
Thermography has reached widespread application. For example, it is used to produce images of the surface temperature of buildings in order to detect undesirable heat loss. There are also various medical applications. Skin temperature is the result of a balance between heat loss by radiation, evaporation, and conduction, and heat supply by radiation, local metabolism, convection (blood flow), and conduction. In peripheral organs like hands or feet, the local metabolic heat production is relatively small. Thermography, therefore, can be used as an indirect measure of the local blood flow, which transports heat from the warmer core of the body to the cooler periphery. It can be used to detect angiogenesis in tumors, or blood flow abnormalities in inflammation. Thermography is used in oncology,1 angiology,2 dentistry,3 rheumatology,4 and ophthalmology.5–8
Like the skin, the cornea is exposed to the environment. The cornea is covered by a tear film with an oily outermost layer, which reduces evaporation. Nevertheless, evaporation remains a major factor influencing corneal temperature (CT), and depends on tear film quality. Blinking interrupts the exposure of the cornea to the environment, which redistributes both the tear film and the temperature of the tear film.9 The cornea has no blood vessels, so the central corneal temperature (CCT) depends mainly on heat conduction and convection by the aqueous humor, the temperature of which depends mainly on the blood flow in the ciliary body, and to some extent in the back of the eye.10 The temperature of the peripheral cornea is additionally influenced by the blood flow in the perilimbal vessels.
How can we measure surface temperatures without contact? All objects, from the surface of the sun to a hot plate and human skin, spontaneously radiate electromagnetic waves in accordance with their temperature. The origin of this radiation lies in the thermal movements of the molecules that only cease at a temperature of absolute zero. There is no difference between thermal radiation and light except wavelength; light that is radiated spontaneously from a hot material is termed thermal light. This describes the light in the visible part of the spectrum. Stars or the tungsten wire of a light bulb give off thermal light. The radiation of these emitters is not limited to the visible range, but extends into the ultraviolet and infrared ranges. For black bodies, the ideal emitters, the emission spectra follow the curves described by Planck's Law (Fig. 1). If specific conditions are met, the precise temperature can be obtained from observation of the radiation. It is known that the infrared part of the spectra of materials like earth, water, and also human skin almost perfectly follow the black body curves, the deviation being described by the emissivity; for the cornea, this factor is commonly given as 0.975. A remaining uncertainty in the deduction of the temperature can be diminished by observation at two wavelengths.
Figure 1.
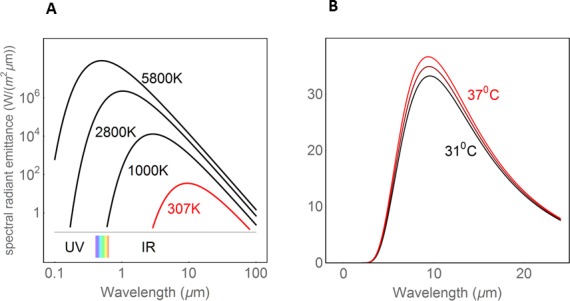
Planck curves (black body radiation). Relationship between surface temperature and thermal radiation (power per radiating area and per interval of wave length). (A) The visible spectrum (between 0.4 and 0.7 μm) is indicated by rainbow colors, to the left is the UV and to the right the infrared radiation. (B) The dependence of thermal radiation from the surface temperature in the temperature range relevant for the cornea (modified after ref. 36).
Some simple laws are applicable, (1) with increasing temperature, the power per radiating area increases rapidly, and (2) the wavelength of the spectral maximum is inversely proportional to the absolute temperature. This means that the lower the temperature, the farther the radiation is in the infrared range (i.e., the farther away it is from the visible range). A naked human body radiates several hundred watts, but almost totally in the infrared range. Thermography is an application of these laws. The intensities of the recorded radiation as a measure of the temperature of the radiating object are displayed in false colors.
The purpose of this study was the optimization and standardization of both the measurement and evaluation of CCT. We describe ways to minimize blinking artifacts, to localize the center of the cornea as a reference point, to attenuate noise by repeated measurements, and to calculate the weighted mean temperature of a central area. We measured and depicted the distribution of individual CT values, both uncorrected and corrected by the individual mean temperature, the symmetry between the two eyes, the short- and long-term reproducibility, and the influence of the core temperature. The environmental temperature and humidity was kept constant, and therefore was not a subject of the present investigation. The ultimate goal was to standardize the quantitative evaluation that can be used in future studies (e.g., to the analysis of the influence of drugs on CCT).
Methods
Study Participants
We advertised the opportunity for healthy subjects to participate in a scientific research project. Forty healthy volunteers, 20 men and 20 women aged between 19 and 47 years, were recruited for this study in the Department of Ophthalmology of the University of Basel, Switzerland. Written informed consent was received from all subjects before admission to the study.
The inclusion criteria were as follows: normal findings in a routine ophthalmologic examination, including slit-lamp examination and fundoscopy, a refractive error between +3.0 and −3.0 diopters of spherical equivalent, corrected visual acuity of 0.8 or higher, a maximum intraocular pressure of 21 mm Hg, and a maximum blood pressure of 140 mm Hg systolic and 90 mm Hg diastolic. Exclusion criteria were as follows: chronic or current systemic or ocular diseases (including dry eyes) or medications (except contraceptives), pregnancy or lactation, and alcohol abuse. Subjects were asked to refrain from alcohol and caffeine for at least 12 hours before the trial measurements.
Ethical approval for the study project was obtained from the local medical ethics committee, “Ethikkommision beider Basel / EKBB” (EK-Nr. 53/10). The study was designed and conducted in accordance with the tenets of the Declaration of Helsinki.
Corneal Temperature Measurements
CT measurements were performed using the contactless infrared Ocular Surface Thermographer TG-1000 (Tomey Corporation, Nagoya, Japan). The instrument has two cameras, one for regular pictures (sensitive to visible light) and one for thermography (sensitive to infrared light). With the help of the infrared light camera, the instrument quantifies surface temperatures by measuring emitted thermal energy within an electromagnetic spectrum of 8- to 17-μm wavelengths, and a topographic resolution of 240 × 320. The outcome was then presented in form of false-color images. All CT measurements were performed under a constant room temperature of 24°C and humidity of 50%. The examination room had no windows and the door was kept closed to avoid air flow.11 The room was illuminated with neon light. The subjects first rested for 10 minutes in the examination room in order to adapt to the environment. At the start of each recording session, the subjects were asked to blink normally, then to keep both eyes closed for approximately 5 seconds. For the recordings, the subjects were asked to put their chin on the chin rest, look at the fixation target, and try to keep their eyes opened widely for 10 seconds. The pupils were not dilated.
Ear Temperature Measurements
An infrared ear thermometer (Braun ThermoScan; Braun Co., Kronberg, Germany) was used to measure tympanic temperature as a surrogate for body core temperature.
Study Plan
The measurements took place during four visits within 2 consecutive weeks. Visits one and two took place during 2 consecutive days of the first study week (week 1), and visits three and four during 2 consecutive days of the second study week (week 2). The visits and readings always took place at the same time of day, as ocular surface temperature has been shown to vary throughout the day.12 Each visit consisted of two recording sessions with an interval of 15 minutes and the CTs of the right and left eyes were measured. In total, eight recording sessions took place for each eye, and 80 eyes were investigated.
Data Recording and Data Processing
One recording session (lasting 10 seconds) consisted of 21 repeated measurements with time intervals of 0.5 seconds. The CT values were then exported as a comma-separated value (CSV) file. This export tool, storing individual temperature readings in a suitable data format, was not implemented by the device, but was provided by the manufacturer on request.
The Ocular Surface Thermographer TG-1000 quantifies the temperature of the eye and its surroundings (Fig. 2B). In this study, we focused on the cornea. The test grid was constantly shifted slightly to the lower part of the cornea to avoid the unwanted influence of the upper lid, as depicted in Figure 2A. CT was lowest in the center and increased toward the periphery, more toward the nasal than the temporal side.
Figure 2.

(A) The area of interest with the 28 test locations is depicted for the right and left eye. (B) The ocular surface thermographer quantifies the temperature of the eye and its surroundings.
All CSV files were arranged in 21 rectangular blocks, each with 320 × 240 pixels corresponding to the visual display on the device screen (Fig. 2B). For further evaluations, data were imported into the statistical software R.13 We focused on 7 × 4 = 28 equidistant test locations (Fig. 2A), each representing the mean of nine neighboring pixels. The grid constant (the distance between adjacent test locations) was 20 pixels, corresponding approximately 1.8 mm on the cornea. The chosen field of interest covered a region only marginally affected by the eyebrows and eyelids. As the CSV files do not respect the eye side, the coordinates of the left eyes had to be turned around the vertical axis.
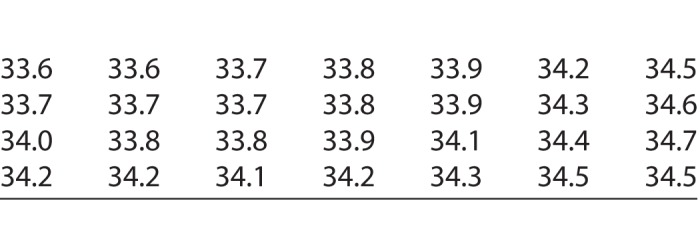
In order to achieve stable values unaffected by blinking and brow artifacts, the median of each test location (CTm) was calculated across the 21 repetitions. Finally, the CTms of the 28 test locations of each eye were used for further statistical evaluations. The spatial distribution of local temperatures in our test grid is illustrated based on the outcome of the right eye of one subject (Table).
Table.
One Reading of the Temperatures (°C) at the Test Locations of Our Test Grid of the Right Eye of One Subject. The Locations Correspond to the Test Grid Illustrated in Figure 2A
Statistical Analysis
Histograms, boxplots, and scatterplots were used in order to visualize the distribution of CTm values across time points, eyes, and locations. In order to simplify calculations, the median of the CTm values across the 28 test locations was calculated (CTM). In boxplots, the CTM values were displayed. The potential influence of eye side, repetitions, days, and weeks on CTM values were analyzed with a linear mixed-effects model. The dependent variable was CTM. Mixed-effect models are suitable tools for repeated measures data. Results are presented as differences of means with corresponding 95% confidence intervals (CI) and P values. Associations between time points or eye side were further assessed using Spearman's correlation. A P value of less than 0.05 was considered significant. All evaluations were done using the statistical software R version 3.2.1.13
Results
Distribution of CTm Values
The CTm values pooled over all recording sessions are shown in Figure 3A. The distribution was slightly skewed toward lower temperatures. When the mean CT for each session of each eye was subtracted from the CTm values, the distribution was nearly normal (Fig. 3B). This allows for the application of parametric tests, such as mixed-effects models.
Figure 3.
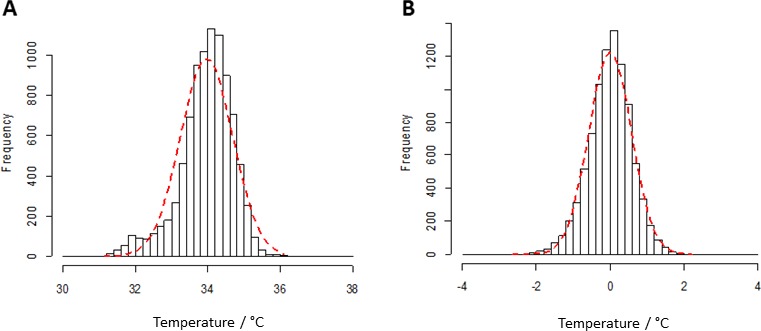
(A) Distribution of pooled CTm values. (B) CTm values subtracted by the means of the CTs of each eye. This corresponds to the distribution of the temperature across the cornea.
Symmetry Between Right and Left Eyes
As presented in Figure 4A, the temperature was nearly equal in the right and left eyes. There was a very slight, but statistically not significant tendency for lower values in the left eyes (left–right = −0.026, CI = −0.030 to 0.082, P = 0.36). Figure 4B shows the correlation between the right and left eyes.
Figure 4.
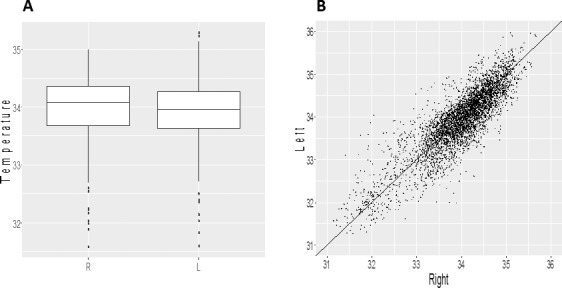
Side comparison. (A) CTM values were nearly equal between the two eyes. (B) Correlation between values of right and left eyes: R = 0.92 (P < 0.001). Points indicate CTm values pooled across all subjects. R, right eye; L, left eye.
Short-Term Reproducibility
In order to analyze short-term reproducibility (within the same visit of the same day), we compared the CTM values of all first with all second recording sessions. During the 15 minutes between the first and second recording sessions, the CTM temperature increased on average, slightly but significantly (mean difference: 0.26, CI = 0.20–0.31, P < 0.001; Fig. 5), despite a prior initial acclimatization period of 10 minutes.
Figure 5.
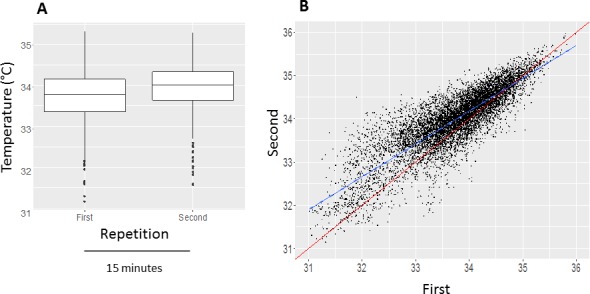
Short-term reproducibility. (A) During the 15 minutes between the first and the second recording session, the CTs increased slightly on average (P < 0.001). Boxplots of CTM values of each eye (°C). (B) Correlation between the CTm values of the first and second recording session: R = 0.95 (P < 0.001). The blue line is the regression line and the red line represents the diagonal line.
Long-Term Reproducibility
The four sessions took place on blocks of 2 consecutive days on 2 consecutive weeks. Figure 6 represents boxplots of the CTM values of each eye on the four visits. The difference between day 1 and day 2 was 0.039°C (CI: −0.017 to 0.095, P = 0.17), the difference between week 1 and week 2 was 0.028°C (CI: −0.028 to 0.084, P = 0.33). This indicates that CTM values remain stable even over a period of 2 weeks (at least when measured at the same time of day).
Figure 6.
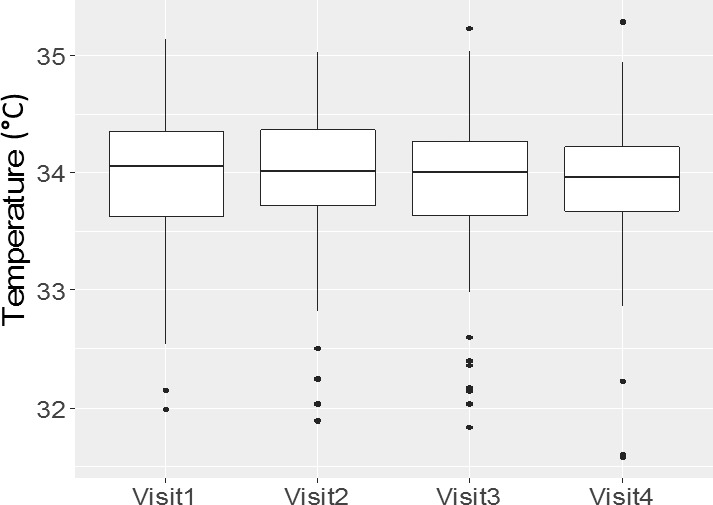
Long-term reproducibility. Boxplots of CTM values from the four visits. The CT measurements took place during four visits within 2 consecutive weeks. Visits one and two took place within 2 consecutive days of the first study week (week 1) and visits three and four within 2 consecutive days of the second study week (week 2).
Influence of the Core Temperature
Ear temperature, a surrogate for core temperature, was measured at each visit after a 10-minute adaption to the room temperature. CTm values were significantly (P < 0.001) dependent on the core temperature (slope = 0.36°/unit increase of earT; Fig. 7).
Figure 7.
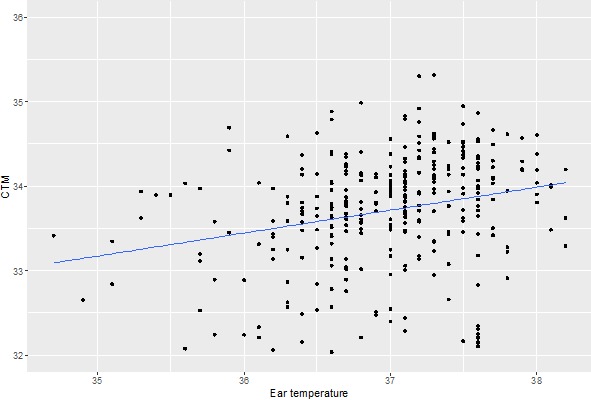
Influence of the core temperature on CT. There is a significant dependence of CT on ear temperature (slope = 0.36°/unit increase of earT, P < 0.001). Dots represent CTM values across each subject's eye at the first baseline.
Discussion
In the present study, we investigated some basic aspects of ocular thermography. We focused on the cornea. Of the 240 × 320 measured points of the instrument, we defined a test grid consisting of 28 test locations covering the central part of the cornea. Each test location on the grid represents the mean temperature of nine neighboring pixels. This grid was kept constant for the entire study (Fig. 2). To keep the topography comparable between individuals and constant during the study, we developed an algorithm to find the center of the cornea, which was then used as an anchor for the test grid. This test grid was shifted slightly to the lower part of the cornea to avoid the unwanted influence of the upper lid. In order to avoid influence from blinking, the median of the 21 values of an individual recording session was calculated for each test location.
The distribution of the individual temperature readings was slightly skewed toward lower temperatures, mainly due to the fact that some individuals had relatively low CTs. After correcting with the individual mean CTs of each eye, there resulted a distribution close to normal.
The CTs were very symmetrical between the right and the left eyes. There was a very slight, but statistically not significant tendency for lower values in the left eye, probably due to the fact that the measurements always started in the right eye.
We then investigated the short- and long-term reproducibility of the CT values. Unexpectedly, when repeating the measurements after 15 minutes, the CT was slightly but significantly higher at the second reading, despite a 10-minute acclimatization period before the first reading. The reason for this effect is not clear, but could be due psychological relaxation of the subjects.14 Over a period of 1 week, CT values remained stable (at least when measured at the same time of day).
Finally, we demonstrated a significant dependence of CT values on the core temperature.
Our results partially confirm the results of other authors. In healthy eyes, the limbus area was shown to be warmer than the center of the cornea,15,16 and the differences between the right and left eyes were shown to be not significantly different.12,15,17 A positive correlation between ocular surface temperature and body temperature has also been reported.18–20 To the best of our knowledge, short- and long-term reproducibility has not been studied before.
The temperatures measured by different infrared thermometers may vary depending on the type of the instrument. Unlike contact thermometers, which can be calibrated easily and reliably, the temperatures given by an infrared thermometer depend on the wavelength range used and on the assumed value of the emissivity of the cornea. This may be the reason why CTs reported in different papers are not exactly the same.21 However, this remark concerns only the absolute level of temperatures, whereas temperature differences are almost exactly the same when measured by different instruments.
Corneal thermography may clinically be useful for diagnosis and follow-up of patients suffering from different eye diseases. Ocular thermography has been described to be useful for differentiating between aqueous dry eye and evaporative dry eye.22 It was also applied in patients with dry eye due to dysfunction of lacrimal gland or dysfunction of meibomian glands, or Sjogren's syndrome.22–25 Thermography was also performed in patients with glaucoma,26 particularly normal tension glaucoma. Furthermore, it was used to record the temperature course after glaucoma surgery27 or other ocular surgeries,28,29 for example in patients undergoing refractive surgery25,30 or in patients with corneal transplant.31 Ocular surface thermography also seems to be helpful in patients with corneal ulcer,32 patients wearing contact lens,33 or in patients with keratoconus wearing scleral lens.7 It was even used in patients with age-related macular degeneration,6 diabetic retinopathy,34 or general diseases, such as depression.35
Considering all the results together, thermography is a fast, noninvasive, and useful method for quantifying surface temperature. It can be used in ophthalmology, particularly for quantifying CT. For interindividual comparison as well as for follow-ups, a constant and fixated test grid together with a standardized quantitative evaluation eliminating or at least mitigating artifacts is necessary. In addition, it is mandatory to keep environmental temperature and humidity constant, and to correct the CT values for core temperature.5–8
Acknowledgments
Disclosure: K. Konieczka, None; A. Schoetzau, None; S. Koch, None; D. Hauenstein, None; J. Flammer, None
References
- 1. Hatwar R, Herman C. . Inverse method for quantitative characterisation of breast tumours from surface temperature data. Int J Hyperthermia. 2017; 33: 741– 757. [DOI] [PubMed] [Google Scholar]
- 2. Harding JR. . Investigating deep venous thrombosis with infrared imaging. IEEE Eng Med Biol Mag. 1998; 17: 43– 46. [DOI] [PubMed] [Google Scholar]
- 3. Gratt BM, Anbar M. . Thermology and facial telethermography: part II. Current and future clinical applications in dentistry. Dentomaxillofac Radiol. 1998; 27: 68– 74. [DOI] [PubMed] [Google Scholar]
- 4. Lasanen R, Piippo-Savolainen E, Remes-Pakarinen T,et al. . Thermal imaging in screening of joint inflammation and rheumatoid arthritis in children. Physiol Meas. 2015; 36: 273– 282. [DOI] [PubMed] [Google Scholar]
- 5. Pattmoller J, Wang J, Zemova E,et al. . Correlation of corneal thickness, endothelial cell density and anterior chamber depth with ocular surface temperature in normal subjects. Z Med Phys. 2015; 25: 243– 250. [DOI] [PubMed] [Google Scholar]
- 6. Sodi A, Matteoli S, Giacomelli G, Finocchio L, Corvi A, Menchini U. . Ocular surface temperature in age-related macular degeneration. J Ophthalmol. 2014; 2014: 281010. [DOI] [PMC free article] [PubMed] [Google Scholar]
- 7. Carracedo G, Wang Z, Serramito-Blanco M, Martin-Gil A, Carballo-Alvarez J, Pintor J. . Ocular surface temperature during scleral lens wearing in patients with keratoconus. Eye Contact Lens. 2017; 43: 346– 351. [DOI] [PubMed] [Google Scholar]
- 8. Abreau K, Callan C, Kottaiyan R,et al. . Temperatures of the ocular surface, lid, and periorbital regions of sjogren's, evaporative, and aqueous-deficient dry eyes relative to normals. Ocul Surf. 2016; 14: 64– 73. [DOI] [PubMed] [Google Scholar]
- 9. Purslow C, Wolffsohn JS. . Ocular surface temperature: a review. Eye Contact Lens. 2005; 31: 117– 123. [DOI] [PubMed] [Google Scholar]
- 10. Gugleta K, Orgul S, Flammer J. . Is corneal temperature correlated with blood-flow velocity in the ophthalmic artery? Curr Eye Res. 1999; 19: 496– 501. [DOI] [PubMed] [Google Scholar]
- 11. Freeman RD, Fatt I. . Environmental influences on ocular temperature. Invest Ophthalmol Vis Sci. 1973; 12: 596– 602. [PubMed] [Google Scholar]
- 12. Kocak I, Orgul S, Flammer J. . Variability in the measurement of corneal temperature using a noncontact infrared thermometer. Ophthalmologica. 1999; 213: 345– 349. [DOI] [PubMed] [Google Scholar]
- 13. R Core Team. R: A Language and Environment for Statistical Computing. Vienna: R Foundation for Statistical Computing; 2015. [Google Scholar]
- 14. Shiloh R, Schapir L, Bar-Ziv D,et al. . Association between corneal temperature and mental status of treatment-resistant schizophrenia inpatients. Eur Neuropsychopharmacol. 2009; 19: 654– 658. [DOI] [PubMed] [Google Scholar]
- 15. Alio J, Padron M. . Normal variations in the thermographic pattern of the orbito-ocular region. Diagn Imaging. 1982; 51: 93– 98. [PubMed] [Google Scholar]
- 16. Efron N, Young G, Brennan NA. . Ocular surface temperature. Curr Eye Res. 1989; 8: 901– 906. [PubMed] [Google Scholar]
- 17. Mapstone R. . Normal thermal patterns in cornea and periorbital skin. Br J Ophthalmol. 1968; 52: 818– 827. [DOI] [PMC free article] [PubMed] [Google Scholar]
- 18. Mapstone R. . Determinants of corneal temperature. Br J Ophthalmol. 1968; 52: 729– 741. [DOI] [PMC free article] [PubMed] [Google Scholar]
- 19. Girardin F, Orgul S, Erb C, Flammer J. . Relationship between corneal temperature and finger temperature. Arch Ophthalmol. 1999; 117: 166– 169. [DOI] [PubMed] [Google Scholar]
- 20. Morgan PB, Soh MP, Efron N, Tullo AB. . Potential applications of ocular thermography. Optom Vis Sci. 1993; 70: 568– 576. [DOI] [PubMed] [Google Scholar]
- 21. Fabiani C, Li Voti R, Rusciano D, Mutolo MG, Pescosolido N. . Relationship between corneal temperature and intraocular pressure in healthy individuals: a clinical thermographic analysis. J Ophthalmol. 2016; 2016: 3076031. [DOI] [PMC free article] [PubMed] [Google Scholar]
- 22. Matteoli S, Favuzza E, Mazzantini L,et al. . Ocular surface temperature in patients with evaporative and aqueous-deficient dry eyes: a thermographic approach. Physiol Meas. 2017; 38: 1503– 1512. [DOI] [PubMed] [Google Scholar]
- 23. Tan LL, Sanjay S, Morgan PB. . Screening for dry eye disease using infrared ocular thermography. Cont Lens Anterior Eye. 2016; 39: 442– 449. [DOI] [PubMed] [Google Scholar]
- 24. Su TY, Ho WT, Chiang SC, Lu CY, Chiang HK, Chang SW. . Infrared thermography in the evaluation of meibomian gland dysfunction. J Formos Med Assoc. 2017; 116 7: 554– 549. [DOI] [PubMed] [Google Scholar]
- 25. Luong M, Jomir L, Labauge P, Dandurand M, Meunier L, Stoebner PE. . Ross syndrome with sweating anomaly associated with Sjogren syndrome: an infrared thermographic case study. Acta Derm Venereol. 2011; 91: 80– 81. [DOI] [PubMed] [Google Scholar]
- 26. Vannetti F, Matteoli S, Finocchio L,et al. . Relationship between ocular surface temperature and peripheral vasoconstriction in healthy subjects: a thermographic study. Proc Inst Mech Eng H. 2014; 228: 297– 302. [DOI] [PubMed] [Google Scholar]
- 27. Klamann MK, Maier AK, Gonnermann J, Klein JP, Ruokonen P, Pleyer U. . Thermography: a new option to monitor filtering bleb function? J Glaucoma. 2015; 24: 272– 277. [DOI] [PubMed] [Google Scholar]
- 28. Belkin A, Abulafia A, Michaeli A, Ofir S, Assia EI. . Wound temperature profiles of coaxial mini-incision versus sleeveless microincision phacoemulsification. Clin Exp Ophthalmol. 2017; 45: 247– 253. [DOI] [PubMed] [Google Scholar]
- 29. Giannaccare G, Fresina M, Agnifili L, Versura P. . Ocular-surface temperature modification by cataract surgery. J Cataract Refract Surg. 2016; 42: 983– 989. [DOI] [PubMed] [Google Scholar]
- 30. Mencucci R, Mazzotta C, Corvi A, Terracciano L, Rechichi M, Matteoli S. . In vivo thermographic analysis of the corneal surface in keratoconic patients undergoing riboflavin-UV-A accelerated cross-linking. Cornea. 2015; 34: 323– 327. [DOI] [PubMed] [Google Scholar]
- 31. Sniegowski MC, Erlanger M, Olson J. . Thermal imaging of corneal transplant rejection [ published online ahead of print November 4, 2017]. Int Ophthalmol. doi: 10.1007/s10792-017-0731-z. [DOI] [PubMed]
- 32. Klamann MK, Maier AK, Gonnermann J, Klein JP, Bertelmann E, Pleyer U. . Ocular surface temperature gradient is increased in eyes with bacterial corneal ulcers. Ophthalmic Res. 2013; 49 1: 52– 56. [DOI] [PubMed] [Google Scholar]
- 33. Ooi EH, Ng EY, Purslow C, Acharya R. . Variations in the corneal surface temperature with contact lens wear. Proc Inst Mech Eng H. 2007; 221: 337– 349. [DOI] [PubMed] [Google Scholar]
- 34. Sodi A, Giambene B, Miranda P, Falaschi G, Corvi A, Menchini U. . Ocular surface temperature in diabetic retinopathy: a pilot study by infrared thermography. Eur J Ophthalmol. 2009; 19: 1004– 1008. [DOI] [PubMed] [Google Scholar]
- 35. Maller JJ, George SS, Viswanathan RP, Fitzgerald PB, Junor P. . Using thermographic cameras to investigate eye temperature and clinical severity in depression. J Biomed Opt. 2016; 21: 26001. [DOI] [PubMed] [Google Scholar]
- 36. Flammer J, Mozaffarieh M, Bebie H. . Basic Sciences in Ophthalmology. Berlin: Springer-Verlag; 2013. [Google Scholar]


