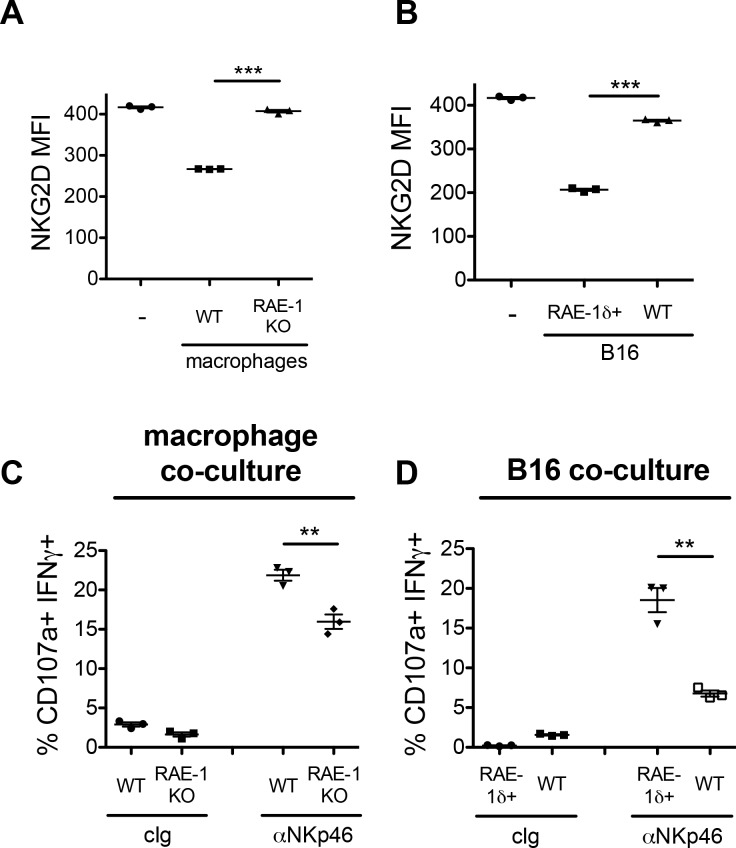
Figure 7. Co-culture of NK cells with RAE-1δ-expressing macrophages and tumor cells.
(A) Peritoneal macrophages from WT or RAE-1-KO mice or were stimulated with 10 ng/ml CSF-1 for 48 hr and then co-cultured with WT splenocytes for 18 hr, and NKG2D levels were analyzed by flow cytometry. (B) B16 or B16-RAE-1δ cells were co-cultured with WT splenocytes for 18 hr, and NKG2D levels on NK cells were analyzed by flow cytometry. (C) WT splenocytes were co-cultured with CSF-1-stimulated WT or RAE-1-KO macrophages for 18 hr, followed by 5 hr stimulation with plate-bound antibody against the NK cell activating receptor NKp46, or control Ig, and NK cell IFNγ and degranulation were analyzed by flow cytometry. (D) WT splenocytes were co-cultured with B16 or B16-RAE-1δ cells for 18 hr, followed by 5 hr stimulation with plate-bound antibody against the NK cell activating receptor NKp46, and NK cell IFNγ and degranulation were analyzed by flow cytometry.


