Abstract
Many retinal diseases lead to the loss of retinal neurons and cause visual impairment. The adult mammalian retina has little capacity for regeneration. By contrast, teleost fish functionally regenerate their retina following injury, and Müller glia (MG) are the source of regenerated neurons1–6. The proneural transcription factor Ascl1 is upregulated in MG after retinal damage1,7 in zebrafish and is necessary for regeneration8. Although Ascl1 is not expressed in mammalian MG after injury9, forced expression of Ascl1 in mouse MG induces a neurogenic state in vitro10 and in vivo after NMDA (N-methyl-D-aspartate) damage in young mice11. However, by postnatal day 16, mouse MG lose neurogenic capacity, despite Ascl1 overexpression11. Loss of neurogenic capacity in mature MG is accompanied by reduced chromatin accessibility, suggesting that epigenetic factors limit regeneration. Here we show that MG-specific overexpression of Ascl1, together with a histone deacetylase inhibitor, enables adult mice to generate neurons from MG after retinal injury. The MG-derived neurons express markers of inner retinal neurons, synapse with host retinal neurons, and respond to light. Using an assay for transposase-accessible chromatin with high-throughput sequencing (ATAC–seq), we show that the histone deacetylase inhibitor promotes accessibility at key gene loci in the MG, and allows more effective reprogramming. Our results thus provide a new approach for the treatment of blinding retinal diseases.
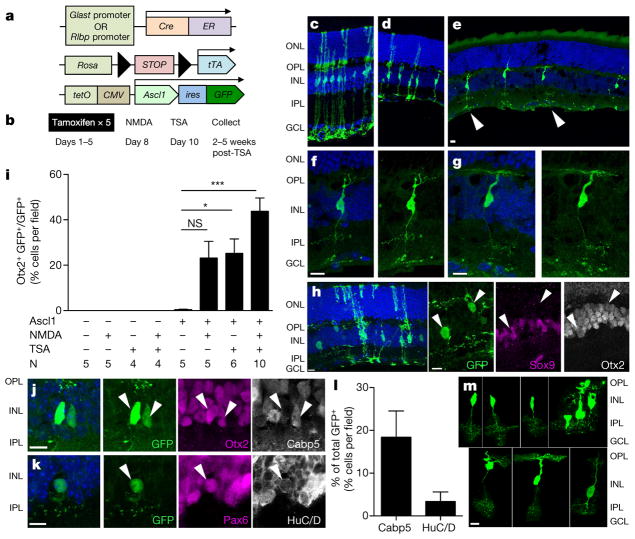
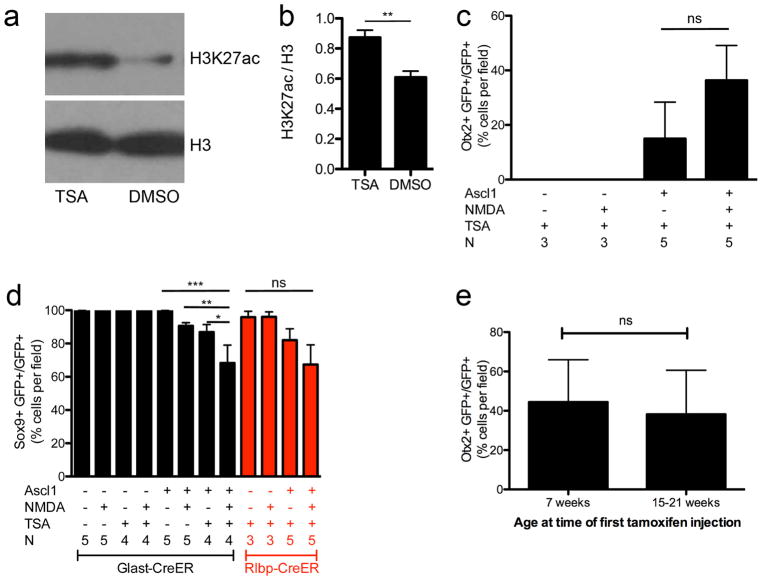
Expression of Ascl1 was directed to MG using mice with a tamoxifen-inducible Cre-recombinase under one of two MG-specific promoters to activate a tetracycline response element driving Ascl1 (Fig. 1a). For control animals, we used Glast (also known as Slc1a3)- or Rlbp1-CreER:flox-stop-CC-GFP, or Rlbp1-creER:tdTomato mice. Adult mice (Extended Data Fig. 1) were injected with tamoxifen before receiving either a PBS or NMDA intravitreal injection. An intravitreal injection of either DMSO or the histone deacetylase inhibitor trichostatin-A (TSA) was then given (Fig. 1b). TSA treatment increased histone H3 K27 acetylation (Extended Data Fig. 2a, b).
Figure 1. Conversion of MG into neurons by Ascl1 and TSA in vivo in adult mice.
a, Mice strains used to express Ascl1 in MG. b, Paradigm for experiments. c–g, Morphologies of Ascl1-overexpressing MG treated with c vehicle, d NMDA, and e NMDA + TSA; f, g, higher magnification of e (arrows). ONL, outer nuclear layer; OPL, outer plexiform layer; INL, inner nuclear layer, IPL, inner plexiform layer; GCL, ganglion cell layer. Images of cells in relative isolation chosen to highlight morphological phenotypes. h, Otx2+ MG-derived neurons lose Sox9 expression (arrows). i, Quantification of Otx2 in each condition in Glast-creER animals. *P <0.05; ***P < 0.001, one-way ANOVA with Tukey’s post hoc test. j, k, MG-derived neurons express bipolar cell-specific marker Cabp5 (j) and amacrine cell markers Pax6 and HuC/D (i; arrow). l, Quantification of Cabp5 or HuC/D in ANT-treated retinas (n = 3 mice per group). m, Representative images of MG-derived neuronal morphologies. Bipolar-like cells have processes in both the OPL and IPL, whereas amacrine-like cells have processes restricted to the IPL. All data are shown as mean ±standard error, all scale bars are 10 μm.
Ascl1-overexpressing animals treated with vehicle displayed normal retinal structure and MG morphology (Fig. 1c). NMDA administration led to a loss of ganglion cells and reduction in the inner plexiform layer (IPL) thickness, though MG retained their normal morphology (Fig. 1d). When Ascl1-overexpressing mice received TSA after NMDA, many GFP+ cells acquired a neuronal-like morphology, with processes in the outer plexiform layer (OPL) and IPL (Fig. 1e–g). Cells with neuronal morphology expressed neuronal markers, for example Otx2, and lost expression of glial markers, like Sox9 (Fig. 1h, i, Extended Data Fig. 2c, d). Otx2+ GFP+ cells with neuronal morphology were seen in both Glast-creER and Rlbp1-creER strains and were only seen in mice that received all three factors: Ascl1, NMDA and TSA (referred to as ANT-treated). The number of Otx2+ GFP+ cells in ANT-treated retinas did not depend on age at time of tamoxifen administration (Extended Data Fig. 2e). Many MG-derived neurons with bipolar-cell-like morphology expressed the bipolar marker Cabp5 (Fig. 1j, l, m). MG-derived neurons with an amacrine-cell-like morphology were less common and often labelled with Pax6 and HuC/D (Fig. 1k–m). We did not observe MG-derived ganglion cell or photoreceptor-specific morphology or markers Brn3, PKC, recoverin, or rhodopsin, in any condition (data not shown). Thus, ANT-treatment is sufficient to enable adult MG to undergo neurogenesis and give rise to retinal interneurons.
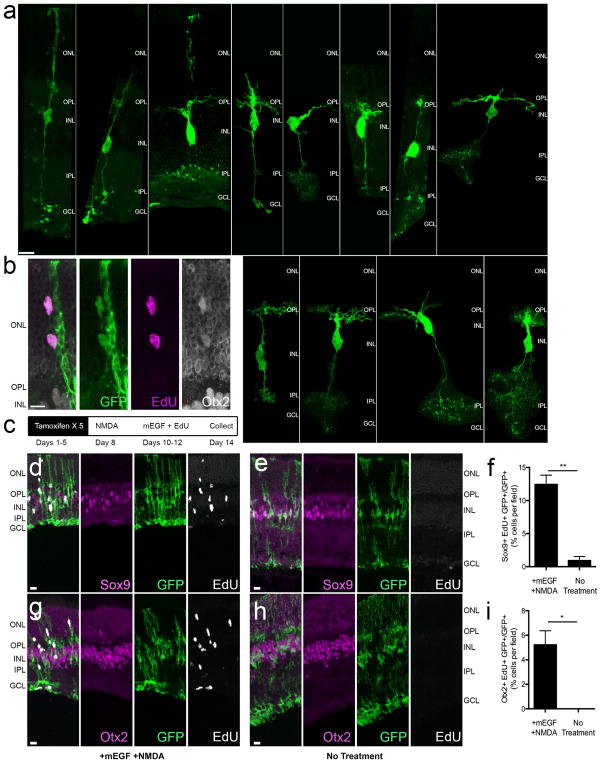
Some MG-derived neurons had ‘hybrid’ morphologies (Extended Data Fig. 3a), raising the possibility that MG undergo direct trans-differentiation into neurons. We tested this by administering 5-ethynyl-2′-deoxyuridine (EdU) daily. Some MG-derived cells that expressed Otx2 also incorporated EdU; however, most MG-derived neurons were unlabelled, consistent with direct transdifferentiation (Extended Data Fig. 3b). Ascl1 overexpression in dissociated cultures promotes MG proliferation10. We therefore tested whether transgenic expression of Ascl1 in vivo stimulates MG proliferation (Extended Data Fig. 3c). Ascl1 alone did not stimulate proliferation; however, when combined with mouse epidermal growth factor, we observed robust MG proliferation (Extended Data Fig. 3d–i). Thus, Ascl1 can promote either neural differentiation or proliferation of MG, depending on the presence of mitogenic factors.
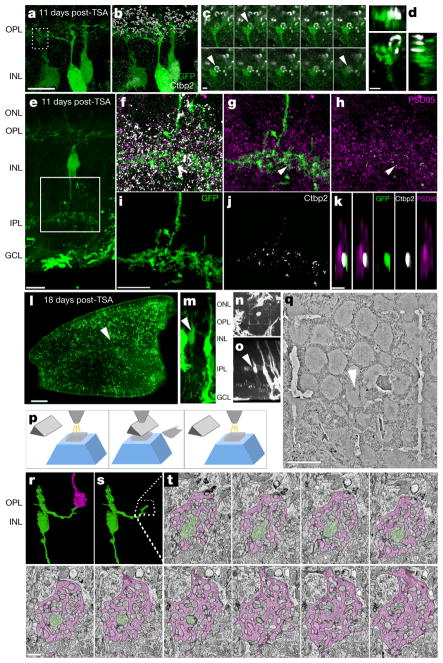
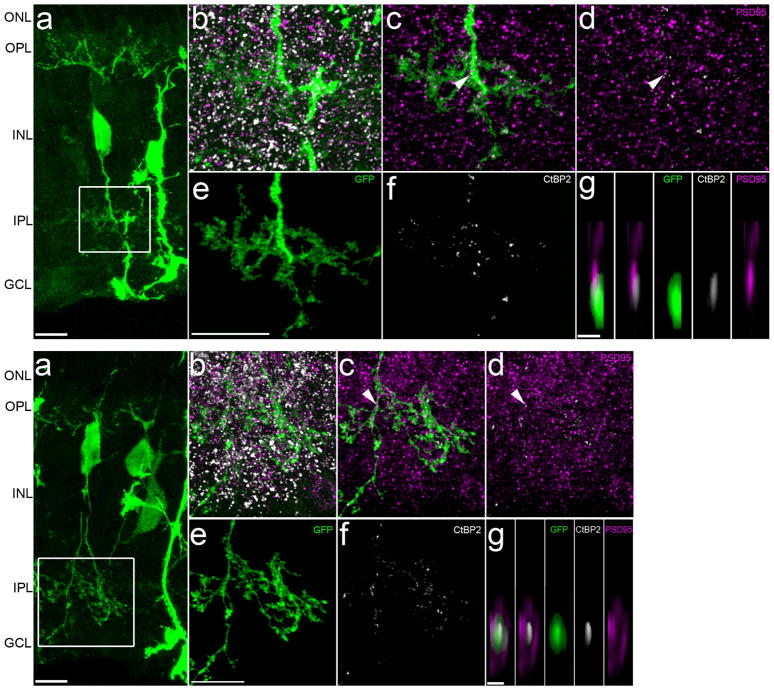
To determine if MG-derived neurons form synaptic connections with the host circuitry, we stained for the presynaptic ribbon marker Ctbp2. We observed ribbons apposed to MG-derived neuronal processes in the OPL (Fig. 2a–d), and ribbons within the MG-derived neuronal processes in the IPL (Fig. 2e–k, Extended Data Fig. 4a–g). To view potential synaptic contacts at higher resolution, we used serial block-face scanning electron microscopy (SBFSEM) to reconstruct MG-derived cell processes (Fig. 2l–t). We traced a process from an identified MG-derived neuron to the OPL and found that this neuron contacted a host cone terminal in a manner similar to horizontal and bipolar cells (Fig. 2q–t).
Figure 2. MG-derived neurons form synaptic connections with retinal circuitry.
a, b, Super-resolution image of MG-derived neurons. c, Box from a shows Ctbp2 ribbon apposed to GFP+ process (arrows), series of 0.16-μm-thick z-stack. d, Orthogonal projection. e, MG-derived bipolar-like cell with processes in IPL. f–k, Super-resolution images from c (box) labelled as indicated; g–k, masked in Amira (see Methods). k, Image of Ctbp2 superposed with PSD95 from g (arrows), xz plane. l, m, MG-derived neuron before branding (arrow). n, Two-photon image of branded box around MG-derived neuron. o, Orthogonal projection of n. p, SBFSEM technique (see Methods). q, SBFSEM image of cell from n (arrow). r, s, Three-dimensional reconstruction of cell from n with process (green) penetrating cone terminal (magenta). t, SBFSEM image series of cell from n colour as in r. Scale bars are 10 μm (a, e, i, q), 1 μm (c, d, k, t) or 200 μm (l).
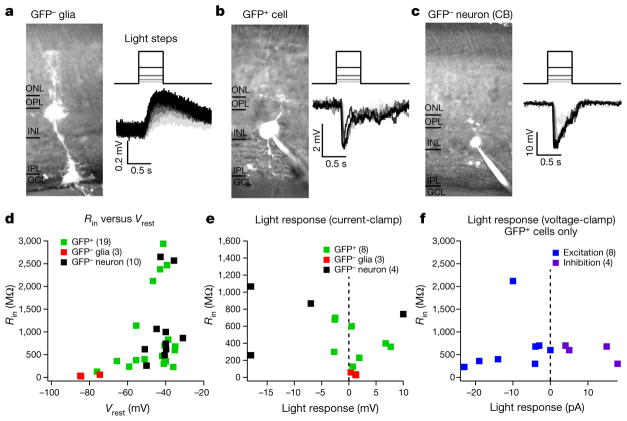
To determine whether MG-derived cells made functional connections with host neurons, we performed whole-cell electrophysiology recordings from GFP+ and GFP− cells. GFP− (that is, normal) MG exhibited characteristic MG properties: morphology, hyperpolarized resting membrane potentials (Vrest), and low input resistance12,13 (Rin), suggesting that MG that do not express Ascl1 maintain relatively normal physiology in NMDA-damaged retinas (Fig. 3a, d). Recordings from GFP+ cells revealed very different physiological and morphological properties (Fig. 3; Extended Data Fig. 5). GFP+ cells had much higher Rin than GFP− MG and the Vrest of GFP+ cells were depolarized compared to GFP− MG (Fig. 3b, d). Many of the GFP+ cells had larger and faster responses to light stimulation than GFP− MG (Fig. 3a, b, e). Some GFP+ cells responded to light increments by depolarizing (as expected for ON-preferring cells), whereas others hyperpolarized to the same stimuli (as expected for OFF-preferring cells; Fig. 3e). GFP+ cells exhibited diverse morphologies and electrical properties, with some cells resembling GFP− MG and others closer to GFP− bipolar and amacrine cells (Fig. 3c–e). To further investigate the synaptic origin of visual responses in MG-derived GFP+ cells, we recorded excitatory and inhibitory synaptic currents. Seven of eight cells exhibited light-evoked excitatory input (Fig. 3f), whereas four of four cells showed light-evoked inhibitory input.
Figure 3. MG-derived GFP+ cells exhibit larger and faster visual responses than normal GFP− MG.
a–c, Example recordings from GFP− MG (a), MG-derived GFP+ cell (b) and GFP− cone bipolar cell (c). Traces are visual responses to 500-ms steps in luminance, recorded in current-clamp. d, Population data for input resistance and resting membrane potential measurements. e, Population data for visual responses recorded with the current-clamp technique. f, Population data for light-evoked excitatory and inhibitory synaptic inputs recorded with the voltage-clamp technique. All cells recorded were from five ANT-treated mice. Recordings were performed at 4, 5, 10, 12 and 15 weeks post-TSA. Visual responses were found in cells regardless of post-TSA duration. GFP− MG: Vrest, −81 ± 6 mV; Rin,41 ±17 MΩ; maximal response to light stimulation, 0.95 ± 0.52 mV; n = 3. GFP+ cells: Vrest, −46±11 mV, n = 19; Rin, 871 ±868 MΩ, n = 20; maximal response to light stimulation, 3.2 ±2.7 mV, n = 8; excitatory input, −10±8 pA, n = 8; inhibitory input, 10 ±7 pA, n = 4. GFP− neurons: Vrest, −42±6 mV, n = 10; Rin, 1,088 ±836 MΩ, n = 10; maximal response to light stimulation, 13 ±6 mV, n = 4. All responses are written mean ±s.d.
These results demonstrate that MG-derived GFP+ cells receive synaptic input. It is difficult to determine using electrophysiology whether the MG-derived neurons contact postsynaptic partners in the IPL. Therefore, we used super-resolution imaging to identify potential output synapses from MG-derived neurons. We found ribbons within MG-derived processes in the IPL that were apposed to PSD95 puncta, consistent with the MG-derived neurons forming glutamatergic synapses with amacrine or ganglion cells (Fig. 2e–k, Extended Data Fig. 4).
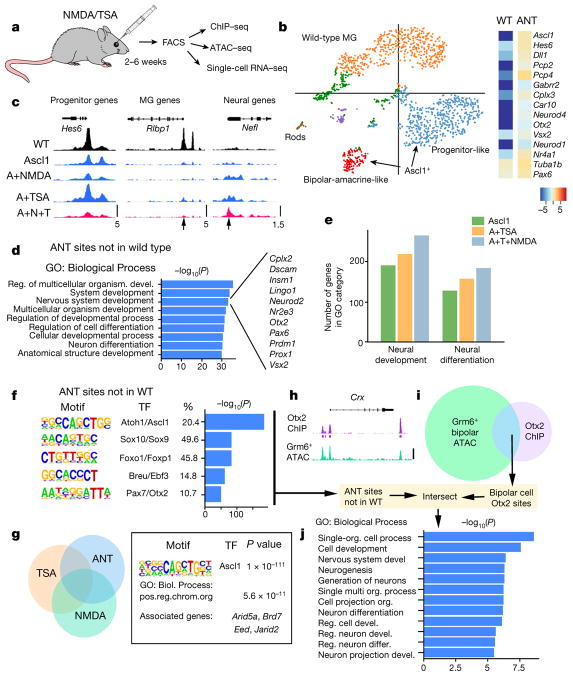
To better understand the mechanisms underlying MG reprogramming, we used fluorescence-activated cell sorting to purify the ANT-treated and wild-type control cells for single-cell mRNA-seq, ATAC–seq and ChIP–seq (Fig. 4, Extended Data Figs 6–9, Extended Data Table 1). The single-cell mRNA-seq data was subjected to k-means clustering (Fig. 4b, Extended Data Fig. 7). The majority of ANT-treated cells were found in two clusters; the cells in the first cluster expressed bipolar and amacrine-specific genes (see Extended Data Fig. 7b), while cells in the second cluster expressed generic neural genes and progenitor genes. These cells formed separate clusters from the wild-type MG. The average expression for all Ascl1+ cells shows an increase in neural progenitor genes, and bipolar or amacrine cell genes compared to wild type (Fig. 4b). The ANT-treated cells also show a reduction in the expression of glial genes, when compared to wild type (Extended Data Figs 7, 9a, b).
Figure 4. ANT treatment enables epigenetic changes and expression of neuronal genes in MG.
a, FACS-purified MG-derived neurons subjected to genomic analyses. b, k-means clustering of single-cell RNA-seq from wild-type (WT) and ANT-treated cells shown as a t-SNE plot. Heat map showing average expression of neural genes for all Ascl1+ cells in the ANT condition (19 days post-TSA) compared with wild type. c, ATAC–seq-normalized reads shown for sample progenitor (Hes6), MG (Rlbp1) and neural (Nefl) genes. DNA accessibility changes with Ascl1 expression (arrows). Scale at the bottom track for each set (reads per million, RPM). ANT-treated mice 15 days post-TSA. d, Gene Ontology enrichment for regions of increased DNA accessibility in ANT-treated cells compared with wild type. Examples of the ‘Nervous system development’ category are shown to the right. e, The number of genes in enriched GO categories from MG expressing Ascl1, Ascl1 and TSA, and from ANT-treated retinas. f, Top 5 transcription factor motifs in peaks of ANT, but not wild type; percentage of peaks with motif and enrichment score. g, ATAC–seq peaks for ANT versus TSA and NMDA were compared; ANT-specific peaks analysed for motif enrichment and Gene Ontology. Two of the top ten GO enriched Biological Processes were chromatin-remodelling genes. h, i, Otx2 ChIP–seq peaks from total retina15, was compared with ATAC–seq from Grm6+ FACS-purified bipolar cells and the overlapping (bipolar-specific Otx2 peaks) regions intersected with the ANT peaks that were not present in the wild type (scale bar, 100 counts per million reads (CPM) for Otx2-ChIP and 10 CPM for ATAC–seq). j, Gene Ontology enrichment for Biological Process of peaks that overlap with ANT and bipolar cell Otx2 sites showing P value for term enrichment for neural genes.
The changes in gene expression in the ANT-treated cells were reflected in changes in DNA accessibility as shown by the ATAC–seq (Fig. 4c, Extended Data Fig. 8a). Overall, accessibility at glial genes was reduced, and accessibility at neural genes increased. Histone H3 K27 acetylation ChIP confirmed increased acetylation of this histone modification in the ANT-treated cells at E-box-containing promoters of neural genes (Extended Data Fig. 8b). Genome-wide analysis of accessible regions in the ANT-treated cells shows significant Gene Ontology (GO) enrichment (via GREAT14) at genes associated with nervous system development and neuron differentiation (Fig. 4d). The addition of TSA, or TSA and NMDA, leads to progressive increases in the number of accessible genes associated with neural development/differentiation (Fig. 4e), suggesting that the cumulative combination of factors is most effective in reprogramming the MG epigenome.
We next analysed the accessible regions from ANT-treated cells to look for increases in DNA accessibility relative to wild-type MG. Ascl1 was the top-scoring motif in the ANT-unique peaks relative to wild type (by HOMER), with Sox9, Foxo1, E2f3 and Otx2 also highly enriched (Fig. 4f). When the accessible regions from the ANT-treated cells were specifically compared with those treated with only TSA or only NMDA, we found a set of peaks unique to the ANT condition. Two of the top ten GO terms in ANT-specific peaks were associated with chromatin remodelling (Fig. 4g), suggesting that the combination of retinal injury and TSA might promote neuronal differentiation of Ascl1-overexpressing MG by increasing the expression of genes that further facilitate epigenome reorganization.
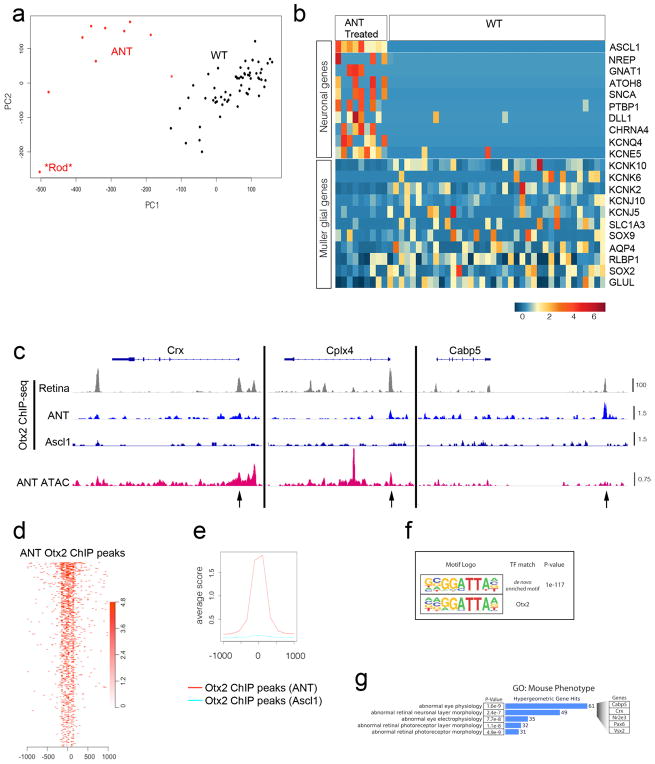
Otx2, a transcription factor required for bipolar neurons and photoreceptors, was among the top five enriched motifs in an analysis of the ANT peaks (Fig. 4f). To determine whether these were associated with cis-regulatory elements of retinal neurons, we FACS-purified bipolar cells from adult Grm6-tdTomato mice and carried out ATAC–seq. We compared Otx2 ChIP–seq data from whole retina15 with the ATAC–seq from bipolar cells to generate a set of bipolar Otx2 peaks (Fig. 4h, i). When we compare the bipolar Otx2 peaks with the newly accessible chromatin in the ANT-treated cells (peaks not in wild type), we find that the top categories enriched in GO (Biological Process) are in neural development and differentiation (Fig. 4j); we do not see a similar enrichment when we intersect bipolar Otx2 peaks with the ATAC–seq peaks of normal MG. Thus, we conclude that reprogramming MG to neurons with Ascl1, NMDA and TSA leads to more accessible chromatin at bipolar cell Otx2 sites. ChIP–seq for Otx2 in FACS-purified ANT-treated cells further confirm that the combination of TSA and retinal injury has allowed Otx2 to bind to promoters of retinal neuron cis-regulatory regions, partly explaining the mechanism by which this combination promotes neurogenesis (Extended Data Fig. 9c–g).
The combination of Ascl1 overexpression and TSA causes the MG to generate new inner retinal neurons after NMDA damage. It is not clear why bipolar cells are the predominant neurons generated, since NMDA primarily causes ganglion cell and amacrine death. There is some evidence that Ascl1 biases the retinal progenitor to a bipolar fate, though studies of Ascl1+ progenitor cells show all but retinal ganglion cells are in the lineage16. Alternatively, the microenvironment may favour inner retinal differentiation after inner retinal damage; future studies of mice with photoreceptor injury could test this hypothesis. Nevertheless, the fact that MG-derived neurons integrate into a mature circuit suggests that factors needed to support synaptogenesis continue to be expressed into adulthood in the mammalian retina.
Our results extend the findings of similar approaches being taken in other regions of the CNS. Astrocytes and NG2 cells can be reprogrammed to neurons by expressing proneural transcription factors in the cerebral cortical and subcortical regions17–20. Recordings from cortical slices and rabies-virus-based tracings indicate that these neurons are functional. Cellular reprogramming in vivo provides a unique opportunity to recruit the regenerative programs from regenerating organisms, such as zebrafish, for regenerative medicine21. Converting the resident glial cells in the CNS to neurons by cell-specific expression of transcription factors shows the potential for this approach in the nervous system22,23. The results in this report demonstrate the feasibility of this approach for potential clinical translation for retinal diseases.
METHODS
Data reporting
Animals were randomly assigned to groups. Investigators were blinded to treatment condition for all cell counts. No data points were excluded from analysis. The sample size was chosen based on pilot studies for >80% power (R).
Injections
Intraperitoneal injections of 100 μl of tamoxifen (Sigma) in corn oil were given to induce expression of Ascl1 and GFP. CreER induction for Glast and Rlbp1 animals is variable, but this did not correlate with a specific treatment. Tamoxifen was administered for 5 consecutive days at a concentration of 1.5 mg per 100 μl of corn oil. For proliferation studies, 100 μl of 1 μg μl−1 EdU (Invitrogen) in PBS was given intraperitoneally at the time of NMDA administration daily until eyes were collected for histology.
Intravitreal injections were performed on mice anaesthetized with isoflurane using a Hamilton syringe with 32-gauge needle (Hamilton). All intravitreal injections were given in 2-μl volumes. NMDA was injected at a concentration of 100 mM in PBS. Trichostatin-A (TSA) (Sigma) was injected at a concentration of 1 μg μl−1 in DMSO. Control animals were injected with an equal volume of vehicle.
For proliferation experiments, either 2 μl of mEGF (0.05 μg μl−1) and EdU (2.5 μg μl−1) in PBS or 2 μl of EdU (2.5 μg μl−1) in PBS was intravitreally injected for 3 consecutive days, 2 days after NMDA injections.
Immunohistochemistry (IHC)
For in vivo studies, animals were euthanized and the eyes removed for dissection and removal of the cornea and lens. Eye cups containing the retina were then fixed in 4% PFA in PBS for 1 h before being transferred to a 30% sucrose in PBS solution and kept overnight at 4 °C. Eyes were then frozen and stored at −80 °C in O.C.T. (Sakura Finetek) until being sectioned at 14–16 μm on a cryostat (Leica). Slides were incubated at room temperature in blocking solution (10% normal horse serum, 0.5% Triton X-100, in PBS) for 2 h. Slides were then washed three times in PBS for half an hour each before overnight incubation at 4 °C in primary antibody diluted in blocking solution. Slides were then washed three times in PBS for half an hour each before a 3 h incubation in secondary antibodies (Life Technologies) diluted in blocking solution with 1:100,000 DAPI (Sigma) in the dark. At this point, slides were washed three times in PBS for half an hour each and either coverslipped with Fluoromount-G (SouthernBiotech) or were stained for EdU with the Click-iT EdU Kit (Invitrogen), washed, then coverslipped. Primary antibodies: rabbit anti-Cabp5 (gift from F. Haeseleer, 1:500), rabbit anti-Pax6 (Convance, 1:300), rabbit anti-PSD95 (Abcam, 1:100), rabbit anti-Sox9 (Millipore, 1:300), mouse anti-Ctbp2 (BD Biosciences, 1:500), mouse anti-HuC/D (Invitrogen, 1:100), chicken anti-GFP (Abcam, 1:500), goat anti-Otx2 (R&D Systems, 1:100).
Microscopy and cell counts
Slides were imaged via confocal microscopy on either an Olympus FluoView FV1000 for cell counts, or a Zeiss LSM880 with Airyscan (voxel size = 0.0426 × 0.0426 × 0.185 μm) for high-resolution imaging and synaptic colocalization. For cell counts, 5 fields were imaged with a 20× objective at 2-μm-thick z-stacks and counts were averaged for each eye analysed.
For synaptic colocalization figures, the GFP channel was used to generate a mask of the neuronal processes (shown in Fig. 2i, and Extended Data Fig. 4e) using Amira image software (FEI). From within this mask, a more stringent GFP mask was generated, only highlighting the brightest pixels (not shown). This stringent mask was then applied to the Ctbp2 staining to show clear GFP-containing presynaptic ribbons.
For morphology panel shown in Fig. 1m, z-stacks were processed in Amira to mask around the cell’s soma and processes to generate clear examples of various MG-derived cell morphologies.
Western blotting
Whole retina was dissected and homogenized in a dounce homogenizer and histones isolated with the Histone Extraction Kit (ab113476, Abcam). Extracts were run on a 4–20% gel (Bio-Rad) before blotting. PVDF membranes (Bio-Rad) were then blocked overnight at 4 °C in a milk blocking solution (5% powdered milk, 0.5% Triton X-100, 0.1% NaN3 in PBS). Following three 30-min washes in a wash buffer (0.5% Tween in PBS), membranes were incubated with primary antibodies in milk blocking solution overnight at 4 °C. Membranes were then washed three times with wash buffer and incubated with at room temperature with 1:10,000 rabbit anti-HRP in TBS-T for 2 h. Following a final wash step, membranes were developed with SuperSignal West Dura Extended Duration Substrate (Thermo Scientific) and exposed on Autoradiography Film (Blue Devil West). All blots were scanned at 600 DPI and quantified in ImageJ (NIH, Bethesda, MD) by transforming the image to 8-bit format and quantifying the grey value via Uncalibrated OD in a region of interest drawn around histone bands.
Primary antibodies: rabbit anti-Histone H3 (Cell Signaling, 1:10,000), rabbit anti-H3K27ac (Abcam, 1:10,000).
Fluorescence-activated cell sorting
Retinas were dissected, isolated from vitreous humour and retinal pigment epithelium (RPE), and then washed in PBS. Retinas were confirmed to have expression of GFP or RFP via live imaging under an inverted fluorescent microscope (Zeiss) before dissociation. Retinas were then incubated on a nutator in Papain and DNase I for 20 min at 37 °C. Retinas were then triturated to generate a single-cell suspension and transferred to a tube containing Ovomucoid. The suspension was then spun down at 300g for 10 min at 4 °C. For Otx2 ChIP–seq, pellets were resuspended and fixed in 0.5% formaldehyde in PBS for 7 min at room temperature. After fixation, 1.25 M glycine was added to the suspension to quench fixation. Cells were passed through a 35 μm filter then sorted using a BD FACSAria III Cell Sorter (BD Biosciences). Gating was performed to isolate intact cells from debris and to isolate positive fluorescent MG-derived cells. Positive fractions containing fluorescently labelled MG were then spun down at 300g and either resuspended at appropriate concentrations for various assays or frozen at −80 °C for Otx2 ChIP–seq.
Single-cell mRNA sequencing
Three ANT-treated Glast-creER animals had their retinas pooled and were dissociated for FACS purification. Live purified cells were then pelleted at 300g for 10 min at 4 °C and resuspended in 0.04% BSA in PBS at a concentration of 2,000 cells per μl. Cells were then loaded onto the Single Cell 3′ Chip with a targeted cell recovery of 4,000 cells. For control animals, two Rlbp1-creER:tdTomato animals had their retinas pooled and were run in parallel at equal cell concentrations. GEM generation and barcoding, RT, cleanup, cDNA amplification, and library construction were performed according to the Chromium Single Cell 3′ Reagent Kits User Guide. Library QC was determined by TapeStation (Agilent Technologies). Single-cell libraries were sequenced on the Illumina NextSeq 500/550 v2 kit. Reads were processed in Cell Ranger (10x Genomics) and aligned to mm10 and aggregate filtered outputs (from the combined wild-type and ANT-treated libraries) were analysed in Loupe (10x Genomics) to generate PCA plots of t-SNE scores. Single-cell data shown in Fig. 4b is from this dataset.
Single-cell mRNA sequencing
Three ANT-treated Glast-creER animals had their retinas pooled and were dissociated for FACS purification. Live purified cells were then pelleted at 300g for 10 min at 4 °C and resuspended in neurobasal medium. A fraction of the resuspended cells were analysed on a Countess II FL Automated Cell Counter (Invitrogen) for quality control and to determine final cell density. Cells were loaded onto a 5–10 μm 96-well Fluidigm C1 IFC at a concentration of 400 cells μl−1. A separate group of two control Rlbp1-creER:tdTomato animals were run in parallel in a similar manner and were loaded onto a second IFC at a concentration of 1,400 cells μl−1. IFCs were imaged under a fluorescent microscope to visualize which capture sites contained GFP or RFP cells for the ANT-treated and control cells, respectively. Wells that contained intact GFP or RFP cells and were free of cellular debris were then chosen for sequencing. After selecting for wells that contained viable cells (as stated above) and for wells that had similarly high DNA concentrations, a total of 9 ANT-treated and 48 control cells were used for all analyses. Reads that passed Illumina’s base call quality filter were aligned to mm9 using TopHat v.2.1.0. Counts for each gene were generated using htseq-count v.0.6.1p1 in the ‘intersection-strict’ overlap mode. Raw reads were then processed using the Monocle suite in Bioconductor24. Data was analysed and presented using R.
Assay for transposase-accessible chromatin (ATAC) sequencing
Purified cells from live-cell FACS were input into a 15 μl transposase reaction25 with an input of 65,000 cells for wild type (Rlbp1-creER:tdTomato), 85,000 cells for tamoxifen only (Glast-creER Ascl1-overexpressing animals), 100,000 cells for tamoxifen + NMDA, 85,000 cells for tamoxifen + TSA, and 130,000 cells for ANT treatment. For Grm6-tdTomato mice, 100,000 cells were collected. Transposition was carried out with reagents from the Nextera DNA Sample prep kit: 7.5 μl 2X TD Buffer, 0.75 μl Tn5 Transposases, and nuclease-free water to 15 μl. The reaction was mixed and incubated at 37 °C for one hour before being purified with the Qiagen Reaction Cleanup Minelute kit and eluted into 10 μl. Samples were then amplified by PCR with Nextera primers (Nextera barcodes N701-N706) in a 50 μl reaction with 2× PCR master mix (NEB cat. no.: M0541) and 0.5 μl 100× SYBR Green I. PCR cycled as: (1) 72 °C, 5 min; (2) 98 °C, 30 s; (3) 98 °C, 10 s; (4) 63 °C, 30 s; (5) 72 °C, 1 min; (6) repeat (3)–(5) for 4 cycles. Libraries were then monitored with qPCR: 5 μL PCR sample in a 15 μl reaction with the same Nextera primers, NEB 2× PCR master mix and SYBR green. qPCR cycled as: (1) 98 °C, 30 s; (2) 98 °C, 10 s; (3) 63 °C, 30 s; (4) 72 °C, 1 min; (5) repeat 2–4 for 29 cycles. qPCR output was monitored for the ΔRN; 0.25 ΔRN cycle number was used to estimate the number of additional cycles of the PCR reaction needed for the remaining PCR samples. Wild type received 9 cycles; tamoxifen-only, 6 cycles; tamoxifen + NMDA, 12 cycles; tamox-ifen + TSA, 9 cycles; and ANT treatment, 6 cycles. Amplified libraries were purified with the Qiagen PCR cleanup minelute kit and eluted into 20 μl. Library QC was performed using gel electrophoresis. 6 μl of each library sample was run on a 5% Bio-Rad mini-Protean TBE Precast Gel in TBE. Gel was stained using 1×SYBR Gold in TBE for 30 min before imaging. Libraries were quantitated on a Qubit 3.0 Fluorometer with the dsDNA HS Assay kit and A260/280 and A260/230 checked by nanodrop before sending for Illumina NextGen sequencing on a HiSeq 2500 in rapid mode employing a paired-end 50 base read length sequencing strategy. Image analysis and base calling were performed using Illumina’s Real Time Analysis v.1.18 software, followed by ‘demultiplexing’ of indexed reads and generation of FASTQ files, using Illumina’s bcl2fastq Conversion Software v.1.8.4.
Reads were mapped using Bowtie. Files were downsampled to normalize for equivalent peaks across samples, using Samtools. Mapped reads for downsampled files were: wild type, 6,662,388; A+N 20,292,142; A+T, 4,154,220; A+N+ T, 16,146,406. Peaks were called using HOMER findPeaks histone style with a minimum distance of 415 and size of 150. Final peak call numbers were: wild type, 42,535; Ascl1, 41,345; A+N, 43;429; A+T, 42,599; A+N+T, 43,267. Bedops was used to compare peak files. Gene ontology was first analysed by the Genomic Regions Enrichment of Annotations Tool (GREAT) to get annotations of peak associations with genes. Gene lists were further filtered in R to enrich for those genes with the greatest changes in accessibility by selecting those genes with 5 or more associated peaks. Gene lists were analysed for ontology using G:profiler. Bam files were converted to bigwig files for track visualization, and loaded onto the Integrative Genomics View browser. Motif enrichment was performed with HOMER software using the findMotifs program with default parameters.
Chromatin immunoprecipitation
For Otx2 ChIP–seq, all cells from FACS purification were input into the respective ChIP reactions: 490,430 cells in ANT-treated condition and 692,271 cells in untreated condition. Post-FACS-purified cells were pelleted at 400g for 20 min and washed in PBS at 4 °C. Chromatin shearing by sonication was performed with a probe sonicator (Fisher Scientific ultrasonic dismembrator model 150e) with parameters: 12 pulses of 100 Joules, amplitude 35, offset of 45 s at 4 °C. 1,200 μl of sheared chromatin was divided into 2 ×500μl samples for anti-Otx2/IgG control IPs and 150 μl for input DNA controls. Immunoprecipitation was performed with 11 μl Protein-G-coated beads (DiaMag Protein-G-coated magnetic beads, Diagenode cat. no.: C03010021-150) and 2 μg goat anti-hOTX2 antibody (R&D Systems BAF1979) or 2 μg goat IgG (R&D Systems AB-108-C) per IP reaction according to LowCell# ChIP Kit (Diagenode). DNA was purified with phenol/chloroform/isoamyl-alcohol and resuspended in 30 μl of TE buffer.
Libraries were prepared from ChIP DNAs with the KAPA Hyper Library prep kit (KAPA Biosystems) using SeqCap Adapters (Roche-Nimblegen). Library size distributions were validated using the Agilent High Sensitivity D1000 ScreenTape run on an Agilent 2200 TapeStation (Agilent Technologies). Additional library QC, blending of pooled indexed libraries, and cluster optimization was performed using Life Technologies–Invitrogen Qubit 2.0 Fluorometer (Life Technologies–Invitrogen). ChIP–seq libraries were pooled (4-plex) and clustered onto a flow cell lane. Sequencing was performed using an Illumina HiSeq 2500 in rapid mode employing a paired-end, 50 base read length (PE50) sequencing strategy. Image analysis and base calling were be performed using Illumina’s Real Time Analysis v.1.18 software, followed by demultiplexing of indexed reads and generation of FASTQ files, using Illumina’s bcl2fastq Conversion Software v.1.8.4.
Paired end reads were aligned to mm9 using bowtie2 v.2.2.8 using default parameters. The number of aligned, mapped fragments were: Input-Ascl1, 18,967,599; Input-ANT, 27,060,224; Otx2-IP-Ascl1, 3,627,010; Otx2-IP-ANT, 5,917,349. Peak calling and motif enrichment was performed with HOMER software. Peaks were called using DNA input samples as controls with find-Peaks parameters: Tag Threshold = 4, fold threshold (L) = 3, and Poisson P value (LP) = 0.001. Motif enrichment used the findMotifs program with default parameters. Overlap analysis of Otx2 peaks and motifs was performed with Bedops26 using a 1 bp overlap requirement. Heat maps were generated with Bioconductor Genomation.
For H3K27ac ChIP-qPCR, FACS ANT (80,000 cells) and wild type (Rlbp1-creER:tdTomato, 100,000 cells) cells were digested with 0.5 U MNase in Digestion buffer (50 mM TrisHCl pH 7.5, 1 mM CaCl2, 0.2% Triton X-100, 1 × EDTA-free proteinase inhibitors) at 37 °C for 10 min before stopping with 5 mM EDTA. Digested chromatin was immunoprecipitated with rabbit anti-H3K27ac (Abcam, 3 μg per IP) as described previously27. Eluted DNA was run by qPCR for promoter regions of Hes5, Dll3, Nefl and HoxB2 (primers available upon request) and were run in triplicate. ΔΔCt between each sample and input was expressed as fold change 2ΔΔCt, then fold change was normalized for each gene to wild type = 100%.
Electrophysiology
Electrophysiology experiments were conducted in retinal slice (200 μm thick) preparations taken from dark-adapted mice. Retinas were isolated under infrared visualization and stored in oxygenated (95% O2/5% CO2) Ames medium (Sigma) at around 32–34 °C. Once under the microscope, tissue preparations were perfused by the same Ames solution at a rate of approximately 8 ml per min. Isolated retinas were embedded in agarose and sliced as previously described28,29. Retinal neurons were visualized and targeted for whole-cell recordings using video DIC with an infrared light source (>950 nm) and GFP-positive cells were targeted using two-photon (λ = 980 nm) or confocal (λ = 488 nm) microscopy. For all cells targeted under infrared illumination, a full-field illumination (diameter: 560 μm) was delivered to the preparation through a customized condenser from blue (peak power at 470 nm) or green (peak power at 510 nm) LEDs. Cells targeted using the visible 488 nm laser were primarily used for measurements of input resistance and resting membrane potential. Images shown are 2D projections of 3D image stacks acquired with a two-photon or confocal microscope.
Whole-cell recordings were obtained using pipettes (5–6 MΩ) filled with an intracellular solution containing (in mM): 123 K-aspartate, 10 KCl, 10 HEPES, 1 MgCl2, 1 CaCl2, 2 EGTA, 4 Mg-ATP, 0.5 Tris-GTP and 0.1 Alexa (594) hydrazide (approximately 280 mOsm; pH 7.2 with KOH). To isolate excitatory or inhibitory synaptic input, cells were held at the estimated reversal potential for inhibitory or excitatory input of approximately −60mV and +10 mV. Absolute voltage values were not corrected for liquid junction potentials (K+-based = −10.8 mV; Cs+-based = −8.5 mV). MG-derived GFP+ cells exhibited much higher input resistance than normal MG, characteristic of excitable cells near their resting potential; this would be expected to lead to the sizeable voltage changes in response to synaptic input that we observed.
Owing to technical limitations, we were not able to assess outputs of the GFP+ cells with the same methods. Many of the ganglion cells were destroyed by the NMDA, and to record from the approximately 20% that remain to confirm that they receive direct input from the MG-derived neurons would be technically challenging. Demonstrating direct MG-derived neuronal output onto a ganglion cell would require random patching onto ganglion cells downstream of the GFP+ processes with paired recording techniques on rare cell populations. Additionally, ensuring both cells are at a feasible recording depth within the retinal slice would compound the complexity of such an experiment.
Serial block-face scanning electron microscopy
Freshly dissected retinas were fixed in 4% glutaraldehyde in 0.1 M sodium cacodylate buffer (pH 7.4) for 30 min, then trimmed into 2 × 2 mm trapezoidal sections to maintain orientation. Sections were then coverslipped on a slide within an insert and imaged on a two-photon microscope with Ti:sapphire laser (Spectra-Physics) at 60× magnification. Once the cell of interest was located, a 50 ×50μm box was branded using the two-photon laser30 (near-infrared branding or NIRB) around the soma by increasing the laser power of the 880 nm beam and exposing the tissue to it for 5 s. Two notches were NIRBed in the x and y planes of the box that point to and demarcate the soma of the cell of interest. To localize the region containing the cell of interest before serial sectioning, a larger 100 ×100μm box was NIRBed above the cell in the ganglion cell layer. The issue was then stained, dehydrated, and embedded in Durcupan resin following a previously established protocol31. SBFSEM was performed on the Zeiss 3 View of a region of interest comprising 2 × 2 tiles, each 7,000 ×7,000 pixels (approximately 40 ×40μm) at a section thickness of 70 nm. Images were then aligned and the cell of interest was traced using TrackEM2 (NIH).
Statistics
All statistics for western blotting and IHC were performed on Prism GraphPad 5, or with R, version 3.2.3 ‘Wooden Christmas Tree’. The Shapiro–Wilks test (R) or Kolmogorov–Smirnov test (Prism) were used to determine normality. t-tests were two-tailed. Both t-tests and ANOVA were significant if P <0.05. Primary findings shown in Fig. 1 were repeated five times in separate cohorts of animals.
Animals
All mice were housed at the University of Washington and treated with protocols approved by the University of Washington’s Institutional Animal Care and Use Committee. Mice expressed Cre-recombinase under one of two different promoters (Rlbp1-creER from E. Levine (Vanderbilt University) and Glast-creER from Jackson Labs) and mice with Rosa-flox-stop-tTA (Jackson labs) have been previously described. tetO-mAscl1-ires-GFP mice were a gift from M. Nakafuku (University of Cincinnati). Grm6-tdTomato mice have been previously described32. Adult mice of both sexes were used for this study and analysed together in their respective treatment groups.
Data availability
Otx2 ChIP–seq, ATAC–seq, and single-cell mRNA-seq data has been deposited at the NCBI SRA under accession number SRP108524.
Extended Data
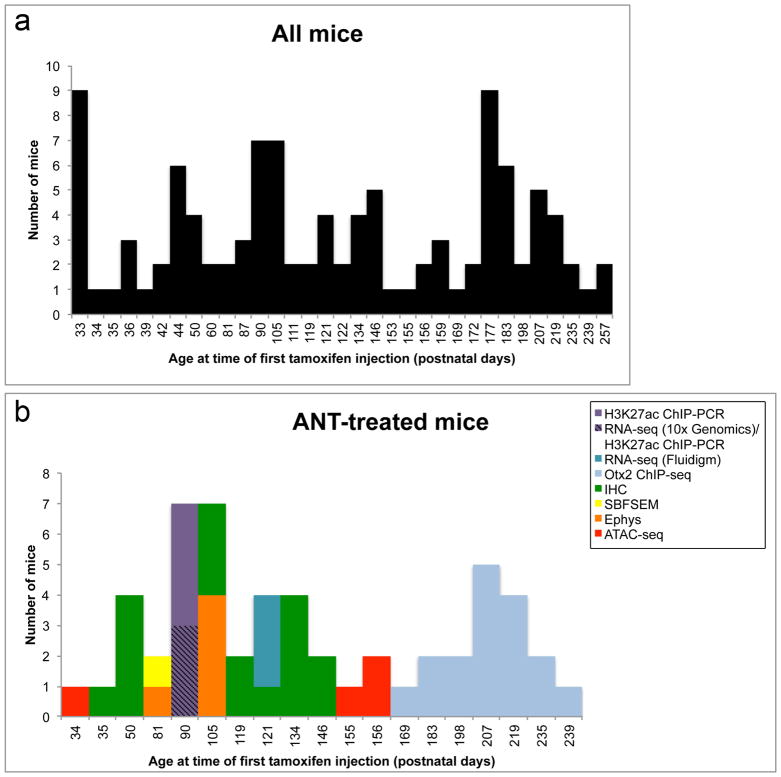
Extended Data Figure 1. Animal age and numbers used in study.
a, Histogram showing ages at which all Glast-creER and Rlbp1-creER mice used for the study received their first tamoxifen injection. There were 108 Glast-creER and Rlbp1-creER mice used for the study (122.7 ± 64.1 days, mean postnatal age ±s.d.). b, Histogram showing ages at which all ANT-treated mice used for the study received their first tamoxifen injection. There were 54 ANT-treated mice used for the study (136.4 ± 57.8 days, mean postnatal age ± s.d.). ANT-treated mice are classified according to experimental assay (H3K27ac ChIP-PCR; RNA-seq (10x Genomics)/H3K27ac ChIP-PCR, cells from these mice were split for both assays; RNA-seq (Fluidigm), single-cell RNA-seq; Otx2 ChIP–seq; IHC, immunohistochemistry; SBFSEM, serial block-face scanning electron microscopy; Ephys, whole-cell electrophysiology; ATAC–seq).
Extended Data Figure 2. TSA increases histone acetylation.
a, Western blot for H3K27ac and H3 24 h after TSA or DMSO intravitreal injection. b, Graph shows TSA significantly increases H3K27ac relative to H3 by unpaired t-test at **P = 0.0033, n = 5 per group. c, Graph showing the percentage of GFP+ cells that express Otx2 in various conditions in Rlbp1-creER animals. Numbers were similar to Glast-creER animals, showing no Otx2 in control mice lacking Ascl1 and approximately 36% of GFP+ cells expressing Otx2 when all three factors were present. Data were analysed by one-way ANOVA with Tukey’s post hoc test. d, Graph showing the percentage of GFP+ cells that express Sox9 in various conditions in Glast-creER and Rlbp1-creER animals. A significant reduction in the number of cells expressing Sox9 was seen by one-way ANOVA with Tukey’s post hoc test at *P <0.05, **P <0.01, ***P < 0.001 when animals expressing Ascl1 were treated with NMDA and TSA. Data in b–d are shown as mean ±standard error. e, Graph showing the percentage of ANT-treated GFP+ cells that express Otx2 is not significantly different with age by Student’s t-test (n = 4 and 11 mice for 7 weeks and 15–21 weeks, respectively). Data in e is shown as mean ±s.d.
Extended Data Figure 3. Neurogenesis and proliferation from Ascl1-expressing MG.
a, Panel of images showing morphologies between MG and neurons. Images are from retinas that were collected 2–5 weeks post-TSA. Examples of ‘hybrid’ morphologies were observed at all post-TSA time points analysed. First image of panel has normal glial morphology for comparison. b, Example of EdU-labelled GFP+Otx2+ MG in ONL; cells stained with all three markers were very rare: <1% of GFP+ MG (approximately 1 cell per retinal section from 3 mice). c, Diagram showing experimental treatment paradigm for proliferation analysis. d, Ascl1-overexpressing mice treated with mouse epidermal growth factor (mEGF) and NMDA showed examples of Sox9+EdU+ MG. e, Majority of MG did not label with EdU when Ascl1-overexpressing mice only received intravitreal EdU injections (No Treatment). f, Graph showing the percentage of GFP+ cells expressing Sox9 and that were labelled with EdU. A significant increase in Sox9+EdU+ MG was seen when treated with NMDA and mEGF by Student’s t-test at **P = 0.0033, n = 5 per group. g, Ascl1-overexpressing mice treated with mEGF and NMDA showed examples of Otx2+EdU+ MG. h, Ascl1-overexpressing mice only receiving intravitreal EdU injections (No Treatment) had no MG that expressed Otx2 and labelled with EdU. i, Graph showing the percentage of GFP+ cells that express Otx2 and were labelled with EdU. A significant increase in Otx2+EdU+ MG was seen when treated with NMDA and mEGF by Student’s t test at *P = 0.0105, n = 5 per group. All data are shown as mean ± standard error, all scale bars are 10 μm.
Extended Data Figure 4. MG-derived neurons form synaptic specializations in IPL.
a, Confocal images of MG-derived bipolar-like cells with processes in IPL (scale bars, 10 μm). b, Super-resolution Zeiss Airyscan raw images of white boxes from a showing IPL processes stained with presynaptic ribbon marker CtBP2 (Ribeye, white) and postsynaptic marker PSD95 (magenta). c, Images from b masked in Amira to show presynaptic CtBP2 within GFP processes. d, Images of masked presynaptic CtBP2 staining apposed to postsynaptic PSD95 staining. e, Images of masks that were traced in Amira around GFP processes in IPL (scale bars, 10 μm). f, Images of masked CtBP2 staining that is within GFP processes. g, Images of CtBP2 superposed with PSD95 staining from c (white arrows) rotated in xz plane (scale bars, 1 μm). Images are from retinas that were collected 11 days post-TSA.
Extended Data Figure 5. MG-derived GFP+ cells exhibit diverse morphologies.
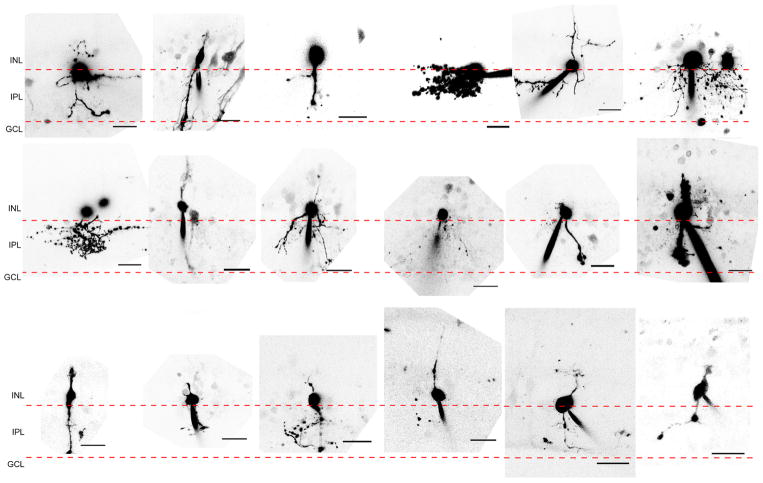
Panel of images showing 2D projections of GFP+ cells imaged post-recording (scale bars, 20 μm).
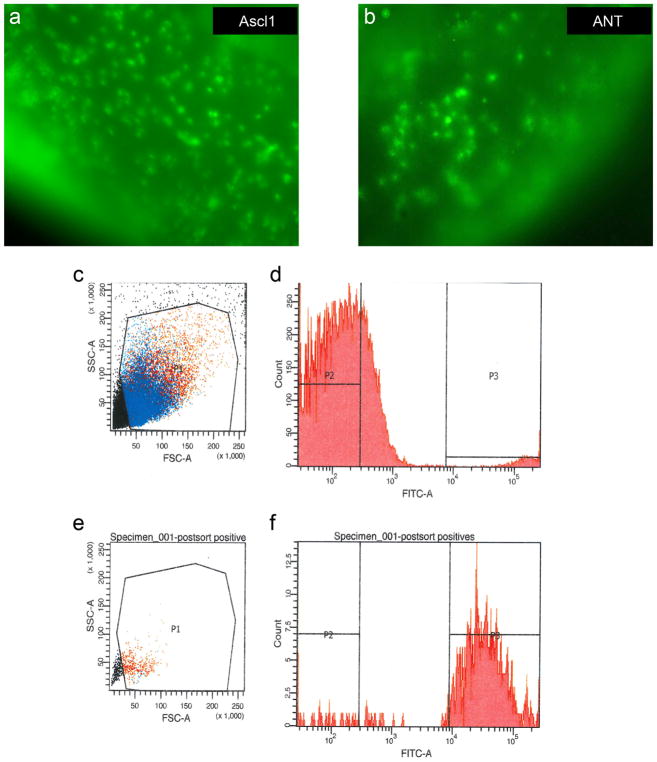
Extended Data Figure 6. FACS purification of GFP+ cells.
a, b, Live imaging of Ascl1-overexpressing retinas either untreated (a) or ANT-treated (b) before dissociation and FACS purification. c, Representative graph shows gating (P1 gate = viable cells) for viable cells from non-viable cells and debris. d, Gating P1 fraction for GFP fluorescence (P3 gate = GFP+ fraction). e, f, Post-sort on P3 fraction shows majority of GFP+ cells (88.7%) are viable after sorting.
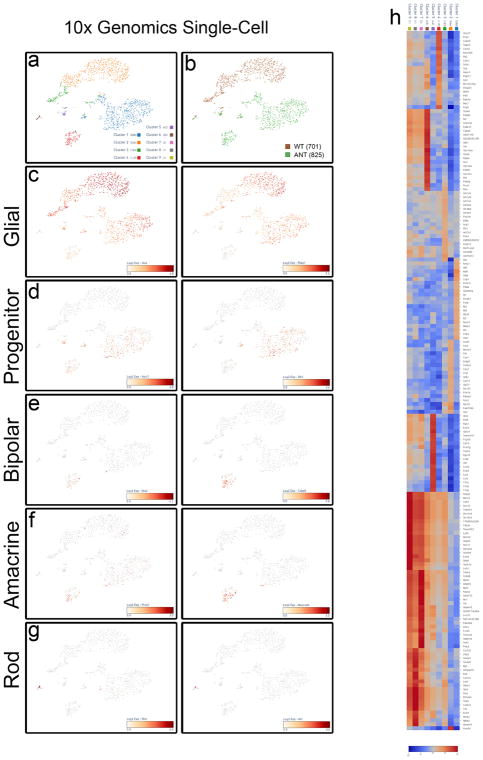
Extended Data Figure 7. ANT treatment results in MG-derived bipolar/amacrine-like cell cluster.
a, Principal component analyses of 10x Genomics single-cell RNA-seq from aggregate wild-type and ANT-treated cells showing k-means clustering. b, Clusters identifying wild-type (brown, 701 cells) and ANT-treated (green, 825 cells) cells. c, Plots showing expression levels of glial genes Glul and Rlbp1. Expression of glial genes is reduced in the ANT-treated cells and further reduced in the MG-derived bipolar/amacrine-like cells. d, Plots showing expression levels of progenitor genes Ascl1 and Dll1. Ascl1 expression was only seen in ANT-treated cells. Dll1 appears to be increased in the large ANT-treated cluster but decreased in the bipolar/amacrine-like cluster. e, Plots showing expression levels of bipolar genes Otx2 and Cabp5. Both genes are enriched in the bipolar/amacrine-like cluster. f, Plots showing expression levels for amacrine genes Prox1 and Neurod4. Both genes are enriched in the bipolar/amacrine-like cluster. g, Plots showing expression levels for rod genes Rho and Nrl. Rod contamination shows enrichment for both genes in small cluster. h, Heat map of top 20 upregulated and differentially expressed genes for each cluster (scale, log2 fold change). Single-cell data are from retinas that were collected from ANT-treated mice 19 days post-TSA.
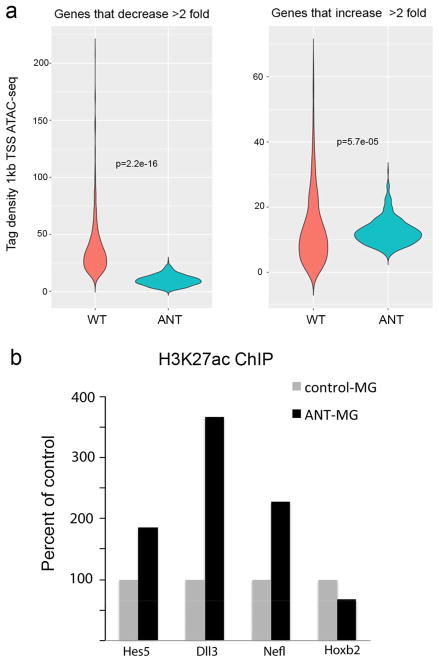
Extended Data Figure 8. Epigenetic changes in MG-derived neurons.
a, Violin plots of ATAC–seq tag density in the region 1 kb upstream of the promoters of genes that either decrease by twofold or increase by twofold between the wild-type and ANT-reprogrammed MG to show that the changes in gene expression are accompanied by changes in DNA accessibility during reprogramming with Ascl1, NMDA and TSA. The changes in gene expression were taken from the average of all Ascl1+ cells in the single-cell RNA-seq data from the Fluidigm data and compared with the wild-type MG from the same dataset. Notably, many progenitor genes, like Hes6 and Ascl1, show chromatin accessibility at putative cis-regulatory regions in all treatment conditions (including wild type) even though these genes are not normally expressed in the mature retina. b, H3K27ac ChIP was carried out on FACS-purified ANT-reprogrammed MG and wild-type MG. The data are shown as a per cent of control for three neural genes that show increases in expression and a control gene (Hoxb2) that does not change with ANT treatment. There was a substantial increase in H3K27ac for each of the genes tested. ChIP-PCR data are from ANT-treated retinas that were collected 19 days post-TSA.
Extended Data Figure 9. FACS-purified ANT-treated cells show increased neuronal gene expression and Otx2 binding.
a, Principal component analysis from Fluidigm single-cell mRNA-seq showing 48 wild-type MG (black), 9 ANT-treated cells (red), and 1 cell that was probably a contaminating rod photoreceptor (asterisk). The ANT-treated cells formed a separate cluster from the wild-type MG. b, Heat map showing ANT-treated MG-derived cells and wild-type MG. Each column is an individual cell, with example neural and glial genes as rows. Reprogramming with ANT leads to downregulation of glial genes and an increase in neural genes. Scale is log2(CPM). ANT-treated retinas were collected 46 days post-TSA. c, IGV browser tracks at bipolar genes Crx, Cplx4 and Cabp5 showing: Otx2 ChIP–seq from whole adult mouse retina15 (grey); Otx2 ChIP–seq from FACS-purified ANT-treated and Ascl1-only cells (blue); and DNA accessibility from ATAC–seq of FACS-purified ANT-treated cells (red). Scale for all tracks shown to the right as reads per million. Black arrows mark open chromatin in promoter regions that are bound by Otx2 in ANT-treated but not control Ascl1 cells, and are appropriate regions of binding based on a whole-retina Otx2 ChIP–seq dataset. d, e, Otx2 ChIP–seq peaks from ANT-treated cells show central enrichment at Otx2 ChIP–seq sites from whole adult retina15, but this is not present in the Otx2 ChIP–seq from MG that expressed Ascl1 but received none of the other treatments (TSA, NMDA). f, Top-scoring transcription factor binding motif enrichment (HOMER software suite) from ANT-treated Otx2 ChIP–seq peak calls along with the closest matching transcription factor motif (TF match) and P value for de novo motif enrichment. g, Gene Ontology enrichment for category ‘Mouse Phenotype’ of peaks from d, showing P value for term enrichment, the number of associated genes (blue bars), and example genes from these enriched terms (expanded at right). ChIP–seq was performed on 490,430 and 692,271 pooled cells from 17 ANT-treated Rlbp1-Ascl1 and 15 untreated Rlbp1-Ascl1 mice, respectively. Retinas were collected 9–18 days post-TSA.
Extended Data Table 1.
Table summary of all FACS-purified retinas
| Analysis | Mouse Strain | Treatment | # retinas | # positive cells (P3) | % of total P1 cells | % of total events |
|---|---|---|---|---|---|---|
| Otx2 ChIP-seq | Rlbp-Ascl1 | ANT | 34 | 490,430 | 0.7 | 0.4 |
| Otx2 ChIP-seq | Rlbp-Ascl1 | Ascl1 | 30 | 692,271 | 1.6 | 0.8 |
| H3K27ac ChIP-PCR | Glast-Ascl1 | ANT | 8 | 50,000 | 0.5 | 0.2 |
| Single cell mRNA-seq (10x)/H3K27ac ChIP-PCR | Glast-Ascl1 | ANT | 6 | 50,000 | 1.4 | 0.8 |
| Single cell mRNA-seq (10x)/H3K27ac ChIP-PCR | Rlbp-tdTomato | WT | 4 | 125,000 | 5.3 | 1.7 |
| Single cell mRNA-seq (Fluidigm) | Glast-Ascl1 | ANT | 6 | 18,000 | 0.6 | 0.2 |
| Single cell mRNA-seq (Fluidigm) | Rlbp-tdTomato | WT | 4 | 140,000 | 6.0 | 1.3 |
| ATAC-seq | Glast-Ascl1 | ANT | 4 | 130,000 | 1.2 | 0.4 |
| ATAC-seq | Glast-Ascl1 | TSA | 2 | 85,000 | 2.6 | 0.6 |
| ATAC-seq | Glast-Ascl1 | NMDA | 4 | 100,000 | 2.3 | 0.6 |
| ATAC-seq | Glast-Ascl1 | Ascl1 | 4 | 85,000 | 0.7 | 0.3 |
| ATAC-seq | Rlbp-tdTomato | WT | 6 | 65,000 | 2.4 | 0.7 |
Supplementary Material
Acknowledgments
The authors acknowledge the following funding sources for support of this work. NIH NEI 1R01EY021482 to T.A.R., EY14358 to R.O.W., Howard Hughes Medical Institute to F.R., Allen Distinguished Investigator award (Paul G. Allen Family Foundation) to T.A.R., F.R. and R.O.W., an NSF Fellowship to M.W. (DGE-0718124), a Cellular and Molecular Biology Training Grant (T32GM007270) to L.S.V., and the Vision Core Grant P30EY01730 for use of the imaging facilities. We thank members of the Reh and Bermingham-McDonogh laboratories for valuable discussion and technical advice. We thank O. Bermingham-McDonogh for constructive comments on the manuscript. We thank A. Wills and A. Chitsazan for their ATAC–seq protocol and data analytics suggestions. We thank J. Delrow, C. Bennett and A. Berger at the Fred Hutch Genomics Shared Resource and Flow Cytometry facilities for their contributions to our sequencing datasets. We thank the laboratory of R. D. Hawkins for the cChIP reagents and protocol (H3K27ac ChIP). We thank the laboratory of C. Trapnell, specifically D. Jackson and R. Chawla, for their help generating the 10× Genomics single-cell RNA-seq datasets. Lastly, the authors thank E. Levine (Vanderbilt University) for the Rlbp1-creER mouse line and M. Nakafuku (Cincinnati Children’s) for the tetO-Ascl1-GFP mice.
Footnotes
Online Content Methods, along with any additional Extended Data display items and Source Data, are available in the online version of the paper; references unique to these sections appear only in the online paper.
Supplementary Information is available in the online version of the paper.
Author Contributions N.L.J. and T.A.R. designed and conceived the experiments. N.L.J. performed all injections, immunohistochemistry, imaging, western blots and cell reconstructions. T.Y. and R.O.W. prepared samples for SBFSEM and provided guidance for cell reconstructions and synaptic staining. W.N.G. and F.R. performed all electrophysiological recordings. S.G.W. performed FACS on retinas for ChIP and single-cell mRNA-seq. M.S.W. designed and conceived the experiments and performed Otx2 ChIP–seq and analysis. ATAC–seq and H3K27ac ChIP data was generated by L.S.V. and analysed by L.S.V. and T.A.R. All other figures and text were prepared by N.L.J. and T.A.R. with feedback and contributions from all authors.
The authors declare no competing financial interests.
Readers are welcome to comment on the online version of the paper.
Publisher’s note: Springer Nature remains neutral with regard to jurisdictional claims in published maps and institutional affiliations.
Reviewer Information Nature thanks Z. He, H. Song and the other anonymous reviewer(s) for their contribution to the peer review of this work.
References
- 1.Fischer AJ, Reh TA. Müller glia are a potential source of neural regeneration in the postnatal chicken retina. Nat Neurosci. 2001;4:247–252. doi: 10.1038/85090. [DOI] [PubMed] [Google Scholar]
- 2.Raymond PA, Barthel LK, Bernardos RL, Perkowski JJ. Molecular characterization of retinal stem cells and their niches in adult zebrafish. BMC Dev Biol. 2006;6:36. doi: 10.1186/1471-213X-6-36. [DOI] [PMC free article] [PubMed] [Google Scholar]
- 3.Fausett BV, Goldman D. A role for alpha1 tubulin-expressing Müller glia in regeneration of the injured zebrafish retina. J Neurosci. 2006;26:6303–6313. doi: 10.1523/JNEUROSCI.0332-06.2006. [DOI] [PMC free article] [PubMed] [Google Scholar]
- 4.Wan J, Goldman D. Retina regeneration in zebrafish. Curr Opin Genet Dev. 2016;40:41–47. doi: 10.1016/j.gde.2016.05.009. [DOI] [PMC free article] [PubMed] [Google Scholar]
- 5.Thummel R, Kassen SC, Montgomery JE, Enright JM, Hyde DR. Inhibition of Müller glial cell division blocks regeneration of the light-damaged zebrafish retina. Dev Neurobiol. 2008;68:392–408. doi: 10.1002/dneu.20596. [DOI] [PMC free article] [PubMed] [Google Scholar]
- 6.Lenkowski JR, Raymond PA. Müller glia: stem cells for generation and regeneration of retinal neurons in teleost fish. Prog Retin Eye Res. 2014;40:94–123. doi: 10.1016/j.preteyeres.2013.12.007. [DOI] [PMC free article] [PubMed] [Google Scholar]
- 7.Fausett BV, Gumerson JD, Goldman D. The proneural basic helix-loop-helix gene ascl1a is required for retina regeneration. J Neurosci. 2008;28:1109–1117. doi: 10.1523/JNEUROSCI.4853-07.2008. [DOI] [PMC free article] [PubMed] [Google Scholar]
- 8.Ramachandran R, Fausett BV, Goldman D. Ascl1a regulates Müller glia dedifferentiation and retinal regeneration through a Lin-28-dependent, let-7 microRNA signalling pathway. Nat Cell Biol. 2010;12:1101–1107. doi: 10.1038/ncb2115. [DOI] [PMC free article] [PubMed] [Google Scholar]
- 9.Karl MO, Reh TA. Regenerative medicine for retinal diseases: activating endogenous repair mechanisms. Trends Mol Med. 2010;16:193–202. doi: 10.1016/j.molmed.2010.02.003. [DOI] [PMC free article] [PubMed] [Google Scholar]
- 10.Pollak J, et al. ASCL1 reprograms mouse Muller glia into neurogenic retinal progenitors. Development. 2013;140:2619–2631. doi: 10.1242/dev.091355. [DOI] [PMC free article] [PubMed] [Google Scholar]
- 11.Ueki Y, et al. Transgenic expression of the proneural transcription factor Ascl1 in Müller glia stimulates retinal regeneration in young mice. Proc Natl Acad Sci USA. 2015;112:13717–13722. doi: 10.1073/pnas.1510595112. [DOI] [PMC free article] [PubMed] [Google Scholar]
- 12.Biedermann B, Bringmann A, Reichenbach A. High-affinity GABA uptake in retinal glial (Müller) cells of the guinea pig: electrophysiological characterization, immunohistochemical localization, and modeling of efficiency. Glia. 2002;39:217–228. doi: 10.1002/glia.10097. [DOI] [PubMed] [Google Scholar]
- 13.Newman EA. Physiological properties and possible functions of Muller cells. Neurosci Res Suppl. 1986;4:S209–S220. doi: 10.1016/0168-0102(86)90084-2. [DOI] [PubMed] [Google Scholar]
- 14.McLean CY, et al. GREAT improves functional interpretation of cis-regulatory regions. Nat Biotechnol. 2010;28:495–501. doi: 10.1038/nbt.1630. [DOI] [PMC free article] [PubMed] [Google Scholar]
- 15.Samuel A, Housset M, Fant B, Lamonerie T. Otx2 ChIP–seq reveals unique and redundant functions in the mature mouse retina. PLoS One. 2014;9:e89110. doi: 10.1371/journal.pone.0089110. [DOI] [PMC free article] [PubMed] [Google Scholar]
- 16.Brzezinski JA, IV, Kim EJ, Johnson JE, Reh TA. Ascl1 expression defines a subpopulation of lineage-restricted progenitors in the mammalian retina. Development. 2011;138:3519–3531. doi: 10.1242/dev.064006. [DOI] [PMC free article] [PubMed] [Google Scholar]
- 17.Guo Z, et al. In vivo direct reprogramming of reactive glial cells into functional neurons after brain injury and in an Alzheimer’s disease model. Cell Stem Cell. 2014;14:188–202. doi: 10.1016/j.stem.2013.12.001. [DOI] [PMC free article] [PubMed] [Google Scholar]
- 18.Liu Y, et al. Ascl1 converts dorsal midbrain astrocytes into functional neurons in vivo. J Neurosci. 2015;35:9336–9355. doi: 10.1523/JNEUROSCI.3975-14.2015. [DOI] [PMC free article] [PubMed] [Google Scholar]
- 19.Niu W, et al. SOX2 reprograms resident astrocytes into neural progenitors in the adult brain. Stem Cell Reports. 2015;4:780–794. doi: 10.1016/j.stemcr.2015.03.006. [DOI] [PMC free article] [PubMed] [Google Scholar]
- 20.Torper O, et al. In vivo reprogramming of striatal NG2 glia into functional neurons that integrate into local host circuitry. Cell Reports. 2015;12:474–481. doi: 10.1016/j.celrep.2015.06.040. [DOI] [PMC free article] [PubMed] [Google Scholar]
- 21.Srivastava D, DeWitt N. In vivo cellular reprogramming: the next generation. Cell. 2016;166:1386–1396. doi: 10.1016/j.cell.2016.08.055. [DOI] [PMC free article] [PubMed] [Google Scholar]
- 22.Götz M, Sirko S, Beckers J, Irmler M. Reactive astrocytes as neural stem or progenitor cells: in vivo lineage, in vitro potential, and genome-wide expression analysis. Glia. 2015;63:1452–1468. doi: 10.1002/glia.22850. [DOI] [PMC free article] [PubMed] [Google Scholar]
- 23.Heinrich C, Spagnoli FM, Berninger B. In vivo reprogramming for tissue repair. Nat Cell Biol. 2015;17:204–211. doi: 10.1038/ncb3108. [DOI] [PubMed] [Google Scholar]
- 24.Trapnell C, et al. The dynamics and regulators of cell fate decisions are revealed by pseudotemporal ordering of single cells. Nat Biotechnol. 2014;32:381–386. doi: 10.1038/nbt.2859. [DOI] [PMC free article] [PubMed] [Google Scholar]
- 25.Buenrostro JD, Giresi PG, Zaba LC, Chang HY, Greenleaf WJ. Transposition of native chromatin for fast and sensitive epigenomic profiling of open chromatin, DNA-binding proteins and nucleosome position. Nat Methods. 2013;10:1213–1218. doi: 10.1038/nmeth.2688. [DOI] [PMC free article] [PubMed] [Google Scholar]
- 26.Neph S, et al. BEDOPS: high-performance genomic feature operations. Bioinformatics. 2012;28:1919–1920. doi: 10.1093/bioinformatics/bts277. [DOI] [PMC free article] [PubMed] [Google Scholar]
- 27.Valensisi C, Liao JL, Andrus C, Battle SL, Hawkins RD. cChIP–seq: a robust small-scale method for investigation of histone modifications. BMC Genomics. 2015;16:1083. doi: 10.1186/s12864-015-2285-7. [DOI] [PMC free article] [PubMed] [Google Scholar]
- 28.Dunn FA, Doan T, Sampath AP, Rieke F. Controlling the gain of rod-mediated signals in the mammalian retina. J Neurosci. 2006;26:3959–3970. doi: 10.1523/JNEUROSCI.5148-05.2006. [DOI] [PMC free article] [PubMed] [Google Scholar]
- 29.Murphy GJ, Rieke F. Network variability limits stimulus-evoked spike timing precision in retinal ganglion cells. Neuron. 2006;52:511–524. doi: 10.1016/j.neuron.2006.09.014. [DOI] [PMC free article] [PubMed] [Google Scholar]
- 30.Bishop D, et al. Near-infrared branding efficiently correlates light and electron microscopy. Nat Methods. 2011;8:568–570. doi: 10.1038/nmeth.1622. [DOI] [PubMed] [Google Scholar]
- 31.Della Santina L, et al. Glutamatergic monopolar interneurons provide a novel pathway of excitation in the mouse retina. Curr Biol. 2016;26:2070–2077. doi: 10.1016/j.cub.2016.06.016. [DOI] [PMC free article] [PubMed] [Google Scholar]
- 32.Kerschensteiner D, Morgan JL, Parker ED, Lewis RM, Wong RO. Neurotransmission selectively regulates synapse formation in parallel circuits in vivo. Nature. 2009;460:1016–1020. doi: 10.1038/nature08236. [DOI] [PMC free article] [PubMed] [Google Scholar]
Associated Data
This section collects any data citations, data availability statements, or supplementary materials included in this article.
Supplementary Materials
Data Availability Statement
Otx2 ChIP–seq, ATAC–seq, and single-cell mRNA-seq data has been deposited at the NCBI SRA under accession number SRP108524.


