Abstract
Study Objectives:
Severities of obstructive sleep apnea (OSA) estimated both for the overall sleep duration and for the time spent in rapid eye movement (REM) and non-rapid eye movement (NREM) sleep are important in managing the disease. The objective of this study is to investigate a method by which snore sounds can be analyzed to detect the presence of OSA in NREM and REM sleep.
Methods:
Using bedside microphones, snoring and breathing-related sounds were acquired from 91 patients with OSA (35 females and 56 males) undergoing routine diagnostic polysomnography studies. A previously developed automated mathematical algorithm was applied to label each snore sound as belonging to either NREM or REM sleep. The snore sounds were then used to compute a set of mathematical features characteristic to OSA and to train a logistic regression model (LRM) to classify patients into an OSA or non-OSA category in each sleep state. The performance of the LRM was estimated using a leave-one-patient-out cross-validation technique within the entire dataset. We used the polysomnography-based diagnosis as our reference method.
Results:
The models achieved 80% to 86% accuracy for detecting OSA in NREM sleep and 82% to 85% in REM sleep. When separate models were developed for females and males, the accuracy for detecting OSA in NREM sleep was 91% in females and 88% to 89% in males. Accuracy for detecting OSA in REM sleep was 88% to 91% in females and 89% to 91% in males.
Conclusions:
Snore sounds carry sufficient information to detect the presence of OSA during NREM and REM sleep. Because the methods used include technology that is fully automated and sensors that do not have a physical connection to the patient, it has potential for OSA screening in the home environment. The accuracy of the method can be improved by developing sex-specific models.
Citation:
Akhter S, Abeyratne UR, Swarnkar V, Hukins C. Snore sound analysis can detect the presence of obstructive sleep apnea specific to NREM or REM sleep. J Clin Sleep Med. 2018;14(6):991–1003.
Keywords: NREM, OSA, REM, snoring
BRIEF SUMMARY
Current Knowledge/Study Rationale: Snoring is a symptom of obstructive sleep apnea (OSA) that can potentially be linked to NREM and REM sleep as well as upper airway collapse in patients with OSA. In this study, we test whether the analysis of snoring and breathing-related sounds can accurately identify OSA during REM and NREM sleep.
Study Impact: This study demonstrates that snoring sound can be used to estimate the presence of OSA, specific to NREM or REM sleep, at high accuracy. The noninvasive, fully automated, and low-cost nature of the technology holds promise as a potential tool for screening of the disease.
INTRODUCTION
Obstructive sleep apnea (OSA) is a prevalent sleep disorder in which breathing ceases due to frequent upper airway collapse. It causes oxygen desaturation and arousal, which disrupts normal sleep. A complete closure of the upper airway is called apnea, whereas a partial closure is called hypopnea.1 The average number of apnea and hypopnea events per night is used to derive an apnea-hypopnea index (AHI). Patients with OSA have increased risk for the development of cardiovascular diseases, stroke, diabetes, neurocognitive deficits, excessive daytime sleepiness, depression, and mood disorder.2
The current standard for OSA diagnosis is clinical polysomnography (PSG), where the patient undergoes overnight in-facility monitoring of more than 20 physiological signals. An expert sleep technician is required to apply complex and subjective scoring rules on signals to identify apnea and hypopnea events and calculate AHI. PSG classifies sleep into two broad categories: rapid eye movement (REM) and non-rapid eye movement (NREM) sleep. NREM comprises most normal sleep (with a 3:1 ratio for NREM: REM). Although NREM dominates the early hours of sleep cycles, REM periods get longer toward the end. PSG computes both the overall AHI and the AHI in NREM and REM sleep to assess the OSA in detail.1
Although the required amount of apnea and hypopnea events to diagnose OSA can be found both in NREM and REM sleep stages, growing evidence from literature indicates that events during REM sleep are important clinical entities for consideration. Apneas and hypopneas in REM sleep have been found to be linked with nondipping of nocturnal blood pressure (BP)3 and incident hypertension,4,5 whereas unrecognized OSA (ie, patient categorized as no OSA because the overall AHI < 10 events/h, but the AHI in REM sleep ≥ 20 events/h) has an independent association with hypertension.6 Hypertension (ie, BP ≥ 140/90 mmHg) in individuals carries the risk of the development of cardiovascular diseases. Based on a 10-year prediction model using the Framingham dataset, BP exceeding the high normal rate (≥ 130/85 mmHg) is singularly attributable to almost 30% of coronary heart disease in adults.7 Inhibition of neuronal input to the hypoglossal nerve results in a reduction of genioglossal and pharyngeal muscle tone in REM sleep,8,9 thus increasing the propensity of severe upper airway collapse during REM sleep (prolonged apneas and hypopneas with minimum SpO210,11 and greater fluctuations in BP12). In addition, increased sympathetic activity and hemodynamic control (such as increased BP and heart rate) in REM sleep13,14 may result in increased cardiac afterload and trigger ischemic events in patients with vascular disease. Hence, it is important to identify the overall AHI as well as the AHI in NREM and REM sleep for better diagnosis and management of OSA.
Because of the increasing demand for OSA screening and inherent limitations of PSG as an OSA screening method, there is growing interest in alternative approaches to screening, such as portable monitoring. Portable monitoring devices measure varying numbers of physiological signals—from only one or two to as many as in-laboratory monitoring. According to a review on the home diagnosis of sleep apnea,15 portable monitors are classified into four types: type 1 incorporates standard PSG, type 2 uses both sleep stages and respiratory measures with at least seven channels, type 3 and type 4 use only respiratory measures (at least three respiratory channels in type 3 and at least one respiratory channel in type 4) without any provisions for sleep stages. Although clinical PSG provides OSA severity through overall AHI and its possible interlink with sleep stages (eg, REM AHI and NREM AHI) and body position (eg, supine AHI and nonsupine AHI) for individuals, such information is not readily available in existing type 3 or type 4 devices for potable and ambulatory monitoring.15,16
Sleep is a dynamic physiological state that exhibits distinct breathing patterns and ventilatory control in normal individuals.17 Breathing tends to be regular in NREM sleep.17 Conversely, REM sleep is known to have rapid and irregular breathing patterns18,19 that may coexist with the altered upper airway patency in patients with OSA.17–20 This combination allows for the potential of severe breathing obstructions during REM sleep.10,11 The severity of such events may not be recognized in the existing type 3 or type 4 devices because they do not measure NREM and REM sleep.21 Therefore, our current study aims to address the limitation of type 3 and type 4 devices by developing a simple, low-cost, and noninvasive technique to detect the presence of OSA in NREM and REM sleep.
OSA is commonly associated with nocturnal snoring in patients.22,23 Literature indicates that properties of snoring sound can be used to characterize OSA24–30 and the sound alters within the vicinity of NREM and REM sleep.31 Our current study hypothesized that if our previously developed models for OSA/non-OSA classification25 can be modified to utilize snore sounds labeled as either NREM or REM,31 this should allow us to identify patients with OSA in each sleep state. Such an approach may provide us the opportunity to develop a technique for home diagnosis and long-term monitoring of OSA that does not require a sensor to be attached to the patient.
To design one such system, we aimed to explore the ability of snoring and breathing-related sounds in patients with OSA to characterize the presence of OSA in NREM and REM sleep. The novelty of our approach is that it employs a technique that collects snore sounds without attaching a sensor to the patient, labels the sounds as either NREM or REM, and then identifies if OSA is present in NREM or REM sleep. The process by which sounds are labeled and OSA is detected is completely automated.
METHODS
In the work of this paper our target is to train models using characteristics of snore sounds to predict OSA in NREM and REM sleep separately. We used PSG-based diagnosis as a reference for assessing the model performance on train and test data. A block diagram of our method is presented in Figure 1.
Figure 1. Block diagram.
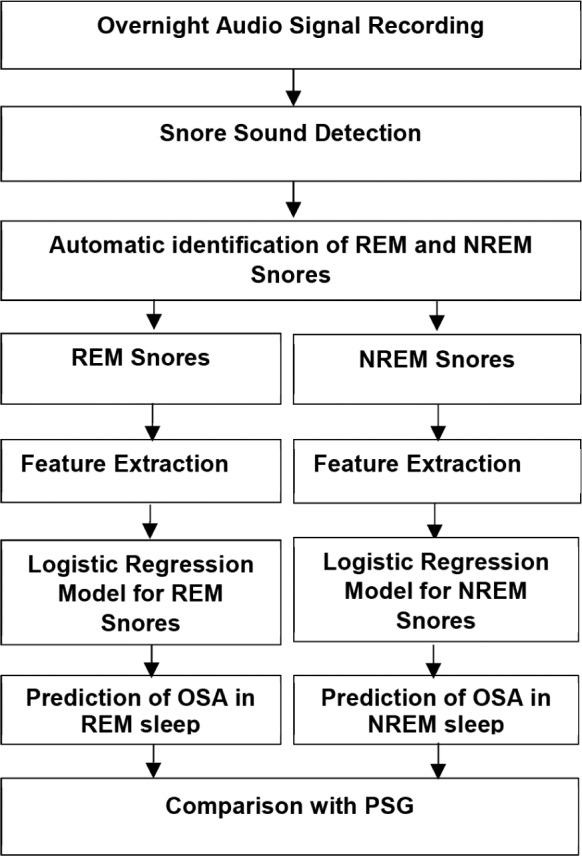
Block diagram of the proposed technique to identify OSA in NREM and REM sleep. NREM = non-rapid eye movement, OSA = obstructive sleep apnea, PSG = polysomnography, REM = rapid eye movement.
Acquisition of PSG Data and Snore Sounds
We included PSG and snoring and breathing-related sound data from 91 patients (35 females and 56 males) acquired for our previous study.32 Patients were referred for PSG testing at the Sleep Diagnostic Laboratory of the Princess Alexandra Hospital, Brisbane, Australia. Routine PSG recordings were made using clinical PSG equipment (Siesta, Compumedics, Sydney, Australia). Standard 30-second epoch length and guidelines from Rechtschaffen and Kales33 and those from the Chicago Criteria1 (AASM1999) were used during PSG testing for scoring sleep and OSA.
Snoring and breathing-related sounds were recorded using a bedside microphone (Model NT3, RODE, Sydney, Australia) at 44100 Hz sampling rate simultaneously with the PSG. A professional quality preamplifier and A/D converter unit (Model Mobile Pre-USB, M-Audio, California, United States) was used during the recording.
Snore Database
We applied an automatic algorithm developed by our group34 on the overnight snoring and breathing-related sounds recording to collect snore episodes. From 91 patients 108,228 snore episodes were collected. Snore episodes were then automatically labeled as either NREM or REM by using our previously developed algorithm.35 The snore labelling algorithm has 81% accuracy.35
To minimize the effect of the number of snore episodes in NREM and REM sleep, the patients with a total of fewer than 10 snores in each category (ie, NREM and REM) were removed. For example, if a patient had ≥ 10 NREM snores and < 10 REM snores, then the data for this patient were used only for the NREM snore-based logistic regression model (LRM) to predict OSA/non-OSA in NREM sleep. According to this inclusion/exclusion criteria, all 91 patients (35 females and 56 males) were included in the NREM snore database and 85 patients (33 females and 52 males) were included in REM snore database.
Feature Extraction
From each snore episode, we computed different types of features: formant frequencies (FF), Mel frequency cepstral coefficients (MFCC), non-Gaussianity score (NGS), loudness, and pitch. We anticipated that patients with high OSA in REM and/ or NREM sleep should demonstrate more snore-to-snore irregularities attributable to that sleep state. Therefore, to capture this sleep specific snore-to-snore variation we computed statistical properties such as the mean, standard deviation (SD), and skewness of features for each patient. Please see Table 1 for details.
Table 1.
Feature set derived for OSA/non-OSA classification during NREM and REM sleep.
Formant Frequencies
Formants are the resonance frequencies of the vocal tract (ie, F1-F3 correspond to pharyngeal constriction, tongue advancement, and lip-rounding, respectively36). Constrained upper airway regions during apneic events in NREM or REM sleep should alter the physical dimension of the airways, and hence the resonance frequencies. We considered FF from snoring sound to capture such changes in the acoustic characteristics of the upper airway. A linear predictive coding scheme with a Yule-Walker autoregressive parameter estimation method37 was used to estimate the first four formants (F1, F2, F3, and F4) of snores. The SD and skewness of F1, F2, F3, and F4 were also computed. Eight formant-based features were computed from the F1, F2, F3, and F4 (ie, SD and skewness of F1, F2, F3, and F4).
Mel Frequency Cepstral Coefficients
Our speech sound gets filtered by different regions of the vocal anatomy and our ear resolves the sound frequencies nonlinearly across the audio spectrum. There exist similarities between snore sound generation and speech production. Here, the upper airway acts as an acoustic filter during the snore sound generation, which may be further affected by the narrowed airway tunnel during OSA. Inspired by the source/filter theory of human speech synthesis, a similar mathematical technique, MFCC, was applied to represent speech into a nonlinear Mel scale of sound frequencies.38 This is consistent with the previous research on OSA, which has shown that the MFCC of snore sounds have potential in categorizing patients with OSA.26,39 We included 12 MFCC and their delta and acceleration coefficients into our current investigation. We measured the entropy of snore segments as well as their SD and skewness. A total of 108 MFCC-based features were collected from each of the NREM and REM groups.
Non-Gaussianity Score
The NGS of snore episodes is a technique proposed to quantify the deviation of a signal from a Gaussian distribution.40 The details of NGS can be found in Ghaemmaghami et al.40 The quasi-periodic structures in a snore sound tend to make them non-Gaussian in general and we have used the NGS successfully in the past to analyze snores.25,40 In this study, we computed NGS for each snore and estimated their SD and skewness as the diagnostic features.
Loudness
We computed the loudness (in dB) of snore episodes in the NREM and REM group. We considered that the breath-to-breath structural changes occurring in the upper airway may alter the loudness of individual snoring events in patients with OSA and assist in categorizing such patients. The feature was measured by 20 × (the logarithm of the ratio of sound pressure Ps of snore segments to a reference sound pressure level Pref = 2 × 10⁻⁵ Pa). The pressure Ps was computed based on the microphone sensitivity value given in the product datasheet.41 The mean and SD of maximum loudness were computed to capture snore-to-snore variations.
Pitch
Pitch is widely used as a feature in speech-processing applications36 as well as in snoring. We used the pitch period of NREM and REM snores to quantify intersnore variability in patients with OSA. We used autocorrelation with the center clipping technique41 on snores to compute pitch period. The SD of pitch periods of NREM and REM snores within each patient were utilized to extract the pitch-based features.
LRM Development
An LRM is a generalized linear model that uses several independent predictors (ie, features) to estimate the probability (Y) of a categorical event (dependent variable). In this work, independent predictors are snore-based mathematical features and categorical event: “patient has OSA at AHI threshold (AHIths) (ie, Y = 1)” or “patient does not have OSA at AHIths (ie, Y = 0).” The models were trained separately for identifying OSA in NREM and REM sleep using features from NREM and REM snores respectively. The models were designed at two thresholds of AHI, 15 and 30 events/h. The values used for AHIths are common15 in the home diagnosis of sleep apnea. Due to a lack of patients with fewer than 5 AHI events/h in NREM and REM sleep, this was not considered.
The LRM uses the regression function to estimate the probability of Y from the independent variables (ie, snore features) as shown in equation 1 and equation 2.
 |
In equation 1 and equation 2, f1, f2 …fF are the features of snoring, β0 is the intercept and β1, β2 and so on are the regression coefficients of the LRM. In order to select an optimal decision threshold for Y we used receiver operating characteristic curve analysis.
Altogether we designed six models, which are described as follows:
M1: LRM trained using NREM snores to predict OSA in NREM sleep.
M2: LRM trained using NREM snores from females to predict OSA in NREM sleep in females.
M3: LRM trained using NREM snores from males to predict OSA in NREM sleep in males.
M4: LRM trained using REM snores to predict OSA in REM sleep.
M5: LRM trained using REM snores from females to predict OSA in REM sleep in females.
M6: LRM trained using REM snores from males to predict OSA in REM sleep in males.
The performances of all models were calculated in terms of accuracy, sensitivity, and specificity.
Feature Selection and Classification
For each LRM, we followed a sequential forward feature selection (SFS) technique to identify a subset of features that were significant for predicting OSA/non-OSA in NREM and REM sleep and improved the model performance. The SFS was stopped when no further improvement was achieved. For each selected feature, SFS followed a tenfold cross validation within the training subsets and computed the mean squared error. Based on the mean of errors, a new feature was added or removed from the selected subset and this process continued until the adding feature did not reduce the error.
An optimum feature subset from SFS method was used to train the LRM to categorize a patient as OSA or non-OSA in NREM and REM sleep using snore sounds. Our study included NREM snores from 91 subjects to train M1 and REM snores from 85 subjects to train M4 by following the criteria at least 10 snores in each group. Sex-specific models M2, M3, M5, and M6 were trained using snores collected from females and males in either NREM or REM category.
In each model, we followed a leave-one-patient-out cross-validation (LOOCV) technique within our dataset so that the model trained on all the patients and leaves one for testing on it. This process was repeated until every patient was tested at least once.
Statistical Analysis
We used statistical properties such as mean and SD of demographic details of NREM and REM AHI groups for identifying evidence of sleep-specific differences. Pearson correlation coefficient r was used to measure the correlation of patients' demography against sleep-related AHI. Demographic details such as the AHI and arousal index (ArI) of overall sleep as well as their NREM and REM constituents did not exhibit normal distribution (P < .05). We used nonparametric Mann-Whitney U test (level of significance α = .05) to search statistically significant differences in demography of patients between the NREM and REM AHI groups.
Based on the statistical analysis of demographic details obtained from PSG studies, we further investigated the outcome of the models at different AHIths whether any of the models can be linked with PSG-based clinical parameters. Such an approach would provide more insights into patients with sleep-specific OSA through our technique. Using our LRM-based decision as the ground truth we divided the females and males into two groups: OSA and non-OSA. We then compared the means of several clinical parameters such as BMI, Epworth Sleepiness Scale (ESS) score, BP, etc. using statistical analysis between the groups.
We considered the one-way analysis of variance (ANOVA) test for comparing the variations within the group and across the groups. Test results were observed as F statistics and at the level of significance α = .05. F statistics indicate the ratio of mean squared error of within group and across the group variation and P is the probability of observing the test static greater than or equal to the value of F statistics.
RESULTS
Database Characteristics
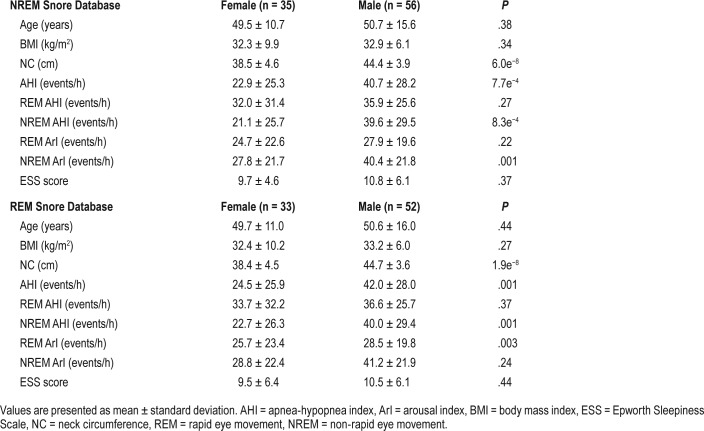
Demographic details and PSG findings of the patients included in the NREM and REM snore database are presented in Table 2. The ages of females and males of the NREM group were 50.7 ± 15.6 years and 49.5 ± 10.7 years, respectively. Both NREM and REM groups showed similar age or BMI with no significant differences (P > .05) between sexes. The neck circumference of male patients was significantly higher than that of females in both the NREM and REM groups (P < .05). Overall AHI and NREM AHI was significantly higher in males compared to the females (P < .05) in both groups. There was no significant difference in REM AHI between females and males of both groups. Both NREM and REM groups reported similar ESS score with no significant differences between sex.
Table 2.
Clinical examination details of patients with OSA included in the NREM and REM snore database.
Analysis of OSA Severity in NREM and REM Sleep
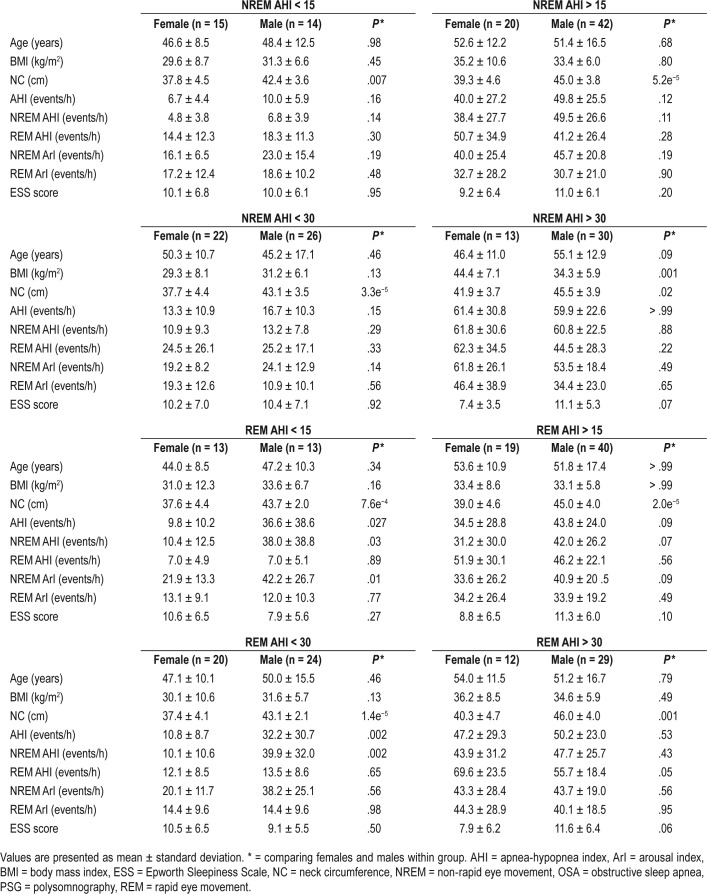
Our patient population exhibited a strong relationship between the overall AHI of patients and its AHI in NREM sleep (r = .98, P < .05) irrespective of sex. In comparison with this finding, REM-AHI showed a significant relationship with the overall AHI only for female patients (r = .5; P < .05). A comparative analysis of patient demography and PSG findings between sexes are presented in Table 3. It is to be observed from Table 3 that ArI in NREM sleep is significantly higher than the REM sleep (P < .05, Mann-Whitney U test) with no sex differences. Both sexes had similar ESS score irrespective of the sleep type.
Table 3.
Statistical analysis of the demographic characteristics and PSG indices of the females and males included in the study of sleep-specific OSA.
Furthermore, we compared the demographic differences between females and males in NREM and REM AHI groups. Both females and males with OSA in NREM and REM sleep had higher BMI and neck circumference relative to the non-OSA group (P < .05) with no significant differences in BMI between sex. Only the neck circumference showed a consistently significant sex difference (P < .05) in both NREM and REM AHI groups.
Performance of Models in Predicting OSA in NREM and REM Sleep
Table 4 shows the LOOCV results of the models at AHIths 15 and 30 events/h. The M1 achieved a sensitivity of 86.66% and a specificity of 87.09% in predicting OSA in NREM sleep at AHIths 15 events/h. The corresponding numbers for M4 were 88.13% and 88.46%. When AHIths 30 events/h was used to train M1 and M4, the performance of the two models declined considerably.
Table 4.
Performance of the models in predicting OSA in NREM and REM sleep.
Performance of the Sex-Specific Models in Predicting OSA in NREM and REM Sleep
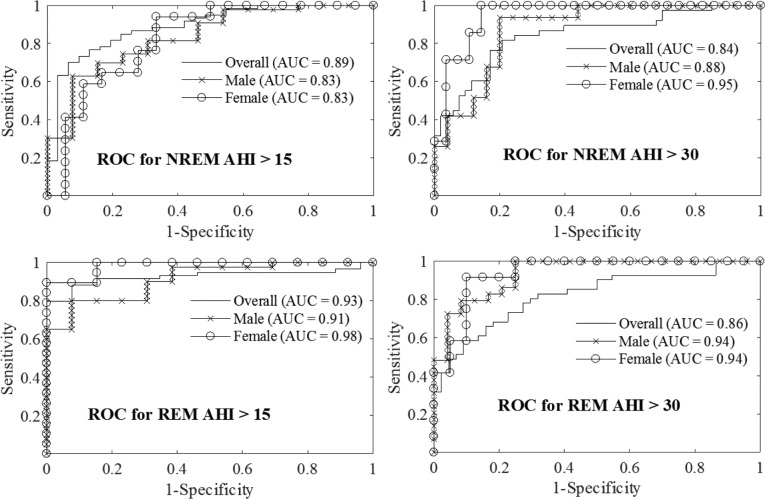
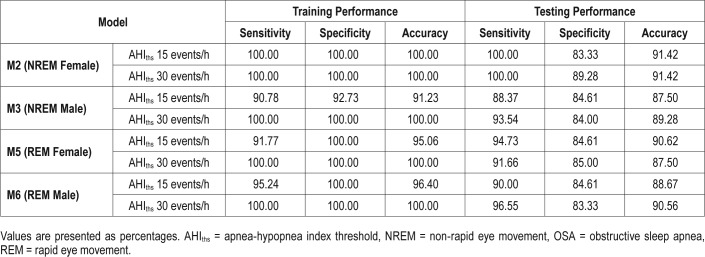
Figure 2 illustrates receiver operating characteristic curves of training models using optimum feature subset and Table 5 shows the leave-one-patient-out validation results for these models. Results from sex-specific models demonstrate that testing accuracy improved by 5% to 8% compared to the sex-independent models (see Table 4 and Table 5). The LRM performance varied at different values of AHIths. At AHIths 15 events/h, female models performed better while at AHIths 30 events/h, the performance of the male models was better.
Figure 2. ROC curves.
ROC curves for classifying OSA/non-OSA in either NREM or REM sleep demonstrate that sex-based models improve the classification performance at both AHIths = 15 and 30 events/h. AHIths = apnea-hypopnea index threshold, AUC = area under the curve, NREM = non-rapid eye movement, OSA = obstructive sleep apnea, REM = rapid eye movement, ROC = receiver operating characteristic.
Table 5.
Performance of the sex-spxecific models in predicting OSA in NREM and REM sleep.
Evaluation of Optimum Feature Selection of the Models
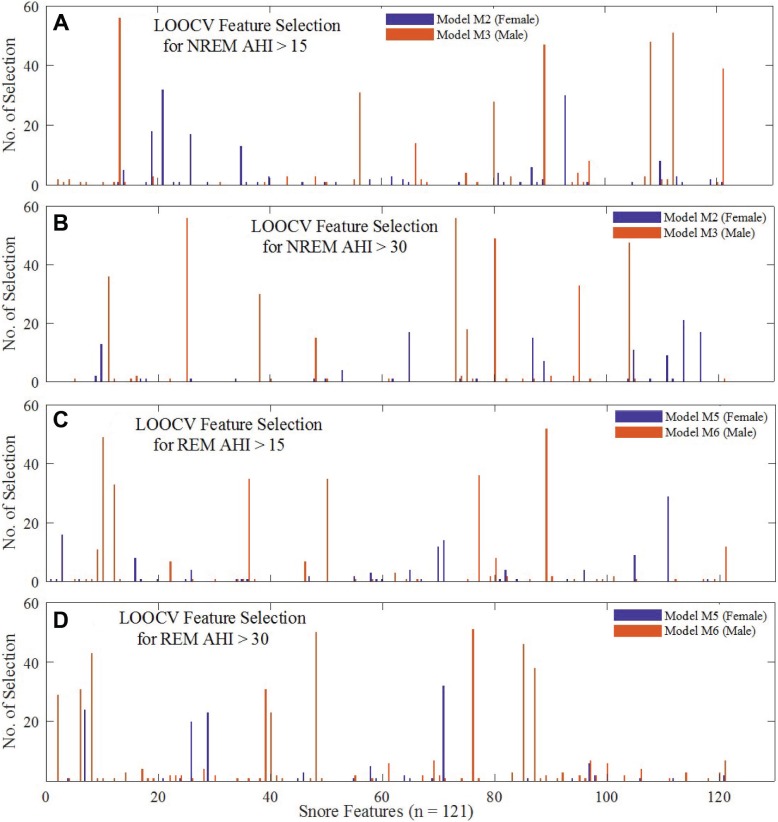
For every iteration of the models, SFS automatically selected an optimum feature subset within the training feature space; Figure 3 presents a graphical view of how many times each of the 121 features were selected in models M2, M3, M5 and M6 after LOOCV iterations. It is evident from Figure 3 that MFCC-based features were frequently selected by the models, of which the optimum feature subset selection showed differences between females and males. Although model M2 often selected the entropy of MFCC coefficients, model M3 considered skewness of MFCC coefficients (Figure 3A and Figure 3C).
Figure 3. Selection frequency of features during LOOCV.
A bar plot representation of the selection frequency of each of the 121 features during LOOCV of models M2, M3, M5 and M6: (A) and (B) are for NREM AHIths 15 and 30 events/h on the female and male dataset. Similarly, (C) and (D) are for REM AHI. The two colors are used respectively for models using female and male patients. AHIths = apnea-hypopnea index threshold, LOOCV = leave-one-patient-out cross-validation, NREM = non-rapid eye movement, REM = rapid eye movement.
Clinical Attributes of Predicted OSA in NREM and REM Sleep
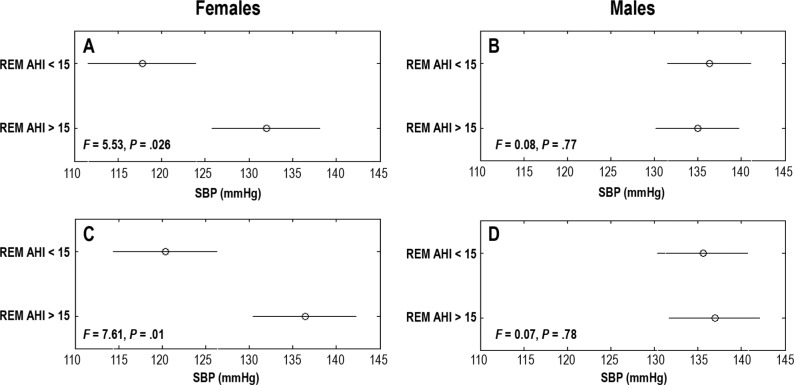
Our analysis showed that when M5 (trained using AHIths 15 events/h) was used as ground truth to divide subjects into OSA and non-OSA groups, then the systolic blood pressure (SBP) in the two groups were significantly different (ANOVA test P = .01, see Figure 4). However, this was not true for the corresponding model for male subjects (ie, M6). The nonoverlap-ping comparison intervals in Figure 4A represent a significant difference (F statistics of morning SBP = 5.53 and P = .026). The female subjects having REM OSA at AHIths 15 events/h, according to M5, tended to have higher SBP (by at least 16 mmHg) than the female subjects in the non-OSA group at AHIths 15 events/h. This was consistent for morning and evening SBP as well.
Figure 4. Comparison of SBP between females and males.
A comparison of SBP levels between females and males with REM AHI > 15 and < 15 events/h when REM AHI range was predicted by the models M5 (REM female) and M6 (REM male). SBP was measured in the morning after (A, B) and the evening before (C, D) the PSG study. Circles indicate the group means of one-way ANOVA tests and the horizontal lines indicate the comparison interval. F statistics represent the ratio of mean squared error of within group variation and between group variation of SBP. The P is the level of statistical significance of the difference between group means. If the differences are significant, then the horizontal lines are disjointed and P < .05. The lines overlap if the difference is insignificant and P > .05. AHI = apnea-hypopnea index, ANOVA = analysis of variance, PSG = polysomnography, REM = rapid eye movement, SBP = systolic blood pressure.
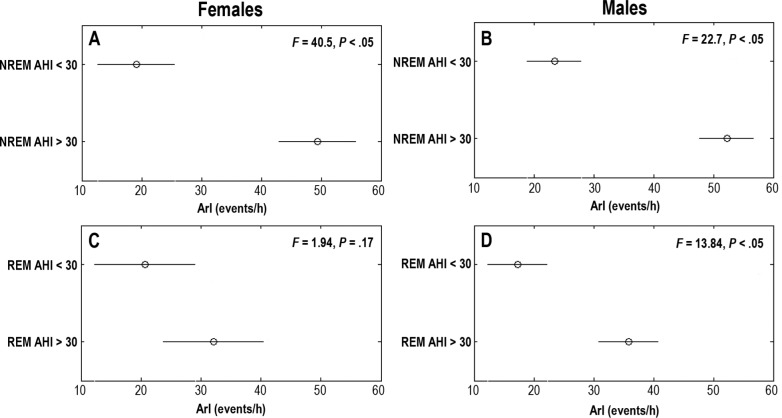
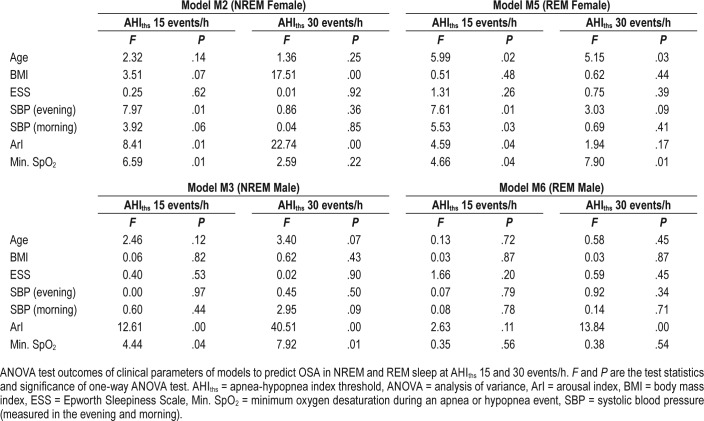
When results of M2 and M3 were used as ground truth to divide the subjects into OSA and non-OSA groups at AHIths 30 events/h, the ArIs of the male subjects were significantly different (see Figure 5). Other clinical parameters that showed similar significant difference between two groups were minimum SpO2 (ie, M2) and age (ie, M2). Table 6 shows the ANOVA test result for all the models and clinical parameters.
Figure 5. Comparison of ArI between females and males.
Comparison of ArI between females and males during NREM and REM sleep as categorized by our sex-specific models M2 (NREM female) (A), M3 (NREM male) (B), M5 (REM female) (C), and M6 (REM male) (D). Mean and comparison intervals are indicated as circles and horizontal lines, respectively. F statistics and P indicate the test statistics and the significance level of one-way ANOVA testing between groups. An overlap between the comparison intervals and P > .05 indicates that the means of the two groups are not statistically significant; for significance, the two intervals should remain disjointed with P < .05. AHI = apnea-hypopnea index, ANOVA = analysis of variance, ArI = arousal index, NREM = non-rapid eye movement, REM = rapid eye movement.
Table 6.
ANOVA test outcomes.
Comparative Efficacy of Models Using Automated Versus PSG-Based NREM/REM Labeling
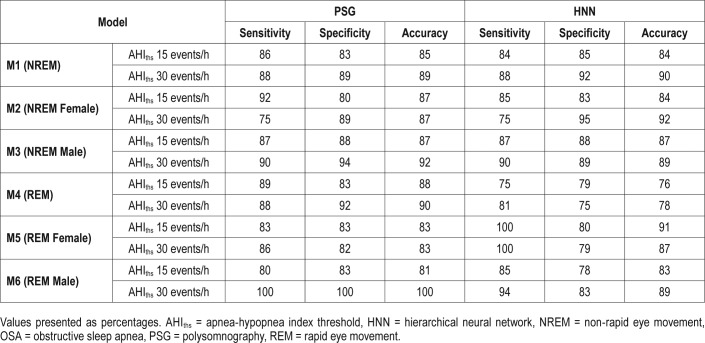
The models M1, M2, M3, M4, M5, and M6 were redesigned to evaluate the performances of automated labeling of NREM/ REM snores against the technician-scored sleep stages from PSG studies using a subset of 63 out of 91 patients. Table 7 presents these results obtained after LOOCV iterations. The results in Table 7 show no significant difference between the automated and the PSG-based snore labelling approaches. Overall, the model M5 using automatically labeled REM snores from female patients estimated slightly better (ie, 4% to 8% higher accuracy) than the PSG-based labeling.
Table 7.
A comparison between the performances of models for NREM/REM OSA classification in 63 females and males using NREM and REM snores as identified by the PSG data and an HNN model.35
DISCUSSION
In this paper, we have demonstrated that snoring sounds alone can be used to estimate OSA severity in NREM and REM sleep with 88% to 91% accuracy. This is similar to our previous observation in OSA/non-OSA classification,25,42 where separate sex-based models showed an improvement in the classification. In order to investigate sex influence on our models in predicting OSA in NREM and REM sleep, we designed separate models for females and males. We observed that designing sex-specific models improved the classification accuracy from 82% to 85% to 87% to 91% for OSA prediction in REM sleep and from 80% to 86% to 88% to 91% for OSA prediction in NREM sleep. The improvement in model performance after sex consideration may be associated with sex-specific differences in the upper airway (both structural and functional) and variation in clinical presentation of OSA in females and males.43 This warrants further study with a much larger dataset.
To the best of our knowledge, this is the first attempt of detecting NREM and REM snores in patients with OSA and deploying such information to estimate the presence of OSA at different AHIths in NREM and REM sleep. Other studies have investigated snoring sound characteristics in different sleep states,44–46 but did not use the information to estimate the respective AHI. These studies were either limited to descriptive statistics of snore features44 or included a limited dataset without independent validation of the findings.45,46 Our approach in this study has applied an automatic technique to separate NREM and REM snores that were tested on an independent dataset reporting 81% accuracy.35 Using acoustic features of these snores and a trained LRM, our results suggest that such an approach can reliably detect OSA in NREM and REM sleep at AHIths 15 and 30 events/h.
The major novelty of our approach is that we used snore sounds acquired with sensors that do not need to be attached to the patient (bedside microphones) to estimate OSA severity in NREM and REM sleep. Currently, these data are only able to be collected by type 1 and type 2 devices21 that use a host of body contact bioelectrodes such as electroencephalography,47 electromyography, and electro-oculography. Type 3 and type 4 devices meant for portable monitoring typically avoid such sensors because of difficulties in deployment and reliable data acquisition in the absence of a sleep technologist to monitor the process. Our approach makes it possible to estimate AHI in NREM and REM sleep through a fully automated process using sensors that are free from difficulties faced by those that must be in contact with the patient.
Separate indices for OSA severity in NREM and REM sleep have clinical importance. Several recent studies have reported that obstructive apnea and hypopnea events that occur during REM sleep are linked to prevalent hypertension,4,5 nondipping of nocturnal BP,3 and diabetes.48 Hence, the diagnosis of OSA and its subsequent treatment require both the overall AHI as well as the AHI in NREM and REM sleep. All the snore-based OSA detection techniques proposed in the past were designed to identify only the overall severity of OSA in patients. Without data that also provide the patient's AHI in NREM and REM sleep, clinicians cannot make a fully informed decision about their patient's care.
We observed that the SBP in females with OSA in REM sleep, identified by model M5, at AHIths 15 events/h was significantly higher (P < .05) than that in males (see Table 6). This can be related to earlier reports that hypertension and other comorbidities are more common in females (P < .0001).43 This could be possibly linked to the findings that females exhibit higher AHI in REM sleep than males.43,49 However, we recognize that further analysis on a larger population is needed before a firm conclusion can be reached.
One limitation of the current study is the dependency of our method on the availability of snores during NREM and REM sleep. Snoring sound is quite common in patients with OSA,22,23 but a very small percentage of patients with OSA do not snore.50 Our method cannot be used on such patients.
DISCLOSURE STATEMENT
All authors have seen and approved the manuscript. This work was partially supported by the Australian Research Council under grant DP120100141 to Dr. Abeyratne and the NHMRC Project Grant (APP112660) to Drs. Abeyratne, Swarnkar and Hukins. The authors report no conflicts of interest.
ACKNOWLEDGMENTS
The authors acknowledge Mr. Brett Duce, Scientific Director, Sleep Disorders Centre, Department of Respiratory and Sleep Medicine, Princess Alexandra Hospital, Brisbane, Australia, for the valuable assistance with clinical data acquisition.
ABBREVIATIONS
- AHI
apnea-hypopnea index
- ANOVA
analysis of variance
- ArI
EEG arousal index
- BMI
body-mass index
- BP
blood pressure
- ESS
Epworth sleepiness scale
- FF
formant frequency
- HNN
hierarchical neural network
- LOOCV
leave-one patient-out cross-validation
- LRM
logistic regression model
- MFCC
Mel frequency cepstral coefficient
- NC
neck circumference
- NGS
non-Gaussianity score
- NREM
non-rapid eye movement
- NREM AHI
apnea-hypopnea index in NREM sleep
- OSA
obstructive sleep apnea
- PSG
polysomnography
- REM
rapid eye movement
- REM AHI
apnea-hypopnea index in REM sleep
- SBP
systolic blood pressure
- SD
standard deviation
- SFS
sequential feature selection
REFERENCES
- 1.Sleep-related breathing disorders in adults: recommendations for syndrome definition and measurement techniques in clinical research. The report of an American Academy of Sleep Medicine task force. Sleep. 1999;22(5):667–689. [PubMed] [Google Scholar]
- 2.Won C, Robert D. Morbidity and Mortality. In: Kushida CA, editor. Obstructive Sleep Apnea: Pathophysiology, Comorbidities, and Consequences. New York, NY: Informa Healthcare; 2007. pp. 259–274. [Google Scholar]
- 3.Mokhlesi B, Hagen EW, Finn LA, Hla KM, Carter JR, Peppard PE. Obstructive sleep apnoea during REM sleep and incident non-dipping of nocturnal blood pressure: a longitudinal analysis of the Wisconsin Sleep Cohort. Thorax. 2015;70(11):1062–1069. doi: 10.1136/thoraxjnl-2015-207231. [DOI] [PMC free article] [PubMed] [Google Scholar]
- 4.Mokhlesi B, Finn LA, Hagen EW, et al. Obstructive sleep apnea during REM sleep and hypertension. Results of the Wisconsin Sleep Cohort. Am J Respir Crit Care Med. 2014;190(10):1158–1167. doi: 10.1164/rccm.201406-1136OC. [DOI] [PMC free article] [PubMed] [Google Scholar]
- 5.Niijima M, Kimura H, Edo H, et al. Manifestation of pulmonary hypertension during REM sleep in obstructive sleep apnea syndrome. Am J Respir Crit Care Med. 1999;159(6):1766–1772. doi: 10.1164/ajrccm.159.6.9808064. [DOI] [PubMed] [Google Scholar]
- 6.Appleton SL, Vakulin A, Martin SA, et al. Hypertension is associated with undiagnosed OSA during rapid eye movement sleep. Chest. 2016;150(3):495–505. doi: 10.1016/j.chest.2016.03.010. [DOI] [PubMed] [Google Scholar]
- 7.Wilson PWF, D'Agostino RB, Levy D, Belanger AM, Silbershatz H, Kannel WB. Prediction of coronary heart disease using risk factor categories. Circulation. 1998;97(18):1837–1847. doi: 10.1161/01.cir.97.18.1837. [DOI] [PubMed] [Google Scholar]
- 8.Grace KP, Hughes SW, Horner RL. Identification of the mechanism mediating genioglossus muscle suppression in REM sleep. Am J Respir Crit Care Med. 2013;187(3):311–319. doi: 10.1164/rccm.201209-1654OC. [DOI] [PubMed] [Google Scholar]
- 9.Fenik VB, Davies RO, Kubin L. REM sleep-like atonia of hypoglossal (XII) motoneurons is caused by loss of noradrenergic and serotonergic inputs. Am J Respir Crit Care Med. 2005;172(10):1322–1330. doi: 10.1164/rccm.200412-1750OC. [DOI] [PMC free article] [PubMed] [Google Scholar]
- 10.Findley LJ, Wilhoit SC, Suratt PM. Apnea duration and hypoxemia during REM sleep in patients with obstructive sleep apnea. Chest. 1985;87(4):432–436. doi: 10.1378/chest.87.4.432. [DOI] [PubMed] [Google Scholar]
- 11.Charbonneau M, Marin J, Olha A, Kimoff R, Levy R, Cosio M. Changes in obstructive sleep apnea characteristics through the night. Chest. 1994;106(6):1695–1701. doi: 10.1378/chest.106.6.1695. [DOI] [PubMed] [Google Scholar]
- 12.Peppard PE, Ward NR, Morrell MJ. The impact of obesity on oxygen desaturation during sleep-disordered breathing. Am J Respir Crit Care Med. 2009;180(8):788–793. doi: 10.1164/rccm.200905-0773OC. [DOI] [PMC free article] [PubMed] [Google Scholar]
- 13.Somers VK, Dyken ME, Clary MP, Abboud FM. Sympathetic neural mechanisms in obstructive sleep apnea. J Clin Invest. 1995;96(4):1897–1904. doi: 10.1172/JCI118235. [DOI] [PMC free article] [PubMed] [Google Scholar]
- 14.Somers VK, Dyken ME, Mark AL, Abboud FM. Sympathetic-nerve activity during sleep in normal subjects. N Engl J Med. 1993;328(5):303–07. doi: 10.1056/NEJM199302043280502. [DOI] [PubMed] [Google Scholar]
- 15.Flemons WW, Littner MR, Rowley JA, et al. Home diagnosis of sleep apnea: a systematic review of the literature. An evidence review cosponsored by the American Academy of Sleep Medicine, the American College of Chest Physicians, and the American Thoracic Society. Chest. 2003;124(4):1543–1579. doi: 10.1378/chest.124.4.1543. [DOI] [PubMed] [Google Scholar]
- 16.ATS/ACCP/AASM Taskforce Steering Committee. Executive summary on the systematic review and practice parameters for portable monitoring in the investigation of suspected sleep apnea in adults. Am J Respir Crit Care Med. 2004;169(10):1160–1163. doi: 10.1164/rccm.169.1160. [DOI] [PubMed] [Google Scholar]
- 17.Douglas NJ, White DP, Pickett CK, Weil JV, Zwillich CW. Respiration during sleep in normal man. Thorax. 1982;37(11):840–844. doi: 10.1136/thx.37.11.840. [DOI] [PMC free article] [PubMed] [Google Scholar]
- 18.Schäffer T. Respiratory physiology in sleep and wakefulness. Handb Clin Neurol. 2011;98:371–381. doi: 10.1016/B978-0-444-52006-7.00024-1. [DOI] [PubMed] [Google Scholar]
- 19.Rostig S, Kantelhardt JW, Penzel T, et al. Nonrandom variability of respiration during sleep in healthy humans. Sleep. 2005;28(4):411–417. doi: 10.1093/sleep/28.4.411. [DOI] [PubMed] [Google Scholar]
- 20.Jordan AS, Malhotra A, White D, et al. Airway dilator muscle activity and lung volume during stable breathing in obstructive sleep apnea. Sleep. 2009;32(3):361–368. doi: 10.1093/sleep/32.3.361. [DOI] [PMC free article] [PubMed] [Google Scholar]
- 21.Trikalinos TA, Ip S, Raman G, et al. Home Diagnosis of Obstructive Sleep Apnea-Hypopnea Syndrome. [Accessed October 11, 2016]. https://www.ncbi.nlm.nih.gov/books/NBK254138/. Published August 8, 2007. [PubMed]
- 22.American Academy of Sleep Medicine. International Classification of Sleep Disorders: Diagnostic and Coding Manual. 2nd ed. Westchester, IL: American Academy of Sleep Medicine; 2005. [Google Scholar]
- 23.Epstein LJ, Kristo D, Strollo PJ, Jr, et al. Clinical guideline for the evaluation, management and long-term care of obstructive sleep apnea in adults. J Clin Sleep Med. 2009;5(3):263–276. [PMC free article] [PubMed] [Google Scholar]
- 24.Herath DL, Abeyratne UR, Hukins C. Hidden Markov modelling of intra-snore episode behavior of acoustic characteristics of obstructive sleep apnea patients. Physiol Meas. 2015;36(12):2379–2404. doi: 10.1088/0967-3334/36/12/2379. [DOI] [PubMed] [Google Scholar]
- 25.Abeyratne UR, De Silva S, Hukins C, Duce B. Obstructive sleep apnea screening by integrating snore feature classes. Physiol Meas. 2013;34(2):99–121. doi: 10.1088/0967-3334/34/2/99. [DOI] [PubMed] [Google Scholar]
- 26.Karunajeewa AS, Abeyratne UR, Hukins C. Multi-feature snore sound analysis in obstructive sleep apnea-hypopnea syndrome. Physiol Meas. 2011;32(1):83–97. doi: 10.1088/0967-3334/32/1/006. [DOI] [PubMed] [Google Scholar]
- 27.Azarbarzin A, Moussavi Z. Snoring sounds variability as a signature of obstructive sleep apnea. Med Eng Phys. 2013;35(4):479–485. doi: 10.1016/j.medengphy.2012.06.013. [DOI] [PubMed] [Google Scholar]
- 28.Karunajeewa AS, Abeyratne UR, Hukins C. Pitch/Airway-Response and Cepstral Analysis of Snore Sounds for the Non-Contact Screening of Sleep Apnea. In: Dössel O, Schlegel WC, editors. IFMBE Proceedings, Volume 25/4: World Congress on Medical Physics and Biomedical Engineering, September 7 - 12, 2009, Munich, Germany. Berlin, Heidelberg, Germany: Springer-Verlag; 2009. [Google Scholar]
- 29.Sola-Soler J, Jane R, Fiz JA, Morera J. Towards automatic pitch detection in snoring signals. In: Enderle JD, editor. Proceedings of the 22nd Annual International Conference of the IEEE Engineering in Medicine and Biology Society, Volume 4, 23-28 July 2000. Navy Pier Convention Center, Chicago, Illinois, USA. Cat. No. 00CH37143. Piscataway, NJ: Institute of Electrical and Electronics Engineers, Inc; 2000. pp. 2974–2976. [Google Scholar]
- 30.Mesquita J, Solà-Soler J, Fiz JA, Morera J, Jané R. All night analysis of time interval between snores in subjects with sleep apnea hypopnea syndrome. Med Biol Eng Comput. 2012;50(4):373–381. doi: 10.1007/s11517-012-0885-9. [DOI] [PMC free article] [PubMed] [Google Scholar]
- 31.Akhter S, Abeyratne UR, Swarnkar V. Characterization of REM/NREM sleep using breath sounds in OSA. Biomed Signal Process Control. 2016;25:130–142. [Google Scholar]
- 32.Karunajeewa AS, Abeyratne UR, Hukins C. Silence-breathing-snore classification from snore-related sounds. Physiol Meas. 2008;29(2):227–243. doi: 10.1088/0967-3334/29/2/006. [DOI] [PubMed] [Google Scholar]
- 33.Rechtschaffen A, Kales A. A Manual of Standardized Terminology, Techniques and Scoring System for Sleep Stages of Human Subjects. Los Angeles, CA: UCLA Brain Information Service/Brain Research Institute; 1968. [Google Scholar]
- 34.Swarnkar VR, Abeyratne UR, Sharan RV. Automatic picking of snore events from overnight breath sound recordings. Conf Proc IEEE Eng Med Biol Soc. 2017;2017:2822–2825. doi: 10.1109/EMBC.2017.8037444. [DOI] [PubMed] [Google Scholar]
- 35.Akhter S, Abeyratne UR. Detection of REM/NREM snores in obstructive sleep apnoea patients using a machine learning technique. Biomed Phys Eng Express. 2016;2(5) 055022. [Google Scholar]
- 36.Zemlin WR. Speech and Hearing Science: Anatomy and Physiology. 4th ed. London, UK: Pearson; 1997. [Google Scholar]
- 37.Markel J. Digital inverse filtering-a new tool for formant trajectory estimation. IEEE Trans Audio Electroacoustics. 1972;20(2):129–137. [Google Scholar]
- 38.Davis S, Mermelstein P. Comparison of parametric representations for monosyllabic word recognition in continuously spoken sentences. IEEE Trans Acoust Speech Signal Process. 1980;28(4):357–366. [Google Scholar]
- 39.Ben-Israel N, Tarasiuk A, Zigel Y. Obstructive apnea hypopnea index estimation by analysis of nocturnal snoring signals in adults. Sleep. 2012;35(9):1299–1305. doi: 10.5665/sleep.2092. [DOI] [PMC free article] [PubMed] [Google Scholar]
- 40.Ghaemmaghami H, Abeyratne UR, Hukins C. Normal probability testing of snore signals for diagnosis of obstructive sleep apnea. Conf Proc IEEE Eng Med Biol Soc. 2009;2009:5551–5554. doi: 10.1109/IEMBS.2009.5333733. [DOI] [PubMed] [Google Scholar]
- 41.Freedman P. RODE Microphone: NT3 Instruction Manual. Sydney, Australia: RODE Microphones; [Accessed October 11, 2017]. http://www.rode.com/microphones/nt3. [Google Scholar]
- 42.de Silva S, Abeyratne UR, Hukins C. Impact of gender on snore-based obstructive sleep apnea screening. Physiol Meas. 2012;33(4):587–601. doi: 10.1088/0967-3334/33/4/587. [DOI] [PubMed] [Google Scholar]
- 43.Basoglu OK, Tasbakan MS. Gender differences in clinical and polysomnographic features of obstructive sleep apnea: a clinical study of 2827 patients. Sleep Breath. 2018;22(1):241–249. doi: 10.1007/s11325-017-1482-9. [DOI] [PubMed] [Google Scholar]
- 44.Nanako H, Ikeda T, Hayashi M, Ohshima E, Onizuka A. Effects of body position on snoring in apneic and nonapneic snorers. Sleep. 2003;26(2):169–172. doi: 10.1093/sleep/26.2.169. [DOI] [PubMed] [Google Scholar]
- 45.Azarbarzin A, Moussavi Z. Intra-subject variability of snoring sounds in relation to body position, sleep stage, and blood oxygen level. Med Biol Eng Comput. 2013;51(4):429–439. doi: 10.1007/s11517-012-1011-8. [DOI] [PubMed] [Google Scholar]
- 46.Soltanzadeh R, Moussavi Z. Sleep stage detection using tracheal breathing sounds: a pilot study. Ann Biomed Eng. 2015;43(10):2530–2537. doi: 10.1007/s10439-015-1290-y. [DOI] [PubMed] [Google Scholar]
- 47.Swarnkar V, Abeyratne UR, Hukins C, Duce B. A state transition-based method for quantifying EEG sleep fragmentation. Med Biol Eng Comput. 2009;47(10):1053. doi: 10.1007/s11517-009-0524-2. [DOI] [PubMed] [Google Scholar]
- 48.Grimaldi D, Beccuti G, Touma C, Van Cauter E, Mokhlesi B. Association of obstructive sleep apnea in rapid eye movement sleep with reduced glycemic control in type 2 diabetes: therapeutic implications. Diabetes Care. 2014;37(2):355–363. doi: 10.2337/dc13-0933. [DOI] [PMC free article] [PubMed] [Google Scholar]
- 49.O'Connor C, Thornley KS, Hanly PJ. Gender differences in the polysomnographic features of obstructive sleep apnea. Am J Respir Crit Care Med. 2000;161(5):1465–1472. doi: 10.1164/ajrccm.161.5.9904121. [DOI] [PubMed] [Google Scholar]
- 50.Hoffstein V, Mateika S, Anderson D. Snoring: is it in the ear of the beholder? Sleep. 1994;17(6):522–526. doi: 10.1093/sleep/17.6.522. [DOI] [PubMed] [Google Scholar]


