

Abstract
Background
Gastrointestinal symptoms are common in Parkinson’s disease and frequently precede the development of motor impairments. Intestinal inflammation has been proposed as a driver of disease pathology, and evaluation of inflammatory mediators in stool could possibly identify valuable early-stage biomarkers. We measured immune- and angiogenesis-related proteins in human stool to examine inflammatory profiles associated with Parkinson’s disease.
Methods
Stool samples and subjects’ self-reported metadata were obtained from 156 individuals with Parkinson’s disease and 110 without, including spouse and non-household controls. Metadata were probed for disease-associated differences, and levels of 37 immune and angiogenesis factors in stool homogenates were measured by multiplexed immunoassay and compared across experimental groups.
Results
Parkinson’s disease patients reported greater incidence of intestinal disease and digestive problems than controls. Direct comparison of levels of stool analytes in patients and controls revealed elevated Flt1, IL-1α, and CXCL8 in patients’ stool. Paired comparison of patients and spouses suggested higher levels of multiple factors in patients, but this was complicated by sex differences. Sex, body mass index, a history of smoking, and use of probiotics were found to strongly influence levels of stool analytes. Multivariate analysis accounting for these and other potential confounders confirmed elevated levels of IL-1α and CXCL8 and additionally revealed increased IL-1β and CRP in stool in Parkinson’s disease. These differences were not dependent on subject age or disease duration.
Conclusions
Levels of stool immune factors indicate that intestinal inflammation is present in patients with Parkinson’s disease.
Keywords: inflammation, Parkinson’s disease, intestine, stool, biomarker
Introduction
Parkinson’s disease (PD) is currently defined by motor impairments such as resting tremor, bradykinesia, rigidity, and gait disturbance, but non-motor features including cognitive impairment, hyposmia, anxiety, depression, sleep disturbances, and, prominently, gastrointestinal (GI) dysfunction have been gaining increasing attention and have a profound impact on quality of life. Constipation is reported by approximately 50% of PD patients1 and can be detected by objective measures in nearly 80%2. It frequently precedes the onset of motor symptoms by more than 15 years3. Pathological abnormalities including the PD-related aggregation of alpha synuclein (αSYN) have been identified in intestinal biopsies from PD patients4 and even in subjects in the pre-motor phase of disease,5, 6 although consensus on the best interpretation of these results has not been reached (reviewed in7). PD patients also exhibit significant differences in gut bacterial populations8–16 and increased intestinal permeability compared to individuals without PD17, 18. With accumulating evidence that GI symptoms are present from the earliest stages of PD, it has been proposed that PD pathology may originate in the gut and later spread to the central nervous system (CNS). Immune activity may advance this progression, as intestinal inflammation can promote systemic and also CNS inflammation19, 20 which contributes to PD-related neurodegeneration21.
Intestinal symptoms observed in PD are consistent with conditions of inflammation. Constipation in PD patients is attributed to slow intestinal transit time22, 23, a symptom which is also frequently observed in other conditions involving chronic GI inflammation such as inflammatory bowel disease (IBD)24 and obesity25. Mechanistically, this condition has been linked to intestinal immune activation26 and to intestinal dysbiosis, which is another hallmark of disorders involving gut inflammation24, 27. Immune activation promotes increased αSYN expression and aggregation17, 28, 29, and αSYN in turn stimulates proinflammatory immune responses28, 30. In keeping with the well-known connections between inflammatory stimuli and impairment of gut barrier function17, 31, intestinal permeability in PD correlates with levels of αSYN as well as indicators of oxidative stress18. Additionally, recent studies have reported significant coincidence of IBD or irritable bowel syndrome and PD32–34. One study reported the most direct confirmation of intestinal inflammation in PD, finding increases in mRNA transcripts encoding four proinflammatory cytokines (tumor necrosis factor, interferon gamma, interleukin-6, and interleukin-1β) as well as three glial markers in colonic biopsies of PD patients compared to age-matched healthy controls35.
Given the accumulation of evidence suggesting that pronounced GI dysfunction and dysbiosis occurs in PD, we conducted an extensive analysis of immune and angiogenesis factors in stool to assess the GI inflammatory state in PD patients, their healthy spouses, and unrelated healthy control subjects. We also evaluated the prevalence of certain PD-associated non-motor symptoms in our subject cohort and assessed how these and other physiological and lifestyle factors influenced levels of stool analytes.
Methods
Subjects
A subset of the NeuroGenetics Research Consortium subjects from Atlanta, GA; Albany, NY; and Seattle, WA were invited to participate (re-contacted based on prior Institutional Review Board-approved consents). These included most of the subjects evaluated for stool microbiota composition described by Hill-Burns et al14, excluding those for whom stool samples were of insufficient quantity for this analysis. Of 266 subjects, 156 had been diagnosed with PD by a movement disorder specialist (PD patients), and 110 reported no diagnosis of PD (controls). Within the control group, 49 subjects were spouses of PD patients (household controls), 39 of whom had a spouse participating in this study, and 61 were not known to live with anyone diagnosed with PD (non-household controls). We evaluated whether any significant differences existed between household and non-household control groups in levels of stool analytes (Supp Table 1) or in various relevant metadata factors (Supp Table 2), and, finding none, we combined these groups for all analyses except a paired comparison of PD patients and their respective spouses. Over 99% of subjects described their race as “white.” Ages of participants ranged from 36 to 94 years; mean age of control subjects was 70.8 years (standard deviation 8.8 years), and mean age of PD subjects was 68.3 years (standard deviation 8.8 years). A strong male sex bias was observed in PD subjects, with 112 males and 44 females. Accordingly, the opposite sex bias was observed in household controls, with 36 females and 13 males. Non-household controls consisted of 35 males and 26 females. In addition to providing a stool sample, subjects completed a questionnaire on demographics, health problems, medications, and dietary practices.
Processing of stool
Stool samples were collected on BBL CultureSwabs (Becton, Dickson and Company; Sparks, MD) by participants at home, shipped immediately via the United States Postal Service at ambient temperature, and then stored at −20°C until processing. Swab tips were placed in tubes with 5-mm stainless steel beads (QIAGEN, Valencia, CA) and 550μL homogenization buffer (125mM Tris, 15mM MgCl2, 2.5mM EDTA pH 7.2, 1% Triton X-100, 1 tablet protease inhibitors [1697498, Roche, Indianapolis, IN] per 10mL buffer). Samples were agitated (20Hz) in chilled racks in TissueLyser II (QIAGEN) for three cycles of two minutes. Debris were pelleted by centrifugation, and supernatants were collected.
Multiplexed immunoassays
Levels of immune factors were measured in 40μL undiluted stool homogenates using the V-PLEX Neuroinflammation Panel 1 (human) Kit (Meso Scale Discovery, Rockville, MD) according to the manufacturer’s protocol. This kit is divided into 5 panels of analytes grouped into the physiological categories “Angiogenesis,” “Chemokine,” “Cytokine,” “Proinflammatory,” and “Vascular Injury.” Analytes measured were: vascular endothelial growth factor receptor 1 (Flt1), placental growth factor (PIGF), tyrosine kinase 2 (Tie-2), vascular endothelial growth factor A (VEGF), vascular endothelial growth factor D (VEGF-D), basic fibroblast growth factor (bFGF), eotaxin (CCL11), eotaxin-3 (CCL26), interferon gamma-induced protein 10 (IP-10, CXCL10), monocyte chemoattractant protein 1 (MCP-1, CCL2), monocyte chemoattractant protein 4 (MCP-4, CCL13), macrophage-derived chemokine (MDC, CCL22), macrophage inflammatory protein 1 alpha (MIP-1α, CCL3), macrophage inflammatory protein 1 beta (MIP-1β, CCL4), thymus and activation-regulated chemokine (TARC, CCL17), interleukin 12/interleukin 23 p40 (IL-12/IL-23 p40), interleukin 15 (IL-15), interleukin 16 (IL-16), interleukin 17 A (IL-17A), interleukin 1 alpha (IL-1α), interleukin 5 (IL-5), interleukin 7 (IL-7), lymphotoxin alpha (LTA), vascular endothelial growth factor C (VEGF-C), interferon gamma (IFNγ), interleukin-10 (IL-10), interleukin-13 (IL-13), interleukin-1 beta (IL-1β), interleukin-2 (IL-2), interleukin-4 (IL-4), interleukin-6 (IL-6), interleukin-8 (IL-8, CXCL8), tumor necrosis factor (TNF), C-reactive protein (CRP), serum amyloid A (SAA), soluble intercellular adhesion molecule 1 (sICAM-1), soluble vascular cell adhesion molecule 1 (sVCAM-1).
Analyte levels were measured on the Meso Scale Discovery (MSD) QuickPlex instrument and evaluated on the MSD software platform. Values were normalized to total protein measured in each sample by Pierce BCA Protein Assay Kit (Thermo Scientific, Rockford, IL) according to manufacturer’s protocol.
Statistical analysis
Chi square tests (two-tailed) were utilized to assess relationships between disease status (PD patients/controls) and discrete-valued (e.g., Yes/No) responses to various health-related questions. T-tests were used to compare levels of stool analytes between PD patients and controls, and Wilcoxon rank sum test was used to compare levels of stool analytes between males and females (t-test deemed inappropriate due to data skew). General linear models (GLM) were used to investigate relationships between disease status and metadata factors. Multivariate analysis was performed using multiple regression GLM with multiple imputation (5) with the following potential confounders or effect modifiers: age, sex, geographic location, antibiotic use in the three months prior to stool collection, use of anti-inflammatory drugs which in these subjects included non-steroidal anti-inflammatory drugs or prednisone at least thrice a week (included automatically); body mass index (BMI), smoked at least 100 cigarettes in lifetime, current probiotic use including probiotic supplements or yogurt with live culture (included due to strong effects on stool analyte levels); birth by Caesarean section, digestive problems on the day of stool collection, diarrhea in the three months prior to stool collection, constipation in the three months prior to stool collection, coffee consumption, and alcohol consumption (included because incidence differed significantly between PD patients and controls). Unless otherwise specified, analyses were conducted using PROC GLM and PROC MIXED in SAS/STAT® software v9.3 for PC (SAS Institute Inc. 2011, SAS/STAT® 9.3 User’s Guide. Cary, NC: SAS Institute Inc).
Results
Increased incidence of psychological and gastrointestinal symptoms in PD patients and decreased coffee and alcohol consumption
As expected, PD patients in this study reported increased incidence of anxiety (11 Controls-10.0%, 41 PD-26.1%, X2=11.52, p=0.0007), depression (24 Controls-21.8%, 52 PD-33.1%, X2=5.147, p=0.0233), and sleep problems (14 Controls-12.7%, 61 PD-38.9%, X2=22.61, p=0.0001) (Table 1). Intestinal disease, which included inflammatory bowel disease, irritable bowel syndrome, Crohn’s disease, and colitis, was also more common among PD patients (9 Controls-8.2%, 26 PD-16.6%, X2=4.390, p=0.0361) (Table 1). There was no difference in subjects’ reports of ulcers (Supp Table 3). Over 60% of PD patients who responded to the question reported experiencing digestive problems in the three months prior to stool collection, significantly more than controls (40 Controls-36.4%, 101 PD-64.3%, X2=22.69, p<0.0001) (Table 1). This difference was driven by increased incidence of constipation in the past three months (4 Controls-3.6%, 65 PD-41.4%) as well as increased incidence of bloating (2 Controls-1.8%, 15 PD-9.6%) and excessive gas (2 Controls-1.8%, 21 PD-13.4%) on the day of stool collection, and it persisted despite decreased incidence of diarrhea over three months (27 Controls-24.5%, 21 PD-13.4%). PD patients were also more likely than controls to report taking medication for digestive problems (16 Controls-14.5%, 47 PD-29.9%, X2=8.086, p=0.0045) (Table 1).
Table 1.
Increased incidence of psychological and gastrointestinal symptoms in PD patients and decreased coffee and alcohol consumption
| Question | Response | Subjects | X2 | p | |
|---|---|---|---|---|---|
| Controls | PD Patients | ||||
| Diagnosed or suspected anxiety | Yes | 11 | 41 | 11.52 | 0.0007 |
| 10.0% | 26.1% | ||||
| No | 98 | 110 | |||
| 89.1% | 70.1% | ||||
| Diagnosed or suspected depression | Yes | 24 | 52 | 5.147 | 0.0233 |
| 21.8% | 33.1% | ||||
| No | 84 | 95 | |||
| 76.4% | 60.5% | ||||
| Diagnosed or suspected sleep problems, insomnia | Yes | 14 | 61 | 22.61 | 0.0001 |
| 12.7% | 38.9% | ||||
| No | 92 | 89 | |||
| 83.6% | 56.7% | ||||
| Experienced digestive problems in the past 3 months | Yes | 40 | 101 | 22.69 | <0.0001 |
| 36.4% | 64.3% | ||||
| No | 58 | 40 | |||
| 52.7% | 25.5% | ||||
| Currently on medication for digestive problems | Yes | 16 | 47 | 8.086 | 0.0045 |
| 14.5% | 29.9% | ||||
| No | 89 | 106 | |||
| 80.9% | 67.5% | ||||
| Diagnosed or suspected IBD, IBS, Crohn’s, or colitis | Yes | 9 | 26 | 4.390 | 0.0361 |
| 8.2% | 16.6% | ||||
| No | 101 | 126 | |||
| 91.8% | 80.3% | ||||
| How much caffeinated coffee do you drink | None | 26 | 40 | 11.61 | 0.0205 |
| 23.6% | 25.5% | ||||
| <2 cups a week | 10 | 27 | |||
| 9.1% | 17.2% | ||||
| 2–6 cups a week | 13 | 16 | |||
| 11.8% | 10.2% | ||||
| 1–2 cups a day | 36 | 55 | |||
| 32.7% | 35.0% | ||||
| 3+ cups a day | 25 | 14 | |||
| 22.7% | 8.9% | ||||
| How much alcohol do you drink | None | 31 | 59 | 19.38 | 0.0016 |
| 28.2% | 37.6% | ||||
| < 2 drinks a week | 47 | 48 | |||
| 42.7% | 30.6% | ||||
| 2–6 drinks a week | 8 | 31 | |||
| 7.3% | 19.7% | ||||
| 1 drink a day | 9 | 7 | |||
| 8.2% | 4.5% | ||||
| 2 drinks a day | 12 | 5 | |||
| 10.9% | 3.2% | ||||
| 3+ drinks a day | 3 | 2 | |||
| 2.7% | 1.3% | ||||
Among our subjects, there was a significant association between reported coffee consumption and disease status (X2=11.61, p=0.0205), with controls reporting greater coffee intake (median 1–2 cups a day) than PD patients (median 2–6 cups a week) (Table 1). The same pattern was observed for alcohol consumption (X2=19.38, p=0.0016) (Table 1). No differences were found between PD patients and controls with regard to smoking history, use of anti-inflammatory drugs, antibiotics, or probiotics. There were also no significant dietary differences, although trends for reduced consumption of vegetables/fruits (X2=5.365, p=0.0684) and nuts (X2=7.353, p=0.0614) among PD patients were present (Supp Table 3).
Significantly higher levels of select stool analytes in PD patients
We first performed a direct comparison of immune- and angiogenesis-related analyte levels in the stool samples from PD patients and controls. Mean levels of 34 of 37 factors were higher in patients than controls, but three, Flt1, IL-1α, and CXCL8, met the threshold for significance (p<0.05) (Table 2).
Table 2.
Comparison of levels of immune and angiogenesis factors in stool from PD patients and controls
| PATIENTS | CONTROLS | |||||||
|---|---|---|---|---|---|---|---|---|
|
| ||||||||
| Panel | Factor | N | Mean (pg/mg) |
Std Dev | N | Mean (pg/mg) |
Std Dev | p-value |
| Angiogenesis | Flt1 | 156 | 5.020 | 4.272 | 110 | 3.957 | 3.059 | 0.0184 |
| PlGF | 156 | 1.439 | 1.132 | 110 | 1.352 | 0.6687 | 0.4328 | |
| Tie2 | 156 | 194.2 | 152.1 | 110 | 181.3 | 103.7 | 0.4112 | |
| VEGF-C | 156 | 117.3 | 108.9 | 110 | 116.7 | 124.4 | 0.9662 | |
| VEGF-D | 156 | 19.49 | 14.50 | 110 | 19.39 | 11.32 | 0.9489 | |
| bFGF | 156 | 0.6937 | 0.5598 | 110 | 0.6165 | 0.4322 | 0.2040 | |
|
| ||||||||
| Chemokine | Eotaxin | 156 | 8.878 | 6.160 | 110 | 8.113 | 5.119 | 0.2697 |
| Eotaxin-3 | 156 | 24.05 | 19.06 | 110 | 22.35 | 20.77 | 0.4877 | |
| IP-10 | 156 | 0.4657 | 0.4559 | 110 | 0.3964 | 0.2818 | 0.1265 | |
| MCP-1 | 156 | 0.3225 | 0.5859 | 110 | 0.2562 | 0.2816 | 0.2195 | |
| MCP-4 | 156 | 4.759 | 3.468 | 110 | 4.214 | 2.508 | 0.1366 | |
| MDC | 156 | 11.56 | 8.549 | 110 | 11.48 | 6.903 | 0.9306 | |
| MIP-1α | 156 | 4.879 | 4.204 | 110 | 4.363 | 3.370 | 0.2673 | |
| MIP-1β | 156 | 2.459 | 2.063 | 110 | 2.236 | 1.832 | 0.3616 | |
| TARC | 156 | 0.7362 | 0.6579 | 110 | 0.7790 | 0.5600 | 0.5781 | |
|
| ||||||||
| Cytokine | IL-12/23 p40 | 156 | 2.634 | 1.779 | 110 | 2.481 | 1.522 | 0.4610 |
| IL-15 | 156 | 0.8354 | 0.6445 | 110 | 0.7519 | 0.6075 | 0.2857 | |
| IL-16 | 156 | 16.34 | 17.50 | 110 | 15.28 | 14.17 | 0.5848 | |
| IL-17A | 156 | 2.955 | 8.555 | 110 | 2.104 | 1.452 | 0.2231 | |
| IL-1α | 156 | 98.99 | 326.8 | 110 | 41.65 | 40.39 | 0.0311 | |
| IL-5 | 156 | 0.7553 | 0.8279 | 110 | 0.7062 | 0.6693 | 0.5926 | |
| IL-7 | 156 | 0.7442 | 0.6159 | 110 | 0.6886 | 0.4264 | 0.3829 | |
| LTA | 155 | 0.4188 | 0.4499 | 110 | 0.4174 | 0.3734 | 0.9778 | |
| VEGF | 155 | 22.36 | 82.51 | 110 | 14.48 | 52.62 | 0.3423 | |
|
| ||||||||
| Proinflammatory | IFNγ | 155 | 11.93 | 27.88 | 110 | 9.68 | 14.49 | 0.3906 |
| IL-10 | 155 | 2.231 | 5.473 | 110 | 1.745 | 2.900 | 0.3487 | |
| IL-13 | 155 | 3.463 | 2.437 | 110 | 3.255 | 1.880 | 0.4305 | |
| IL-1β | 155 | 3.451 | 12.22 | 110 | 1.685 | 2.486 | 0.0810 | |
| IL-2 | 155 | 3.161 | 3.922 | 110 | 2.815 | 2.312 | 0.3664 | |
| IL-4 | 155 | 0.6397 | 0.7944 | 110 | 0.5895 | 0.7576 | 0.6042 | |
| IL-6 | 155 | 3.024 | 6.367 | 110 | 2.660 | 4.818 | 0.5951 | |
| IL-8 | 155 | 41.5 | 149.1 | 110 | 14.0 | 53.5 | 0.0358 | |
| TNF | 155 | 0.7482 | 1.055 | 110 | 0.7787 | 0.9975 | 0.8121 | |
|
| ||||||||
| Vascular Injury | CRP | 155 | 1010 | 2909 | 110 | 547.4 | 1605 | 0.0978 |
| SAA | 155 | 109.1 | 378.7 | 110 | 71.76 | 53.12 | 0.2257 | |
| sICAM-1 | 155 | 19.87 | 44.79 | 110 | 13.22 | 41.83 | 0.2202 | |
| sVCAM-1 | 155 | 22.26 | 22.09 | 110 | 22.61 | 21.50 | 0.8953 | |
Mean protein levels (pg/mg total protein) with standard deviations (Std Dev) in stool homogenates
N = number of measurements for each subject group
Gray shading indicates significant (p<0.05) difference between patients and controls by t-test
To better account for the effects of subjects’ environments on stool analyte levels, we performed a paired comparison of PD patients and their respective non-PD spouses. When all PD patients were compared with all household controls by paired t-test, there were no significant differences in levels of immune or angiogenesis factors. When patient-spouse pairs were separated by patient sex, however, a different pattern emerged. Male PD patients still exhibited no significant differences compared to their female spouses, but female PD patients had higher levels of 11 cytokines, chemokines, and angiogenesis factors compared to male spouses (Table 3).
Table 3.
Comparison of levels of immune and angiogenesis factors in stool from PD patients and their spouses separated by sex
| PATIENT IS FEMALE | PATIENT IS MALE | ||||||||
|---|---|---|---|---|---|---|---|---|---|
|
| |||||||||
| Panel | Factor | N | Mean Dif (pg/mg) |
Std Dev | p-value | N | Mean Dif (pg/mg) |
Std Dev | p-value |
| Angiogenesis | Flt1 | 10 | 1.776 | 3.077 | 0.1013 | 29 | −0.3635 | 4.451 | 0.6635 |
| PlGF | 10 | 0.6796 | 0.6393 | 0.0084 | 29 | −0.2227 | 0.9099 | 0.1982 | |
| Tie2 | 10 | 67.79 | 122.3 | 0.1135 | 29 | 2.117 | 168.1 | 0.9464 | |
| VEGF-C | 10 | 70.45 | 102.4 | 0.0575 | 29 | −34.11 | 101.9 | 0.0824 | |
| VEGF-D | 10 | 8.259 | 9.029 | 0.0178 | 29 | −3.290 | 16.87 | 0.3028 | |
| bFGF | 10 | 0.3046 | 0.3821 | 0.0327 | 29 | −0.04650 | 0.7164 | 0.7291 | |
|
| |||||||||
| Chemokine | Eotaxin | 10 | 4.965 | 5.986 | 0.0277 | 29 | −0.6213 | 6.545 | 0.6132 |
| Eotaxin-3 | 10 | 16.56 | 16.12 | 0.0100 | 29 | −7.192 | 30.08 | 0.2084 | |
| IP-10 | 10 | 0.2133 | 0.3305 | 0.0717 | 29 | −0.01270 | 0.4037 | 0.8672 | |
| MCP-1 | 10 | 0.1473 | 0.3382 | 0.2016 | 29 | −0.03700 | 0.2909 | 0.4993 | |
| MCP-4 | 10 | 1.897 | 3.314 | 0.1037 | 29 | −0.7261 | 2.526 | 0.1328 | |
| MDC | 10 | 5.371 | 6.354 | 0.0255 | 29 | −2.534 | 8.185 | 0.1066 | |
| MIP-1α | 10 | 3.501 | 5.582 | 0.0786 | 29 | −0.2698 | 5.443 | 0.7914 | |
| MIP-1β | 10 | 1.538 | 2.092 | 0.0452 | 29 | −0.2347 | 2.189 | 0.5683 | |
| TARC | 10 | 0.3986 | 0.3828 | 0.0093 | 29 | −0.1299 | 0.7797 | 0.3773 | |
|
| |||||||||
| Cytokine | IL-12/23 p40 | 10 | 0.6052 | 1.692 | 0.2874 | 29 | 0.04700 | 2.013 | 0.9007 |
| IL-15 | 10 | 0.3157 | 0.4257 | 0.0437 | 29 | −0.01490 | 0.8733 | 0.9275 | |
| IL-16 | 10 | 14.05 | 18.52 | 0.0399 | 29 | −2.711 | 12.84 | 0.2652 | |
| IL-17A | 10 | 0.5709 | 1.475 | 0.2521 | 29 | −0.02620 | 1.953 | 0.9429 | |
| IL-1α | 10 | 12.97 | 61.82 | 0.5236 | 29 | 165.9 | 569.2 | 0.1277 | |
| IL-5 | 10 | 0.4791 | 0.5910 | 0.0305 | 29 | −0.08360 | 0.7022 | 0.5268 | |
| IL-7 | 10 | 0.1915 | 0.6243 | 0.3573 | 29 | −0.07800 | 0.6125 | 0.4986 | |
| LTA | 10 | 0.1685 | 0.3000 | 0.1095 | 29 | −0.1451 | 0.6120 | 0.2204 | |
| VEGF | 10 | 34.32 | 90.45 | 0.2608 | 29 | 10.35 | 61.63 | 0.3821 | |
|
| |||||||||
| Proinflammatory | IFNγ | 10 | 7.957 | 13.69 | 0.0993 | 29 | 5.571 | 49.55 | 0.5569 |
| IL-10 | 10 | 0.2590 | 1.876 | 0.6726 | 29 | −0.08170 | 3.761 | 0.9093 | |
| IL-13 | 10 | 0.5898 | 2.791 | 0.5208 | 29 | −0.3801 | 1.872 | 0.2922 | |
| IL-1β | 10 | 1.973 | 6.809 | 0.3833 | 29 | 4.587 | 21.70 | 0.2731 | |
| IL-2 | 10 | 0.7725 | 2.373 | 0.3301 | 29 | −1.030 | 4.445 | 0.2307 | |
| IL-4 | 10 | 0.02340 | 0.4506 | 0.8733 | 29 | −0.1984 | 0.9819 | 0.2944 | |
| IL-6 | 10 | 1.885 | 16.49 | 0.7262 | 29 | −1.142 | 4.731 | 0.2124 | |
| IL-8 | 10 | 4.943 | 22.29 | 0.5009 | 29 | 62.76 | 232.9 | 0.1654 | |
| TNF | 10 | 0.04880 | 0.5317 | 0.7782 | 29 | −0.3561 | 1.385 | 0.1848 | |
|
| |||||||||
| Vascular Injury | CRP | 10 | −671.7 | 2062 | 0.3298 | 29 | 933.4 | 4847 | 0.3173 |
| SAA | 10 | 3.567 | 72.14 | 0.8792 | 29 | −1.229 | 110.4 | 0.9534 | |
| sICAM-1 | 10 | 1.930 | 4.425 | 0.2011 | 29 | 9.393 | 44.03 | 0.2689 | |
| sVCAM-1 | 10 | −1.153 | 14.72 | 0.8099 | 29 | −5.996 | 36.20 | 0.3885 | |
Mean difference (patient – control) between analyte levels (pg/mg total protein) with standard deviations
N = number of measurements for each subject group
Gray shading indicates significant (p<0.05) difference between patients and household controls by paired t-test
Sex significantly impacts stool analyte levels
The household control comparison suggested that subject sex greatly impacted levels of immune and angiogenesis factors in stool. Indeed, when analyte concentrations between female and male subjects were compared, females exhibited significantly higher levels of 21 of 37 factors (Supp Table 4). The relationships between sex and disease status for each analyte were largely consistent, but three factors, PIGF, CXCL10 (IP-10), and CCL2 (MCP-1), were found at higher concentrations in female PD patients compared to female controls while no differences were found between male patients and controls (Supp Fig 1).
BMI, smoking history, and probiotic usage strongly influence stool analyte levels
Other metadata variables also influenced stool analyte levels. Nine chemokines and angiogenesis factors decreased significantly with increasing subject body mass index (BMI) (Supp Fig 2). Subjects who reported smoking at least 100 cigarettes in their lives (~5 packs) had significantly lower levels of eight different cytokines and vascular factors in stool (Supp Fig 3), regardless of disease status. One classically proinflammatory cytokine, IL-6, was significantly reduced with increasing coffee consumption (Supp Fig 4). Consumption of probiotics or probiotic yogurt was associated with significantly higher levels of three analytes, TARC (CCL17), IL-7, and MIP-1β, regardless of disease status (Supp Fig 5a), but an additional eight factors were significantly elevated only in PD patients taking probiotics (Supp Fig 5b). Most of the analytes affected by probiotic use were chemokines.
PD-associated stool inflammatory profile emerges when other factors are accounted for
Given the profound impact of numerous metadata factors on levels of stool analytes, we decided to more specifically evaluate PD-associated inflammatory signatures using a multivariate GLM approach adjusting for 13 metadata parameters. In this analysis, PD disease status was significantly (p<0.05) associated with elevated levels of IL-1α, IL-1β, CXCL8, and CRP in stool. Elevations in Flt1 and PIGF were also trending (p=0.0541). (Table 4).
Table 4.
Association between PD status and levels of stool immune and angiogenesis factors when accounting for potential confounders or effect modifiers
| Panel | Factor | Estimate | 95% Confidence Limits | p-value | |
|---|---|---|---|---|---|
|
| |||||
| Angiogenesis | Flt1 | 1.087 | −0.01908 | 2.192 | 0.0541 |
| PlGF | 1.087 | −0.01908 | 2.192 | 0.0541 | |
| Tie2 | −0.4496 | −39.62 | 38.72 | 0.9820 | |
| VEGF-C | −9.056 | −42.74 | 24.63 | 0.5968 | |
| VEGF-D | −1.289 | −5.128 | 2.551 | 0.5091 | |
| bFGF | 0.01910 | −0.1271 | 0.1653 | 0.7971 | |
|
| |||||
| Chemokine | Eotaxin | 0.1777 | −1.476 | 1.831 | 0.8325 |
| Eotaxin-3 | 0.9905 | −4.683 | 6.663 | 0.7312 | |
| IP-10 | 0.02551 | −0.08694 | 0.1380 | 0.6554 | |
| MCP-1 | 0.01348 | −0.1242 | 0.1511 | 0.8471 | |
| MCP-4 | 0.5197 | −0.4079 | 1.447 | 0.2708 | |
| MDC | −0.7171 | −2.992 | 1.558 | 0.5353 | |
| MIP-1α | −0.7171 | −2.992 | 1.558 | 0.5353 | |
| MIP-1β | 0.08906 | −0.4774 | 0.6555 | 0.7570 | |
| TARC | −0.1315 | −0.3080 | 0.04493 | 0.1433 | |
|
| |||||
| Cytokine | IL-12/23 p40 | 0.02485 | −0.4662 | 0.5159 | 0.9207 |
| IL-15 | 0.1547 | −0.03270 | 0.3421 | 0.1052 | |
| IL-16 | 1.367 | −3.425 | 6.159 | 0.5747 | |
| IL-17A | 0.6550 | −1.319 | 2.629 | 0.5139 | |
| IL-1α | 87.51 | 12.94 | 162.1 | 0.0216 | |
| IL-5 | −0.003209 | −0.2306 | 0.2241 | 0.9778 | |
| IL-7 | −0.004470 | −0.1665 | 0.1576 | 0.9567 | |
| LTA | 0.004860 | −0.1218 | 0.1315 | 0.9398 | |
| VEGF | 19.25 | −2.023 | 40.52 | 0.0759 | |
|
| |||||
| Proinflammatory | IFNγ | 3.607 | −3.413 | 10.63 | 0.3124 |
| IL-10 | 1.296 | −0.04960 | 2.641 | 0.0590 | |
| IL-13 | 0.1148 | −0.5554 | 0.7851 | 0.7360 | |
| IL-1β | 3.015 | 0.2192 | 5.810 | 0.0347 | |
| IL-2 | 0.6627 | −0.3325 | 1.658 | 0.1908 | |
| IL-4 | 0.06967 | −0.1617 | 0.3010 | 0.5535 | |
| IL-6 | 1.415 | −0.2765 | 3.106 | 0.1007 | |
| IL-8 | 40.28 | 4.368 | 76.19 | 0.0281 | |
| TNF | −0.04665 | −0.3570 | 0.2637 | 0.7674 | |
|
| |||||
| Vascular Injury | CRP | 1134 | 411.7 | 1857 | 0.0022 |
| SAA | 1.357 | −82.79 | 85.79 | 0.9747 | |
| sICAM-1 | 7.169 | −5.786 | 20.12 | 0.2767 | |
| sVCAM-1 | 0.4134 | −5.982 | 6.809 | 0.8988 | |
Gray shading indicates significant (p<0.05) association with PD status parameter by multivariate GLM, multiple imputation = 5
PD-associated GI inflammation does not emerge only in advanced disease
Alterations in immune activity occur with aging36, and age is the primary risk factor for development of PD. Additionally, whether intestinal inflammation and dysfunction represent an independent facet of PD pathology or simply a response to increasing neurodegeneration remains unclear. To explore these potential relationships, we evaluated the effects of subject age and PD duration on the levels of immune and angiogenesis factors. A GLM regression of PD duration (age at time of stool collection minus age of PD onset) versus stool analyte levels revealed no significant association for any analyte (Supp Table 5). Mean levels of immune and angiogenesis factors remained consistent from recently diagnosed subjects to individuals who had lived with PD for more than 30 years. A GLM analysis evaluating the effects of subject age and disease status on stool analyte levels identified significant decreases in VEGF-C and IL-6 with increasing age regardless of disease status (Fig 1). Significant differences in the relationships between age and analyte levels for PD patients and controls were identified for MCP-1, TNF, IL-10, and IL-4. Levels of these factors trended toward a decrease with age in PD patients but remained relatively constant with age in controls (Fig 1). While not significant, this same pattern was observed for the majority of analytes measured.
Figure 1. PD patients and controls differ in associations between subject age and levels of stool analytes.
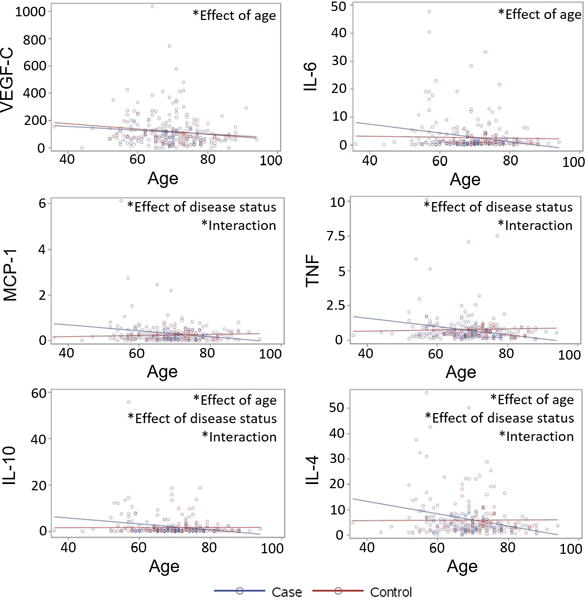
Levels (pg/mg) of analytes in stool homogenates from PD patients (blue) and controls (red) as a function of subject age. Significant (p<0.05) effects of age, disease status, and interactions between the variables by generalized linear model regression.
Discussion
PD patients in this study reported the increased incidence of psychiatric and GI symptoms that is typical of PD. Measurements of stool immune factors indicated that gastrointestinal inflammation is present in these PD patients. This supports and expands upon previous reports of PD-associated dysbiosis, GI dysfunction, and colonic inflammation.
When levels of stool analytes were directly compared in PD patients and controls, Flt1, IL-1α, and CXCL8 were found to be significantly elevated. PD-associated increases in CXCL8 and IL-1α persisted after adjusting for 13 potential confounders or effect modifiers. CXCL8 is a highly proinflammatory molecule with neutrophil chemoattractant as well as angiogenic properties37. IL-1α is a potent initiator of GI inflammation which triggers recruitment of myeloid cells and their production of additional proinflammatory mediators such as IL-1β38. Production of IL-1α and IL-1β are induced in inflammation in part through activity of the transcription factor NF-κB, and, in an amplification loop, they also stimulate NF-κB activity38. In fact, all the inflammatory factors identified in the multivariate analysis as elevated in PD patients – CXCL8, IL-1α, IL-1β, and CRP – are targets for NF-κB transcriptional activity39–41, and, like IL-1 cytokines, CRP also promotes NF-κB activity42. Our results suggest that this immune signaling pathway may be dysregulated in PD, leading to excessive inflammation.
In the multivariate analysis, elevations in angiogenesis-promoting Flt1 (VEGF receptor 1) as well as PIGF in stool from PD patients were trending (p=0.0541) but not significant. Inflammation and angiogenesis are closely linked43 and frequently co-regulated, e.g. by NFκB44. Increased pro-angiogenic factors including VEGF and PIGF have been reported in cerebrospinal fluid from PD patients, and it has been suggested that this promotes the blood-brain barrier dysfunction that has been documented in PD45, 46. Further investigation will be needed to determine whether consistent increases in angiogenic factors are present in the intestine in PD patients and how these might contribute to GI pathology.
The fact that disease-associated patterns in levels of immune factors did not change with PD duration suggests that intestinal inflammation is not exclusively present in advanced disease. PD-associated increases in stool analytes were also not explained by advanced subject age, as, if anything, levels of most analytes trended toward a decrease with age in PD patients. These findings support the hypothesis that intestinal inflammation is an early manifestation of PD that could contribute to the development of neuropathology rather than an effect arising in response to extensive gastrointestinal neurodegeneration.
Direct comparison of levels of stool immune and angiogenesis mediators in PD patients and controls was complicated by other variables. For instance, females were found to have significantly higher levels of most analytes measured compared to males. The minimal number of significant sex-disease status interactions, however, suggests that there is little sex difference in the nature of the impact that PD has on the gut immune environment. Higher levels of immune factors in stool from female subjects, though, could possibly contribute to differences in the severity of symptoms in PD47, 48.
Subject sex also influenced the paired comparison of PD patients with their non-PD spouses, with no differences found between male patients and their female spouses but significantly elevated levels of 11 cytokines, chemokines, and angiogenesis factors in female patients compared to their male spouses. If there were no differences in levels of stool immune and angiogenesis factors between patients and controls, then females should have exhibited significantly higher levels of many analytes regardless of disease status. Instead, only female PD patients exhibited significant elevations compared to their partners, while the levels of stool cytokines, chemokines, and angiogenesis factors in males with PD resembled their female spouses. This supports a disease-associated increase in numerous immune and angiogenesis mediators that persists in a shared environment.
We also observed several interesting patterns in lifestyle factors that can alter stool immune and angiogenesis factor levels. While there were no significant differences reported in diet between PD patients and controls, the trending reductions in fruit and vegetable and nut consumption in PD patients may warrant further investigation, particularly as the immunomodulatory and neuroprotective potential of these foods in the context of neurodegenerative disease is beginning to emerge49, 50. The inverse correlations between BMI and certain stool analyte levels identified in this study may also merit further inquiry. While increased levels of immune and angiogenesis factors have been reported in serum and adipose tissue of overweight and obese subjects51, 52, reductions in serum bFGF and Flt-1 with increasing BMI, such as we observed in stool, have been found53, 54. Furthermore, while increased fecal calprotectin in obese subjects suggests intestinal inflammation55, 56, the relationship between BMI and levels of other immune and angiogenesis mediators in stool has not been explored, and our results suggest that it is complex.
Coffee and alcohol consumption and smoking are all reportedly reduced in PD patients57–61, but whether these findings indicate protective effects of these practices, disease-associated suppression of psychological reward mechanisms59, or simply reduced fluid intake due to dysphagia in advanced disease62 remains undetermined. We observed reduced current coffee intake in our cohort of PD patients as well as reduced current alcohol consumption, in agreement with previous reports. While coffee and caffeine are known to have potent neuroprotective and anti-inflammatory properties57, this study found only a minimal effect of alcohol and coffee consumption on levels of stool immune mediators, with coffee intake inversely associated with IL-6 levels. We found no differences between PD patients and controls in smoking history, but we did observe that having smoked at least 100 cigarettes reduced levels of multiple immune factors in stool. While cigarette smoke may have numerous deleterious effects systemically and in the gut63–65, nicotine is known to have anti-inflammatory effects mediated by nicotinic acetylcholine receptor signaling and resulting in, among other effects, inhibition of NFκB66. Our results indicate that this immunomodulatory activity is prominent in the human gut. Interestingly, the smoking-associated differences we observed persisted even though over 92% of respondents in this study who reported having smoked were not current smokers and had been non-smokers for an average of 36.6 years. This suggests that the modulation of intestinal immune function mediated by smoking may be at least semi-permanent, perhaps aided by lasting alterations in the microbiome59 and by epigenetic modification67.
The higher levels of chemokines and other inflammatory factors associated with probiotic use, especially in PD patients, could have several explanations. Probiotics are thought to stimulate mucosal immune activity, and they may increase the production of chemokines that recruit primarily tolerogenic cell types. We also noted, however, that nearly 60% of controls and 80% of PD patients who reported using probiotics also reported experiencing digestive problems, so it is possible that the elevated levels of immune factors could result primarily from chronic GI problems rather than probiotics taken for their alleviation. A few studies have reported that the use of probiotics can ameliorate constipation in PD patients68, 69; trials measuring biochemical as well as clinical responses to probiotics may clarify whether these are truly a beneficial treatment for individuals with PD. Furthermore, the reciprocal interactions between specific intestinal bacteria, whether transient probiotics or resident commensals, and intestinal immune responses in PD remain to be elucidated and will likely provide greater insight into mechanisms of disease pathology than studies of either factor in isolation.
Our study also corroborates the few reports32–34 of associations between PD and intestinal disease, with significantly more PD patients than controls in our cohort reporting a history of inflammatory bowel disease, irritable bowel syndrome, Crohn’s disease, and/or colitis. The mechanisms responsible for this epidemiological overlap have not been determined. There may be shared genetic predisposition for PD and intestinal disease; variations in the LRRK2 and NOD2 genes are associated with both PD70, 71 and Crohn’s disease72–74. Another possibility is that the chronic inflammatory responses involved in GI diseases promote neuroinflammation and PD-associated neurodegeneration, a concept that is beginning to be tested in animal models7,19. Enteric inflammation and other changes in the GI environment in PD could also contribute to disruption of intestinal immune tolerance and trigger clinical intestinal disease.
This study provides evidence that classic inflammatory processes are overly active in the intestine in PD patients and do not arise only in advanced disease. These could promote systemic and neuroinflammation and, ultimately, parkinsonian neurodegeneration. Because the immune mediators found to be elevated in PD patients would be produced in response to diverse insults, their specificity as biomarkers for PD is limited. Prospective studies would also be needed to determine when these indicators of GI inflammation appear in relation to motor symptoms. However, in combination with key pieces of patient information, it is possible that levels of select immune factors in stool could enable identification of individuals at risk for development of PD. Understanding the connections between intestinal inflammation and systemic and neuroinflammation may yield new insight into the mechanisms of PD pathogenesis and guide future investigations into immunomodulatory therapy that could potentially slow progression of the disease.
Supplementary Material
Acknowledgments
Subject recruitment and characterization, stool and metadata collection, and multiplexed immunoassays were funded by NIH grants NS036960 (H.P.), NS067469 (H.P.), and P50 NS062684 (C.P.Z.). M.G.T. is a member of the Executive Scientific Advisory Board for The Michael J. Fox Foundation for Parkinson’s Research, a member of the Scientific Review Board for the Alzheimer’s Drug Discovery Foundation, and a consultant for Celgene Corporation. E.S.M. is supported by the Riley Family Chair in Parkinson’s Disease.
Financial Disclosures of all authors (for the preceding 12 months)
S.A.F. reports honoraria from Neurocrine, Lundbeck, Auspex/Teva, Avanir, Cynapsus, Adamas, and UCB, grants from Ipsen, Medtronics, Teva, US World Meds, Cynapsus Therapeutics, Solstice, Vaccinex, Voyager, CHDI Foundation, Michael J. Fox Foundation, and NIH, and royalties from Demos, and Blackwell Futura for textbooks.
E.S.M is a consultant for Neurocrine Biosciences, has received speaker’s honoraria from Neurocrine Biosciences and Acadia Pharmaceuticals and has received research grants from Civitas Therapeutics, Kyowa Hakko Kirin, Bristol-Myers Squibb, Biogen, US Word Meds, Pfizer, Michael J Fox Foundation, The Cure Huntington’s Disease Initiative, Parkinson Study Group, Huntington Study Group and NIH.
C.P.Z. is funded by grants from the American Parkinson Disease Association, Department of Veterans Affairs, NIH, and a gift from the Dolsen Foundation. He is a member of the Scientific Advisory Council for the Lewy Body Dementia Association.
H.P. reports NIH grants NS036960 and NS067469, The John T and Juanelle D Strain Endowed Chair, Department of Neurology and School of Medicine of University of Alabama at Birmingham.
V.S.H. reports grants from NIH/NIAID, CDC/NIOSH, US EPA, NIH/NIEHS, NIH, and US DOD.
M.G.T. is a member of the Executive Scientific Advisory Board for The Michael J. Fox Foundation for Parkinson’s Research, a member of the Scientific Review Board for the Alzheimer’s Drug Discovery Foundation, and a consultant for Celgene. Corporation.
HP was funded by NIH grants NS036960 and NS067469, The Strain Endowed Chair, Department of Neurology and School of Medicine of the University of Alabama at Birmingham.
Footnotes
- Research project: A. Conception, B. Organization, C. Execution;
- Statistical Analysis: A. Design, B. Execution, C. Review and Critique;
- Manuscript: A. Writing of the first draft, B. Review and Critique.
- M.C.H.: 1B, 1C, 2A, 2B, 2C, 3A
- J.C.: 1B, 1C, 3B
- S.A.F.: 1A, 1B, 1C, 3B
- E.S.M.: 1A, 1B, 1C, 3B
- C.P.Z.: 1A, 1B, 1C, 3B
- E.M.H.: 1A, 1B, 1C, 3B
- H.P.: 1A, 1B, 1C, 3B
- V.S.H.: 2A, 2B, 2C, 3B
- M.G.T.: 1A, 1B, 2A, 3B
References Cited
- 1.Chen H, Zhao EJ, Zhang W, et al. Meta-analyses on prevalence of selected parkinson’s nonmotor symptoms before and after diagnosis. Transl Neurodegener. 2015;4(1):1. doi: 10.1186/2047-9158-4-1. [DOI] [PMC free article] [PubMed] [Google Scholar]
- 2.Knudsen K, Fedorova TD, Bekker AC, et al. Objective colonic dysfunction is far more prevalent than subjective constipation in parkinson’s disease: A colon transit and volume study. J Parkinsons Dis. 2017;7(2):359–367. doi: 10.3233/JPD-161050. [DOI] [PubMed] [Google Scholar]
- 3.Postuma RB, Gagnon JF, Pelletier A, Montplaisir J. Prodromal autonomic symptoms and signs in parkinson’s disease and dementia with lewy bodies. Mov Disord. 2013;28(5):597–604. doi: 10.1002/mds.25445. [DOI] [PubMed] [Google Scholar]
- 4.Corbille AG, Clairembault T, Coron E, et al. What a gastrointestinal biopsy can tell us about parkinson’s disease? Neurogastroenterol Motil. 2016;28(7):966–974. doi: 10.1111/nmo.12797. [DOI] [PubMed] [Google Scholar]
- 5.Shannon KM, Keshavarzian A, Dodiya HB, Jakate S, Kordower JH. Is alpha-synuclein in the colon a biomarker for premotor parkinson’s disease? Evidence from 3 cases. Mov Disord. 2012;27(6):716–719. doi: 10.1002/mds.25020. [DOI] [PubMed] [Google Scholar]
- 6.Hilton D, Stephens M, Kirk L, et al. Accumulation of alpha-synuclein in the bowel of patients in the pre-clinical phase of parkinson’s disease. Acta Neuropathol. 2014;127(2):235–241. doi: 10.1007/s00401-013-1214-6. [DOI] [PubMed] [Google Scholar]
- 7.Houser MC, Tansey MG. The gut-brain axis: Is intestinal inflammation a silent driver of parkinson’s disease pathogenesis? NPJ Parkinsons Dis. 2017;3:3. doi: 10.1038/s41531-016-0002-0. [DOI] [PMC free article] [PubMed] [Google Scholar]
- 8.Scheperjans F, Aho V, Pereira PA, et al. Gut microbiota are related to parkinson’s disease and clinical phenotype. Mov Disord. 2015;30(3):350–358. doi: 10.1002/mds.26069. [DOI] [PubMed] [Google Scholar]
- 9.Keshavarzian A, Green SJ, Engen PA, et al. Colonic bacterial composition in parkinson’s disease. Mov Disord. 2015;30(10):1351–1360. doi: 10.1002/mds.26307. [DOI] [PubMed] [Google Scholar]
- 10.Hasegawa S, Goto S, Tsuji H, et al. Intestinal dysbiosis and lowered serum lipopolysaccharide-binding protein in parkinson’s disease. PLoS One. 2015;10(11):e0142164. doi: 10.1371/journal.pone.0142164. [DOI] [PMC free article] [PubMed] [Google Scholar]
- 11.Unger MM, Spiegel J, Dillmann KU, et al. Short chain fatty acids and gut microbiota differ between patients with parkinson’s disease and age-matched controls. Parkinsonism Relat Disord. 2016;32:66–72. doi: 10.1016/j.parkreldis.2016.08.019. [DOI] [PubMed] [Google Scholar]
- 12.Tan AH, Mahadeva S, Thalha AM, et al. Small intestinal bacterial overgrowth in parkinson’s disease. Parkinsonism Relat Disord. 2014;20(5):535–540. doi: 10.1016/j.parkreldis.2014.02.019. [DOI] [PubMed] [Google Scholar]
- 13.Cassani E, Barichella M, Cancello R, et al. Increased urinary indoxyl sulfate (indican): New insights into gut dysbiosis in parkinson’s disease. Parkinsonism Relat Disord. 2015;21(4):389–393. doi: 10.1016/j.parkreldis.2015.02.004. [DOI] [PubMed] [Google Scholar]
- 14.Hill-Burns EM, Debelius JW, Morton JT, et al. Parkinson’s disease and parkinson’s disease medications have distinct signatures of the gut microbiome. Mov Disord. 2017;32(5):739–749. doi: 10.1002/mds.26942. [DOI] [PMC free article] [PubMed] [Google Scholar]
- 15.Bedarf JR, Hildebrand F, Coelho LP, et al. Functional implications of microbial and viral gut metagenome changes in early stage l-dopa-naive parkinson’s disease patients. Genome Med. 2017;9(1):39. doi: 10.1186/s13073-017-0428-y. [DOI] [PMC free article] [PubMed] [Google Scholar]
- 16.Hopfner F, Kunstner A, Muller SH, et al. Gut microbiota in parkinson disease in a northern german cohort. Brain Res. 2017;1667:41–45. doi: 10.1016/j.brainres.2017.04.019. [DOI] [PubMed] [Google Scholar]
- 17.Kelly LP, Carvey PM, Keshavarzian A, et al. Progression of intestinal permeability changes and alpha-synuclein expression in a mouse model of parkinson’s disease. Mov Disord. 2014;29(8):999–1009. doi: 10.1002/mds.25736. [DOI] [PMC free article] [PubMed] [Google Scholar]
- 18.Forsyth CB, Shannon KM, Kordower JH, et al. Increased intestinal permeability correlates with sigmoid mucosa alpha-synuclein staining and endotoxin exposure markers in early parkinson’s disease. PLoS One. 2011;6(12):e28032. doi: 10.1371/journal.pone.0028032. [DOI] [PMC free article] [PubMed] [Google Scholar]
- 19.Villaran RF, Espinosa-Oliva AM, Sarmiento M, et al. Ulcerative colitis exacerbates lipopolysaccharide-induced damage to the nigral dopaminergic system: Potential risk factor in parkinson’s disease. J Neurochem. 2010;114(6):1687–1700. doi: 10.1111/j.1471-4159.2010.06879.x. [DOI] [PubMed] [Google Scholar]
- 20.Tokes T, Eros G, Bebes A, et al. Protective effects of a phosphatidylcholine-enriched diet in lipopolysaccharide-induced experimental neuroinflammation in the rat. Shock. 2011;36(5):458–465. doi: 10.1097/SHK.0b013e31822f36b0. [DOI] [PubMed] [Google Scholar]
- 21.Lim S, Chun Y, Lee JS, Lee SJ. Neuroinflammation in synucleinopathies. Brain Pathol. 2016;26(3):404–409. doi: 10.1111/bpa.12371. [DOI] [PMC free article] [PubMed] [Google Scholar]
- 22.Dutkiewicz J, Szlufik S, Nieciecki M, et al. Small intestine dysfunction in parkinson’s disease. J Neural Transm (Vienna) 2015;122(12):1659–1661. doi: 10.1007/s00702-015-1442-0. [DOI] [PMC free article] [PubMed] [Google Scholar]
- 23.Sakakibara R, Odaka T, Uchiyama T, et al. Colonic transit time and rectoanal videomanometry in parkinson’s disease. J Neurol Neurosurg Psychiatry. 2003;74(2):268–272. doi: 10.1136/jnnp.74.2.268. [DOI] [PMC free article] [PubMed] [Google Scholar]
- 24.Rana SV, Sharma S, Malik A, et al. Small intestinal bacterial overgrowth and orocecal transit time in patients of inflammatory bowel disease. Dig Dis Sci. 2013;58(9):2594–2598. doi: 10.1007/s10620-013-2694-x. [DOI] [PubMed] [Google Scholar]
- 25.Mushref MA, Srinivasan S. Effect of high fat-diet and obesity on gastrointestinal motility. Ann Transl Med. 2013;1(2):14. doi: 10.3978/j.issn.2305-5839.2012.11.01. [DOI] [PMC free article] [PubMed] [Google Scholar]
- 26.Chen Y, Yu M, Liu X, et al. Clinical characteristics and peripheral t cell subsets in parkinson’s disease patients with constipation. Int J Clin Exp Pathol. 2015;8(3):2495–2504. [PMC free article] [PubMed] [Google Scholar]
- 27.Anitha M, Reichardt F, Tabatabavakili S, et al. Intestinal dysbiosis contributes to the delayed gastrointestinal transit in high-fat diet fed mice. Cell Mol Gastroenterol Hepatol. 2016;2(3):328–339. doi: 10.1016/j.jcmgh.2015.12.008. [DOI] [PMC free article] [PubMed] [Google Scholar]
- 28.Stolzenberg E, Berry D, Yang D, et al. A role for neuronal alpha-synuclein in gastrointestinal immunity. J Innate Immun. 2017 doi: 10.1159/000477990. [DOI] [PMC free article] [PubMed] [Google Scholar]
- 29.Wang W, Nguyen LT, Burlak C, et al. Caspase-1 causes truncation and aggregation of the parkinson’s disease-associated protein alpha-synuclein. Proc Natl Acad Sci U S A. 2016;113(34):9587–9592. doi: 10.1073/pnas.1610099113. [DOI] [PMC free article] [PubMed] [Google Scholar]
- 30.Allen Reish HE, Standaert DG. Role of alpha-synuclein in inducing innate and adaptive immunity in parkinson disease. J Parkinsons Dis. 2015;5(1):1–19. doi: 10.3233/JPD-140491. [DOI] [PMC free article] [PubMed] [Google Scholar]
- 31.Capaldo CT, Nusrat A. Cytokine regulation of tight junctions. Biochim Biophys Acta. 2009;1788(4):864–871. doi: 10.1016/j.bbamem.2008.08.027. [DOI] [PMC free article] [PubMed] [Google Scholar]
- 32.Lin JC, Lin CS, Hsu CW, Lin CL, Kao CH. Association between parkinson’s disease and inflammatory bowel disease: A nationwide taiwanese retrospective cohort study. Inflamm Bowel Dis. 2016 doi: 10.1097/MIB.0000000000000735. [DOI] [PubMed] [Google Scholar]
- 33.Lai SW, Liao KF, Lin CL, Sung FC. Irritable bowel syndrome correlates with increased risk of parkinson’s disease in taiwan. Eur J Epidemiol. 2014;29(1):57–62. doi: 10.1007/s10654-014-9878-3. [DOI] [PubMed] [Google Scholar]
- 34.Mishima T, Fukae J, Fujioka S, Inoue K, Tsuboi Y. The prevalence of constipation and irritable bowel syndrome in parkinson’s disease patients according to rome iii diagnostic criteria. J Parkinsons Dis. 2017;7(2):353–357. doi: 10.3233/JPD-160982. [DOI] [PMC free article] [PubMed] [Google Scholar]
- 35.Devos D, Lebouvier T, Lardeux B, et al. Colonic inflammation in parkinson’s disease. Neurobiol Dis. 2013;50:42–48. doi: 10.1016/j.nbd.2012.09.007. [DOI] [PubMed] [Google Scholar]
- 36.Bandaranayake T, Shaw AC. Host resistance and immune aging. Clin Geriatr Med. 2016;32(3):415–432. doi: 10.1016/j.cger.2016.02.007. [DOI] [PMC free article] [PubMed] [Google Scholar]
- 37.Heidemann J, Ogawa H, Dwinell MB, et al. Angiogenic effects of interleukin 8 (cxcl8) in human intestinal microvascular endothelial cells are mediated by cxcr2. J Biol Chem. 2003;278(10):8508–8515. doi: 10.1074/jbc.M208231200. [DOI] [PubMed] [Google Scholar]
- 38.Voronov E, Apte RN. Il-1 in colon inflammation, colon carcinogenesis and invasiveness of colon cancer. Cancer Microenviron. 2015;8(3):187–200. doi: 10.1007/s12307-015-0177-7. [DOI] [PMC free article] [PubMed] [Google Scholar]
- 39.Pahl HL. Activators and target genes of rel/nf-kappab transcription factors. Oncogene. 1999;18(49):6853–6866. doi: 10.1038/sj.onc.1203239. [DOI] [PubMed] [Google Scholar]
- 40.Iyer SS, Cheng G. Role of interleukin 10 transcriptional regulation in inflammation and autoimmune disease. Crit Rev Immunol. 2012;32(1):23–63. doi: 10.1615/critrevimmunol.v32.i1.30. [DOI] [PMC free article] [PubMed] [Google Scholar]
- 41.Agrawal A, Cha-Molstad H, Samols D, Kushner I. Overexpressed nuclear factor-kappab can participate in endogenous c-reactive protein induction, and enhances the effects of c/ebpbeta and signal transducer and activator of transcription-3. Immunology. 2003;108(4):539–547. doi: 10.1046/j.1365-2567.2003.01608.x. [DOI] [PMC free article] [PubMed] [Google Scholar]
- 42.Chang JW, Kim CS, Kim SB, Park SK, Park JS, Lee SK. C-reactive protein induces nf-kappab activation through intracellular calcium and ros in human mesangial cells. Nephron Exp Nephrol. 2005;101(4):e165–172. doi: 10.1159/000087940. [DOI] [PubMed] [Google Scholar]
- 43.Haep L, Britzen-Laurent N, Weber TG, et al. Interferon gamma counteracts the angiogenic switch and induces vascular permeability in dextran sulfate sodium colitis in mice. Inflamm Bowel Dis. 2015;21(10):2360–2371. doi: 10.1097/MIB.0000000000000490. [DOI] [PubMed] [Google Scholar]
- 44.Del Prete A, Allavena P, Santoro G, Fumarulo R, Corsi MM, Mantovani A. Molecular pathways in cancer-related inflammation. Biochem Med (Zagreb) 2011;21(3):264–275. doi: 10.11613/bm.2011.036. [DOI] [PubMed] [Google Scholar]
- 45.Janelidze S, Lindqvist D, Francardo V, et al. Increased csf biomarkers of angiogenesis in parkinson disease. Neurology. 2015;85(21):1834–1842. doi: 10.1212/WNL.0000000000002151. [DOI] [PMC free article] [PubMed] [Google Scholar]
- 46.Gray MT, Woulfe JM. Striatal blood-brain barrier permeability in parkinson’s disease. J Cereb Blood Flow Metab. 2015;35(5):747–750. doi: 10.1038/jcbfm.2015.32. [DOI] [PMC free article] [PubMed] [Google Scholar]
- 47.Dahodwala N, Pei Q, Schmidt P. Sex differences in the clinical progression of parkinson’s disease. J Obstet Gynecol Neonatal Nurs. 2016;45(5):749–756. doi: 10.1016/j.jogn.2016.05.002. [DOI] [PMC free article] [PubMed] [Google Scholar]
- 48.Kovacs M, Makkos A, Aschermann Z, et al. Impact of sex on the nonmotor symptoms and the health-related quality of life in parkinson’s disease. Parkinsons Dis. 2016;2016:7951840. doi: 10.1155/2016/7951840. [DOI] [PMC free article] [PubMed] [Google Scholar]
- 49.Pribis P, Shukitt-Hale B. Cognition: The new frontier for nuts and berries. Am J Clin Nutr. 2014;100(Suppl 1):347S–352S. doi: 10.3945/ajcn.113.071506. [DOI] [PubMed] [Google Scholar]
- 50.Hagan KA, Munger KL, Ascherio A, Grodstein F. Epidemiology of major neurodegenerative diseases in women: Contribution of the nurses’ health study. Am J Public Health. 2016;106(9):1650–1655. doi: 10.2105/AJPH.2016.303324. [DOI] [PMC free article] [PubMed] [Google Scholar]
- 51.Silha JV, Krsek M, Sucharda P, Murphy LJ. Angiogenic factors are elevated in overweight and obese individuals. Int J Obes (Lond) 2005;29(11):1308–1314. doi: 10.1038/sj.ijo.0802987. [DOI] [PubMed] [Google Scholar]
- 52.Huber J, Kiefer FW, Zeyda M, et al. Cc chemokine and cc chemokine receptor profiles in visceral and subcutaneous adipose tissue are altered in human obesity. J Clin Endocrinol Metab. 2008;93(8):3215–3221. doi: 10.1210/jc.2007-2630. [DOI] [PubMed] [Google Scholar]
- 53.Zera CA, Seely EW, Wilkins-Haug LE, Lim KH, Parry SI, McElrath TF. The association of body mass index with serum angiogenic markers in normal and abnormal pregnancies. Am J Obstet Gynecol. 2014;211(3):247 e241–247. doi: 10.1016/j.ajog.2014.03.020. [DOI] [PubMed] [Google Scholar]
- 54.Seida A, Wada J, Kunitomi M, et al. Serum bfgf levels are reduced in japanese overweight men and restored by a 6-month exercise education. Int J Obes Relat Metab Disord. 2003;27(11):1325–1331. doi: 10.1038/sj.ijo.0802408. [DOI] [PubMed] [Google Scholar]
- 55.Poullis A, Foster R, Shetty A, Fagerhol MK, Mendall MA. Bowel inflammation as measured by fecal calprotectin: A link between lifestyle factors and colorectal cancer risk. Cancer Epidemiol Biomarkers Prev. 2004;13(2):279–284. doi: 10.1158/1055-9965.epi-03-0160. [DOI] [PubMed] [Google Scholar]
- 56.Spagnuolo MI, Cicalese MP, Caiazzo MA, et al. Relationship between severe obesity and gut inflammation in children: What’s next? Ital J Pediatr. 2010;36:66. doi: 10.1186/1824-7288-36-66. [DOI] [PMC free article] [PubMed] [Google Scholar]
- 57.Wierzejska R. Can coffee consumption lower the risk of alzheimer’s disease and parkinson’s disease? A literature review. Arch Med Sci. 2017;13(3):507–514. doi: 10.5114/aoms.2016.63599. [DOI] [PMC free article] [PubMed] [Google Scholar]
- 58.Zhang D, Jiang H, Xie J. Alcohol intake and risk of parkinson’s disease: A meta-analysis of observational studies. Mov Disord. 2014;29(6):819–822. doi: 10.1002/mds.25863. [DOI] [PubMed] [Google Scholar]
- 59.Derkinderen P, Shannon KM, Brundin P. Gut feelings about smoking and coffee in parkinson’s disease. Mov Disord. 2014;29(8):976–979. doi: 10.1002/mds.25882. [DOI] [PMC free article] [PubMed] [Google Scholar]
- 60.Breckenridge CB, Berry C, Chang ET, Sielken RL, Jr, Mandel JS. Association between parkinson’s disease and cigarette smoking, rural living, well-water consumption, farming and pesticide use: Systematic review and meta-analysis. PLoS One. 2016;11(4):e0151841. doi: 10.1371/journal.pone.0151841. [DOI] [PMC free article] [PubMed] [Google Scholar]
- 61.Hamza TH, Chen H, Hill-Burns EM, et al. Genome-wide gene-environment study identifies glutamate receptor gene grin2a as a parkinson’s disease modifier gene via interaction with coffee. PLoS Genet. 2011;7(8):e1002237. doi: 10.1371/journal.pgen.1002237. [DOI] [PMC free article] [PubMed] [Google Scholar]
- 62.Cassani E, Barichella M, Ferri V, et al. Dietary habits in parkinson’s disease: Adherence to mediterranean diet. Parkinsonism Relat Disord. 2017 doi: 10.1016/j.parkreldis.2017.06.007. [DOI] [PubMed] [Google Scholar]
- 63.Salisbury D, Bronas U. Reactive oxygen and nitrogen species: Impact on endothelial dysfunction. Nurs Res. 2015;64(1):53–66. doi: 10.1097/NNR.0000000000000068. [DOI] [PubMed] [Google Scholar]
- 64.Verschuere S, Bracke KR, Demoor T, et al. Cigarette smoking alters epithelial apoptosis and immune composition in murine galt. Lab Invest. 2011;91(7):1056–1067. doi: 10.1038/labinvest.2011.74. [DOI] [PubMed] [Google Scholar]
- 65.Wang H, Zhao JX, Hu N, Ren J, Du M, Zhu MJ. Side-stream smoking reduces intestinal inflammation and increases expression of tight junction proteins. World J Gastroenterol. 2012;18(18):2180–2187. doi: 10.3748/wjg.v18.i18.2180. [DOI] [PMC free article] [PubMed] [Google Scholar]
- 66.Kalkman HO, Feuerbach D. Modulatory effects of alpha7 nachrs on the immune system and its relevance for cns disorders. Cell Mol Life Sci. 2016;73(13):2511–2530. doi: 10.1007/s00018-016-2175-4. [DOI] [PMC free article] [PubMed] [Google Scholar]
- 67.Wan ES, Qiu W, Baccarelli A, et al. Cigarette smoking behaviors and time since quitting are associated with differential DNA methylation across the human genome. Hum Mol Genet. 2012;21(13):3073–3082. doi: 10.1093/hmg/dds135. [DOI] [PMC free article] [PubMed] [Google Scholar]
- 68.Barichella M, Pacchetti C, Bolliri C, et al. Probiotics and prebiotic fiber for constipation associated with parkinson disease: An rct. Neurology. 2016;87(12):1274–1280. doi: 10.1212/WNL.0000000000003127. [DOI] [PubMed] [Google Scholar]
- 69.Cassani E, Privitera G, Pezzoli G, et al. Use of probiotics for the treatment of constipation in parkinson’s disease patients. Minerva Gastroenterol Dietol. 2011;57(2):117–121. [PubMed] [Google Scholar]
- 70.Zimprich A, Biskup S, Leitner P, et al. Mutations in lrrk2 cause autosomal-dominant parkinsonism with pleomorphic pathology. Neuron. 2004;44(4):601–607. doi: 10.1016/j.neuron.2004.11.005. [DOI] [PubMed] [Google Scholar]
- 71.Bialecka M, Kurzawski M, Klodowska-Duda G, et al. Card15 variants in patients with sporadic parkinson’s disease. Neurosci Res. 2007;57(3):473–476. doi: 10.1016/j.neures.2006.11.012. [DOI] [PubMed] [Google Scholar]
- 72.Barrett JC, Hansoul S, Nicolae DL, et al. Genome-wide association defines more than 30 distinct susceptibility loci for crohn’s disease. Nat Genet. 2008;40(8):955–962. doi: 10.1038/NG.175. [DOI] [PMC free article] [PubMed] [Google Scholar]
- 73.Hugot JP, Chamaillard M, Zouali H, et al. Association of nod2 leucine-rich repeat variants with susceptibility to crohn’s disease. Nature. 2001;411(6837):599–603. doi: 10.1038/35079107. [DOI] [PubMed] [Google Scholar]
- 74.Ogura Y, Bonen DK, Inohara N, et al. A frameshift mutation in nod2 associated with susceptibility to crohn’s disease. Nature. 2001;411(6837):603–606. doi: 10.1038/35079114. [DOI] [PubMed] [Google Scholar]
Associated Data
This section collects any data citations, data availability statements, or supplementary materials included in this article.