Abstract
Thus far, only 5–15% of AML patients aged ≥60 years are cured with chemotherapy. Identification of patients who are less (more) likely to respond to standard chemotherapy might enable early risk stratification toward alternative treatment regimens. We used a next-generation sequencing panel of 80 cancer- and/or leukemia-associated genes to profile molecularly 423 older patients with de novo AML. Using variables identified in multivariable models and co-occurring mutations in NPM1-mutated AML, we classified the patients into good-, intermediate- and poor-risk groups for complete remission (CR) attainment, disease-free (DFS) and overall survival (OS). Whereas 81% of good-risk patients (comprising NPM1-mutated patients harboring mutations in chromatin remodeling, cohesin complex, methylation-related, spliceosome, and/or RAS pathway genes, FLT3-TKD, and/or patients without FLT3-ITD) achieved a CR, only 32% of poor-risk patients (with U2AF1, WT1 mutations and/or complex karyotype) did. Intermediate-risk patients had a 50% CR rate. Similarly, using NPM1 co-mutation patterns and SF1 mutation status, we identified patients with favorable DFS and OS 3-year rates of 46% and 45%, respectively. Patients with adverse genetic features had DFS and OS rates of only 2% and 4%. We show that application of our proposed criteria may refine the 2017 European LeukemiaNet classification for older patients treated with chemotherapy.
INTRODUCTION
Only five decades ago, acute myeloid leukemia (AML) was considered incurable. Although the introduction of cytarabine and daunorubicin in the 1960s and 1970s, respectively, changed the fate of many younger AML patients, intensive approaches to treat the AML of older patients (aged ≥60 years) were limited. Despite changes in treatment regimens, the patient’s age (and the corresponding treatment intensity) remains one of the most important prognostic factors in AML. Whereas approximately 40% of adult patients under the age of 60 years will be cured of their leukemia, only 5 to 15% of AML patients who are ≥60 years will.1,2
Recently, large studies assessing biologic and prognostic significance of multiple gene mutations have increased our understanding of the molecular features of AML.3–6 A combination of cytogenetic analysis and mutation testing has been integrated into the classification and risk assessment of AML patients.2–12 However, recent advances in the understanding of the molecular alterations in AML pertain mostly to younger patients, who represent the minority of cases suffering from this disease, as almost all large studies have been performed in patients <60 years of age.3–5,12 As the frequencies of pretreatment cytogenetic abnormalities and gene mutations differ between patients aged <60 years and those ≥60 years of age, as does the prognostic significance of some chromosome abnormalities and gene mutations,13–16 AML in older patients needs to be evaluated separately.
The aim of our study was to determine whether specific molecular and cytogenetic features can be used to identify those older patients with de novo AML who are more (or less) likely to respond to standard cytarabine/daunorubicin-based chemotherapy. Therefore, we used a next-generation sequencing panel of 80 important cancer- and/or leukemia-associated genes to molecularly profile 423 adult patients with de novo AML aged 60 years or older, none of whom received allogeneic or autologous stem cell transplantation (SCT) in first complete remission (CR). We performed outcome analyses to assess the impact of identified gene mutations, cytogenetic aberrations and pretreatment clinical features on the achievement of CR, and disease-free (DFS) and overall survival (OS) of the patients.
METHODS
Patients, treatment, and cytogenetic studies
Pretreatment bone marrow (BM) or peripheral blood (PB) samples containing ≥20% leukemic blasts suitable for next-generation sequencing were obtained from 423 adults aged 60 years or older who were diagnosed with de novo AML (excluding acute promyelocytic leukemia and core-binding factor AML). Patients with secondary or treatment-related AML were not included. The patients were treated on Cancer and Leukemia Group B (CALGB) trials described in the Supplementary Information. CALGB is now a part of Alliance for Clinical Trials in Oncology (Alliance). No patient received SCT in first CR. Patients with early death (death within 30 days of starting therapy) were excluded from the study. Cytogenetic analyses of pretreatment BM and/or PB samples were performed by CALGB/Alliance approved institutional laboratories, and the results were confirmed by central karyotype review.17 For the patient’s karyotype to be regarded as normal, at least 20 metaphases from pretreatment BM specimens subjected to short-term (24–48 hour) cultures had to have been analyzed and no clonal abnormalities found. Patients provided study-specific written informed consent to participate in treatment studies (see Supplementary Information), CALGB 8461 (cytogenetic studies), CALGB 9665 (leukemia tissue bank) and CALGB 20202 (molecular studies), which involved collection of pretreatment BM aspirates and PB samples. Study protocols were in accordance with the Declaration of Helsinki and approved by the institutional review boards at each center.
Statistical analysis
Definitions of the clinical endpoints–CR, DFS and OS–are provided in the Supplementary Information. A mutation frequency cutoff of ≥2% or at least eight patients was used for inclusion in the univariable outcome analyses, with P-values adjusted to control for per family error rate (probability of a Type I error). The families were all variables considered in each outcome analyses so only variables that were significant with a likelihood ratio test P-value <0.20 adjusted from the univariable models were considered in the multivariable analysis (see Supplementary Information). A backward selection technique was used to build the final model for achievement of CR, DFS and OS.18 For time-to-event analyses, we calculated survival estimates using the Kaplan-Meier method,19 and compared groups using the Cox proportional hazard regression models.18 P-values presented in the Kaplan-Meier curves were determined with the log-rank test. A P-value of ≤0.05 was considered statistically significant. The dataset was locked on January 21, 2016. Data collection and statistical analyses were performed by the Alliance Statistics and Data Center.
Molecular analyses
Mononuclear cells were enriched through Ficoll-Hypaque gradient centrifugation and cryopreserved until use. Genomic DNA was extracted using the DNeasy Blood and Tissue Kit (QIAGEN, Hilden, Germany). The mutational status of 79 protein-coding genes was determined centrally at The Ohio State University by targeted amplicon sequencing using the MiSeq platform (Illumina, San Diego, CA; see Supplementary Information for details). In addition, CEBPA mutations were determined by Sanger sequencing,20 resulting in 80 gene mutations analyzed in our study. Gene mutations were assigned to functional groups similar to those previously described by the Cancer Genome Atlas Research Network3 as follows: chromatin remodeling (ASXL1, BCOR, BCORL1, EZH2 and SMARCA2), cohesin complex (RAD21, SMC1A, SMC3 and STAG2), kinases [AXL, FLT3 internal tandem duplications (FLT3-ITD), FLT3 tyrosine kinase domain mutations (FLT3-TKD), KIT and TYK2], methylation-related (DNMT3A, IDH1/2, and TET2), NPM1 (NPM1), RAS pathway (CBL, KRAS, NRAS and PTPN11), spliceosome (SF3B1, SRSF2, U2AF1 and ZRSR2), transcription factors (CEBPA, ETV6, GATA2, IKZF1, NOTCH1 and RUNX1) and tumor suppressors (PHF6, TP53 and WT1). A gene was included in the functional group if the mutation frequency in the total cohort was ≥2%.
RESULTS
Clinical outcome and molecular features of older patients with de novo AML
The clinical characteristics of our patient cohort are shown in Table 1. The median age was 69 years (range, 60–85 years). Forty-one percent of our patients were female.
Table 1.
Pretreatment clinical characteristics and outcome of older patients with de novo acute myeloid leukemia
| Characteristic | Patients (n=423) |
|---|---|
| Age, years | |
| Median | 69 |
| Range | 60–85 |
|
| |
| Sex, female, n(%) | |
| 172 (41) | |
|
| |
| Race, n (%) | |
| White | 381 (92) |
| Nonwhite | 33 (8) |
|
| |
| Hemoglobin, g/dl | |
| Median | 9.3 |
| Range | 3.0–15.0 |
|
| |
| Platelet count, × 109/l | |
| Median | 63 |
| Range | 4–989 |
|
| |
| WBC count, × 109/l | |
| Median | 21.1 |
| Range | 0.6–450.0 |
|
| |
| Blood blasts, % | |
| Median | 43 |
| Range | 0–99 |
|
| |
| Bone marrow blasts, % | |
| Median | 66 |
| Range | 0–97 |
|
| |
| Extramedullary involvement, n (%) | 85 (22) |
|
| |
| Complete remission, n (%) | 233 (55) |
|
| |
| Disease-free survival | |
| Median, months | 7.3 |
| % Disease-free at 1 year (95% CI) | 33 (27–40) |
| % Disease-free at 3 years (95% CI) | 14 (10–19) |
| % Disease-free at 5 years (95% CI) | 11 (8–16) |
|
| |
| Overall survival | |
| Median, months | 9.4 |
| % Alive at 1 year (95% CI) | 39 (35–44) |
| % Alive at 3 years (95% CI) | 14 (11–18) |
| % Alive at 5 years (95% CI) | 10 (7–13) |
Abbreviations: n, number; WBC, white blood cell count.
The outcome of our older AML patient cohort was generally poor (Table 1). Only 55% of patients achieved a CR following induction therapy. Of those patients who did, only 14% were disease-free 3 years after diagnosis. The median DFS was 7.3 months. The OS of older AML patients was equally poor, with a median OS of 9.4 months, and only 14% of patients being alive at 3 years.
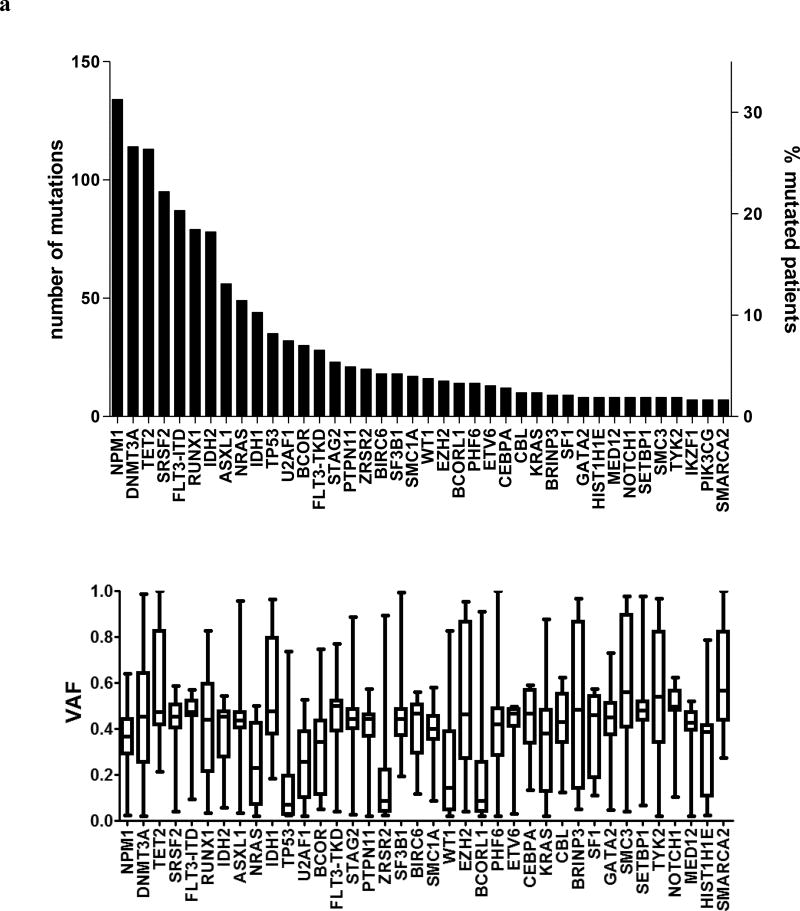
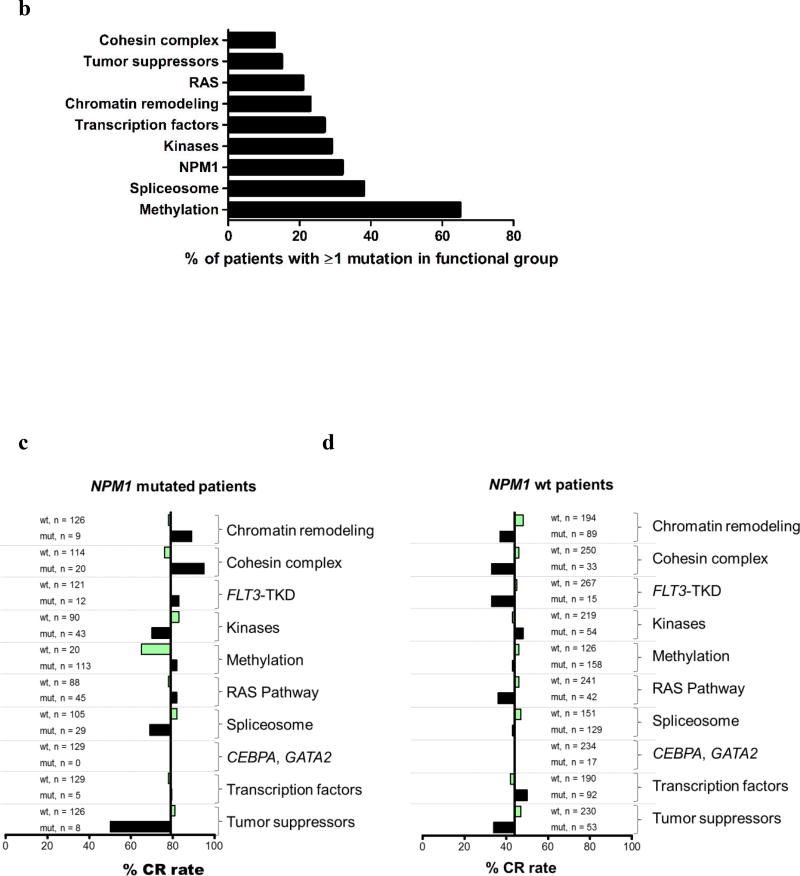
We detected 1377 mutations, with a median of 3 mutations per patient (range, 0–8). The frequencies of detected gene mutations, gene functional groups and cytogenetic findings are shown in Supplementary Tables S1–S3. Only 28 genes were mutated in ≥2% of patients (Figure 1A), another 14 in 1–2%, and 11 genes in <1% of the patients, with 27 genes having no mutations (Supplementary Table S1). The most frequent were mutations in NPM1 (32% of patients), DNMT3A (27%), and TET2 (27%, Figure 1a). Among previously defined functional groups, mutations involving methylation-related genes (found in 65% of patients), the spliceosome (38%) and NPM1 (32%) were predominant (Figure 1b, Supplementary Table S2). Almost one-half of the patients in our cohort, 46%, had normal cytogenetics and 13% harbored a complex karyotype. No other cytogenetic group comprised >10% of patients (Supplementary Table S3).
Figure 1.
(a) Upper panel. Bar graph depicting the total number of mutations detected in individual genes (left Y-axis), as well as the percentage of patients with these mutations in our total patient cohort (right Y-axis). Lower panel, box and whiskers plots indicating the variant allele fractions (VAF), with which the mutations were detected in our AML patient set. The horizontal line within each box represents the median VAF, the box encloses the 25th–75th percentiles, and the whiskers represent the range. (b) Bar graph depicting the frequency of mutations in the functional groups, sorted by ascending frequencies. (c) Bar graphs showing the differential impact of co-occurring mutations on the positive prognostic impact of NPM1. The X-axis depicts the CR rates, with the vertical line showing the median CR rate of all NPM1-mutated AML patients (79%). Bars depict how the wild-type (wt, bars in light green) or mutated (mut, bars in black) status of co-occurring mutations in the different functional groups affect the CR rates of NPM1-mutated patients. (d) Bar graphs showing the differential impact of co-occurring mutations on the CR rates of patients with wild-type NPM1 genes. The X-axis depicts the CR rates of NPM1 wt AML patients, with the vertical line showing the median CR rate of 44%. Bars depict how the wild-type (wt, bars in light green) or mutated (mut, bars in black) status of co-occurring mutations in the different functional groups affect the CR rates of NPM1 wt patients.
Impact of gene mutations and cytogenetic features on outcome
Given the generally poor treatment outcomes of older AML patients, identification of patients who benefit from current treatment approaches, and those who do not and hence should receive alternative treatment regimens instead, is of utmost importance. Thus, we assessed the prognostic significance of the detected gene mutations and cytogenetic features using multivariable analysis.
In multivariable analysis of factors associated with the achievement of CR, mutated NPM1 (P<0.001) and the presence of a normal karyotype (P=0.03) were associated with higher probability of CR attainment (Table 2). Conversely, the presence of U2AF1 mutations (P=0.03) or WT1 mutations (P=0.01) were associated with lower CR rates.
Table 2.
Multivariable outcome analyses of older patients with de novo acute myeloid leukemia
| Variables in final model | Complete remission | Disease-free survival | Overall survival | |||
|---|---|---|---|---|---|---|
| OR (95% CI) | P-valuea | HR (95% CI) | P-valuea | HR (95% CI) | P-valuea | |
| NPM1, mutated vs wild-type | 3.46 (2.01–5.97) | <0.001 | 0.60 (0.45–0.81) | <0.001 | 0.55 (0.44–0.69) | <0.001 |
| U2AF1, mutated vs wild-type | 0.40 (0.18–0.90) | 0.03 | ||||
| WT1, mutated vs wild-type | 0.22 (0.07–0.71) | 0.01 | ||||
| Normal karyotype, present vs absent mutated v wild-type | 1.70 (1.06–2.74) | 0.03 | ||||
| SF1, mutated vs wild-type | ||||||
| FLT3-ITD, present vs absent | 2.30 (1.62–3.26) | <0.001 | 1.85 (1.43–2.39) | <0.001 | ||
| WBC, per 50-unit increase | 1.22 (1.06–1.41) | 0.007 | ||||
| Complex karyotype,b present vs absent | 4.21 (2.45–7.21) | <0.001 | 1.78 (1.24–2.55) | 0.002 | ||
| BCOR, mutated vs wild-type | 1.82 (1.23–2.69) | 0.003 | ||||
| TP53, mutated vs wild-type | 1.91 (1.25–2.93) | 0.003 | ||||
| t(9;11), present vs absent | 2.19 (1.07–4.47) | 0.03 | ||||
Abbreviations: CI, confidence interval; FLT3-ITD, internal tandem duplication of the FLT3 gene; HR, hazard ratio; OR, odds ratio; WBC, white blood cell count.
An OR <1 (>1) means lower (higher) CR rate for first category listed of a dichotomous variable or higher values of a continuous variable. A HR >1 (<1) corresponds to a higher (lower) risk for first category listed of a dichotomous variable or higher values of a continuous variable. A limited backward selection technique was used to build the final model for achievement of complete remission, disease-free and overall survival. Variables considered in the model were variables that were significant at the likelihood ratio test P-value <.20 from the univariable models (detailed in the Supplementary Information).
P-values for CR were determined by logistic regression. P-values for DFS and OS were determined using Cox proportional hazards regression.
Complex karyotype is defined by the presence of ≥3 chromosome aberrations.
In multivariable analysis for DFS, the presence of NPM1 mutations (P<0.001) and SF1 mutations (P=0.04) associated with longer DFS, with 22% of NPM1-mutated patients and 40% of SF1-mutated patients being disease-free 3 years after diagnosis, compared with 8% of patients who did not harbor these mutations. The presence of FLT3-ITD (P<0.001), complex karyotype (P<0.001) and higher WBC counts (P=0.007) were associated with shorter DFS (Table 2).
In the multivariable analyses for OS, the presence of NPM1 mutations was the only feature associated with longer survival (P<0.001). On the other hand, FLT3-ITD (P<0.001), BCOR mutations (P=0.003), TP53 mutation (P=0.003), t(9;11)(p22;q23) (P=0.03) and complex karyotype (P=0.002) were associated with poor OS (Table 2).
The influence of coexisting mutations on the favorable prognostic impact of NPM1 mutations
We noted that CR rates of NPM1-mutated patients varied from 50% to 95% depending on the presence or absence of specific mutations coexisting with mutations in the NPM1 gene (Figure 1c). NPM1-mutated patients who additionally harbored a mutation in the chromatin remodeling gene or cohesin complex gene had CR rates of 89% and 95%, respectively. NPM1-mutated patients with simultaneous FLT3-TKD had a CR rate of 83%, and those with mutations in the methylation-related or RAS pathway genes had a CR rate of 82%. In contrast, CR rates of NPM1-mutated patients were reduced by the presence of tumor suppressor mutations (to 50%), kinase mutations other than FLT3-TKD (70%), the absence of any methylation-related mutation (65%), or the presence of a spliceosome mutation (69%). Interestingly, several of the mutations that enhanced the positive prognostic impact of NPM1 mutations had an adverse prognostic effect in patients with wild-type NPM1 (Figure 1d). Specifically co-occurring mutations in chromatin remodeling genes, cohesin complex genes, FLT3-TKD or RAS pathway genes further lowered the overall CR rate of NPM1 wild-type patients from 44% to, respectively, 37%, 33%, 33% and 36%.
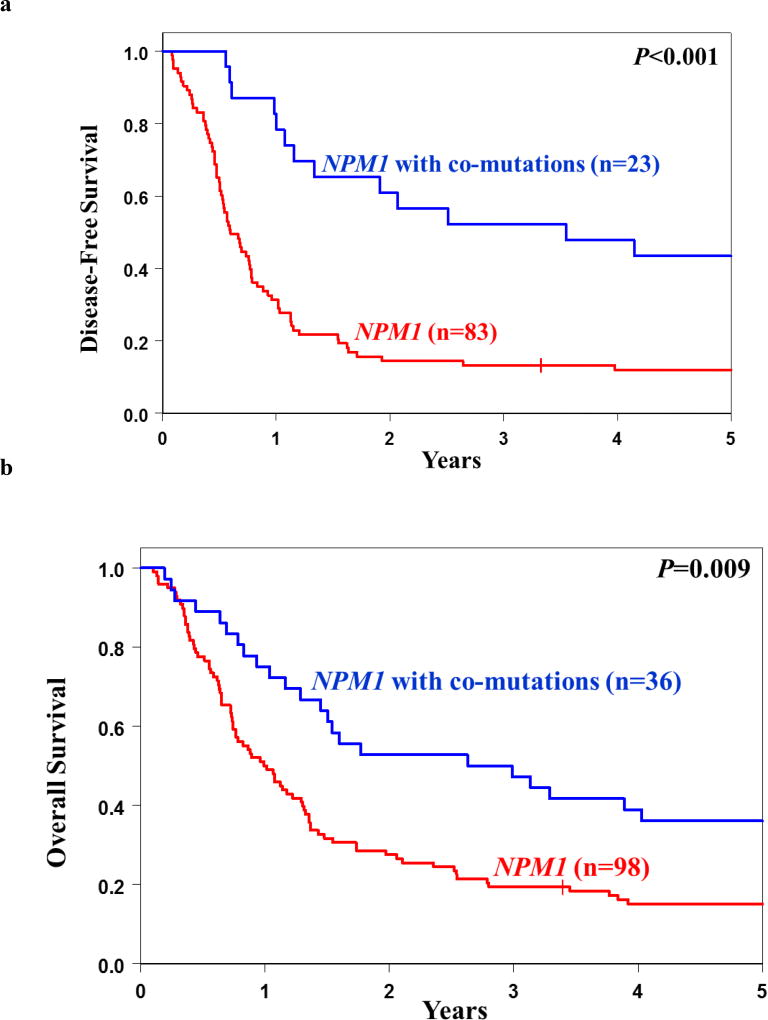
Similarly, we assessed the prognostic impact of co-occurring mutations on DFS and OS. For DFS, the subset analysis identified a patient group with favorable prognosis that included patients with the following mutation combinations: NPM1/ASXL1, NPM1/SF1, NPM1/SMC1A or NPM1/SRSF2. These patients had a 52% chance to be alive and disease-free at 3 years, compared with only 13% of NPM1-mutated patients without any of these co-existing mutations (P<0.001, Figure 2a). Similarly, patients harboring NPM1/ASXL1, NPM1/IDH2, NPM1/SF1 or NPM1/SRSF2 tended to fare better with respect to their OS at 3 years than did NPM1-mutated patients without those co-occurring mutations (47% vs 19%, P=0.009, Figure 2b). Of note, only IDH2 R140 mutations, but not IDH2 R172 mutations, co-occurred with NPM1.
Figure 2.
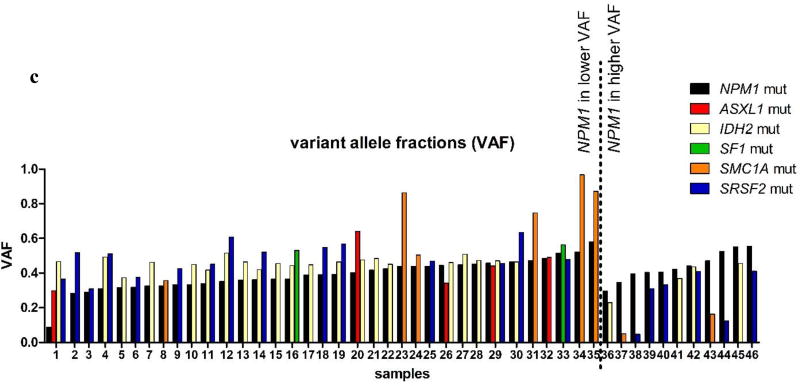
(a) Disease-free survival (DFS) and (b) overall survival (OS) of NPM1-mutated patients stratified by the presence or absence of co-occurring mutations. The blue line represents patients harboring positive predictive marker in addition to the NPM1 mutation (DFS co-mutations: ASXL1, SF1, SMC1A and SRSF2; OS co-mutations: ASXL1, IDH2, SF1 and SRSF2) and red line represents NPM1-mutated patients without those co-mutations. (c) Variant allele fractions (VAFs) of NPM1 and co-occurring mutations in individual patient samples. NPM1 mutations (black bars) were typically observed at lower VAFs than co-occurring mutations (colored bars), suggesting that the NPM1 mutations are later mutational events.
Mutations in the ASXL1, IDH2, SF1, SMC1A, and SRSF2 genes are all early events, which have been previously implicated in clonal hematopoiesis. In our study, mutations in these genes frequently occurred at higher VAFs than the co-occurring NPM1 mutations (Figure 2c). In line with previous reports,4,21 this suggests that the mutation in NPM1 is acquired later during hematopoiesis, thereby possibly changing the fate of the leukemic clone with respect to its responsiveness to therapy.
Genetic risk stratification of older patients with AML
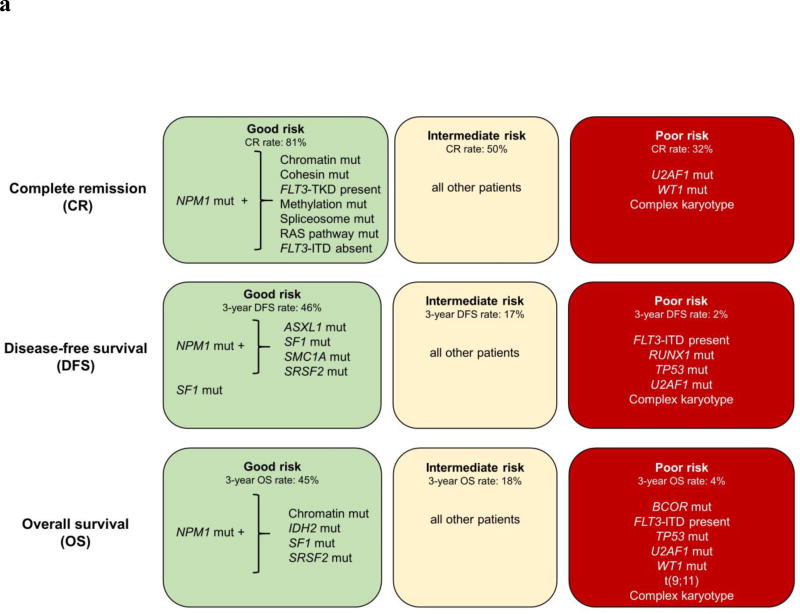
Using the variables identified in our univariable and multivariable models, refined by the consideration of the presence or absence of co-occurring mutations in NPM1-mutated AML, we classified the patients into good-, intermediate- and poor-risk groups with respect to their chance of achieving a CR following standard induction chemotherapy (Figure 3a). The good-risk group included NPM1-mutated patients that simultaneously harbored mutations in chromatin remodeling genes, the cohesin complex, FLT3-TKD, methylation-related genes, spliceosome genes, RAS pathway genes, and/or patients that were NPM1 mutated and did not harbor FLT3-ITD mutations (n=127, 30% of the patient cohort). The poor-risk group was characterized by patients harboring U2AF1 mutations, WT1 mutations and/or patients with typical complex karyotype or sole trisomy of chromosome 11 (n=95, 22% of patient cohort). Typical complex karyotype denotes karyotype with ≥3 abnormalities that include abnormalities resulting in loss of chromosome material from 5q, 7q and/or 17p; atypical complex karyotype therefore is one that does not contain the aforementioned abnormalities.22,23 The intermediate-risk group comprised all remaining patients (n=201, 48%). While 81% (103/127) of patients in the good-risk group achieved a CR, only 32% (30/95) of patients in the poor-risk group attained a CR. Patients with intermediate risk (who did not harbor any of the positive or negative markers) had a CR rate of 50% (100/201).
Figure 3.
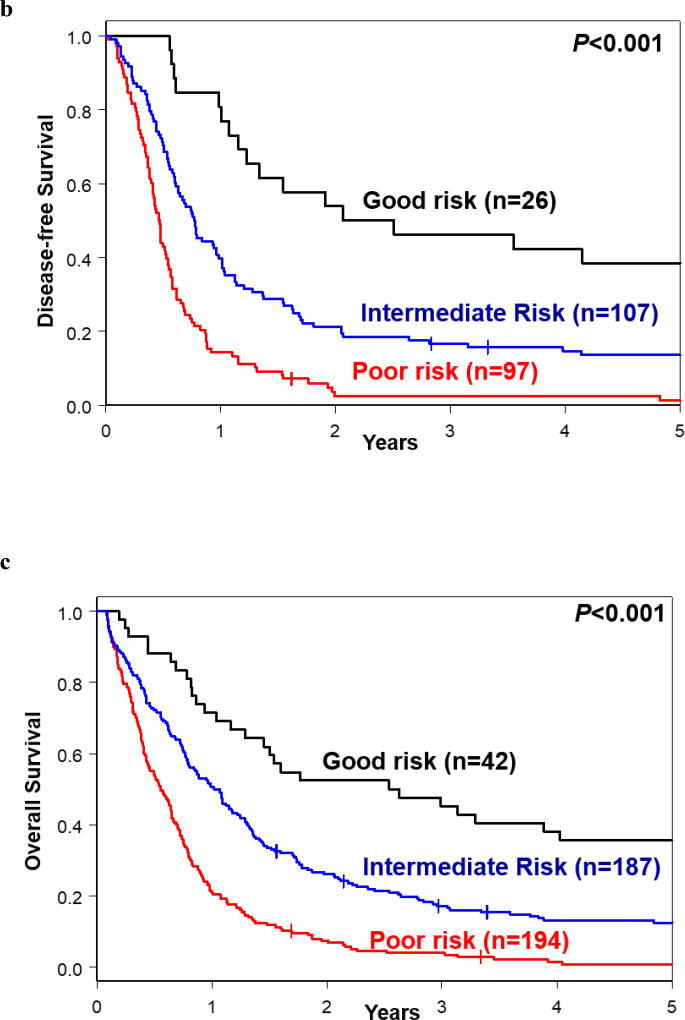
(a) Genetic risk stratification schema of AML patients for complete remission (CR), disease-free survival (DFS) and overall survival (OS). (b) DFS and (c) OS based on the proposed risk stratification into good-, intermediate- and poor-risk groups.
However, the promising CR rate of the good-risk group did not lead to an equally good survival. In fact, 82% of patients in the good-risk group experienced relapse of their disease, which is the same as the relapse rate of the intermediate-risk group (82%), and only slightly better than the 93% relapse rate of the poor-risk group (data not shown).
Nonetheless, we were able to identify subsets of patients with relatively good outcome with respect to DFS and OS. The DFS good-risk group was comprised of NPM1-mutated patients that additionally harbored mutations in ASXL1, SF1, SMC1A or SRSF2, as well as SF1-mutated patients with wild-type NPM1. Those patients exhibited DFS rates of 46% at 3 years, compared with only 10% of the remaining patient cohort (P<0.001; Figure 3b). The good-risk group for OS was defined by NPM1-mutated patients that also harbored mutations in chromatin remodeling genes, IDH2, SF1 and/or SRSF2. They had 3-year OS rate of 45%, compared with an OS rate of only 11% in patients that did not harbor any of the aforementioned mutations (P<0.001; Figure 3c).
When specifically considering the genetic features associated with poor DFS and OS in both uni- and multivariable analyses [DFS: the presence of FLT3-ITD, RUNX1, TP53 or U2AF1 mutations and/or typical or atypical complex karyotype; OS: the presence of BCOR mutations, FLT3-ITD, TP53, U2AF1 or WT1 mutations, t(9;11), and/or typical complex karyotype], we further identified a patient subset with especially poor prognosis. Only 2% of patients with any of these high-risk features were disease-free (Figure 3b) and only 4% were alive at 3 years after study enrollment (Figure 3c). The summary of our risk-stratification schema is depicted in Figure 3a.
Comparison of the proposed genetic risk stratification of older patients with AML with the 2017 European LeukemiaNet (ELN) classification
The recommendations of the European LeukemiaNet for diagnosis and management of AML in adults are widely accepted by physicians and investigators. A recent, updated in 2017, version of the ELN recommendations contains a modified 3-group risk-stratification system based on the presence or absence of specific chromosome abnormalities and mutations in selected genes.9
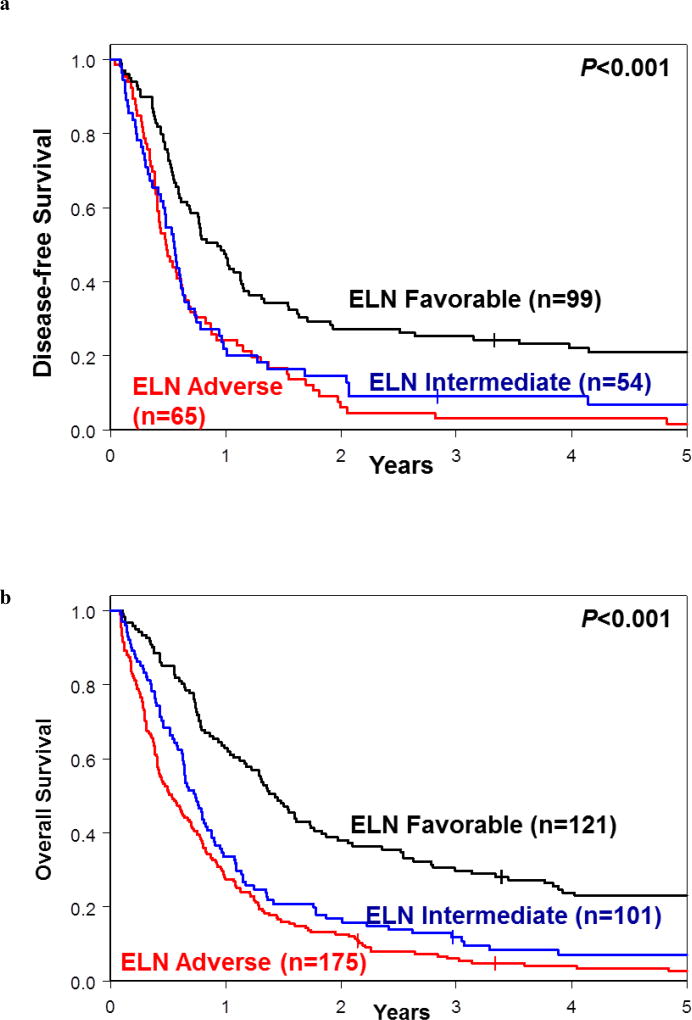
To compare how effectively each of these classifications can stratify the patients into genetic-risk groups, we first applied the revised 2017 ELN classification to 397 patients in our cohort (the remaining 26 patients were not classifiable because of missing data). As Figure 4 illustrates, the modified ELN Favorable-risk groups (i.e., without CBF-AML patients who are not included in our study) comprised almost four times as many patients for DFS and three times as many patients for OS than the respective good-risk groups for DFS and OS in our proposed genetic classification (Figure 3b and c). Moreover, there was almost no separation between Kaplan-Meier curves representing the ELN Intermediate- and ELN Adverse-risk groups for both DFS and OS (Figure 4). The 3-year DFS rates were 25% for the modified ELN Favorable group, 9% for ELN Intermediate, and 3% for ELN Adverse-risk groups. The respective 3-year OS rates were 30%, 12% and 6% (Supplementary Table S4). In contrast, in our risk classification 3-year DFS rates were 46% for our good-risk group, 17% for the intermediate-risk group, and 2% for the poor-risk group. Likewise, 3-year OS rates of patients classified using our criteria were 45% for the good-risk, 18% for the intermediate-risk, and 4% for the poor-risk groups (Figure 3a).
Figure 4.
Outcome of patients classified into the Favorable-, Intermediate- and Adverse-risk groups using the 2017 European LeukemiaNet (ELN) criteria.9 (a) Disease-free survival and (b) overall survival.
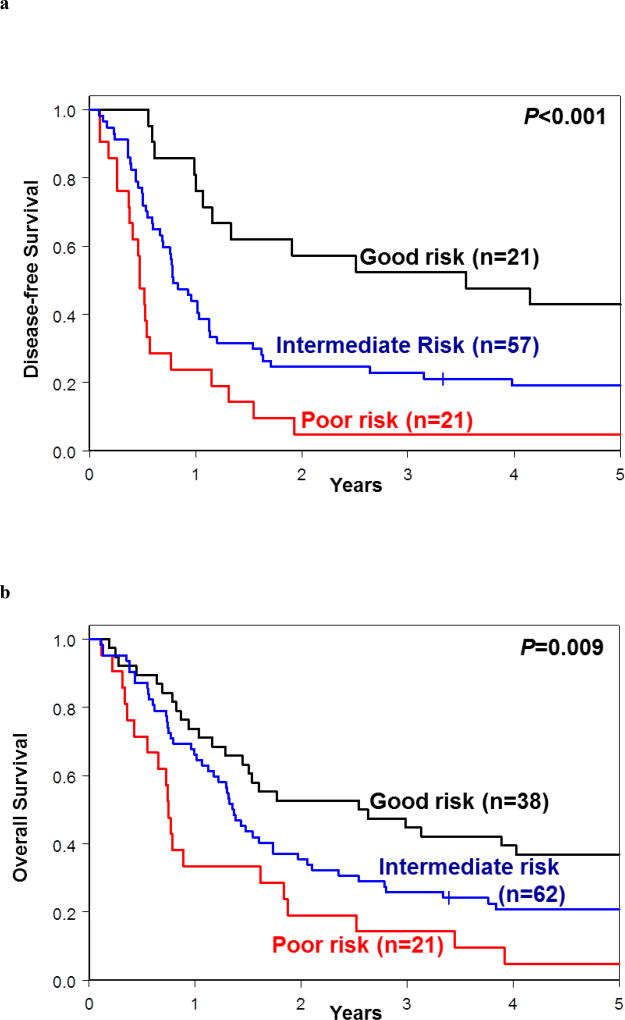
We then applied criteria used in our proposed model to patients included in each of the 2017 ELN risk groups. The use of our model resulted in splitting the modified 2017 ELN Favorable-risk group into three: the good-risk group (comprising 21 patients for DFS and 38 for OS); the intermediate-risk group (comprising 57 and 62 patients, respectively) and the poor-risk group (comprising 21 patients for both DFS and OS). The 3-year DFS rates were 52% in the good-risk group, 23% in the intermediate-risk group and 5% in the poor-risk group (P<0.001, Figure 5a, Supplementary Table S5). Similarly, the respective 3-year OS rates were 45%, 26% and 14% (P=0.009; Figure 5b; Supplementary Table S6).
Figure 5.
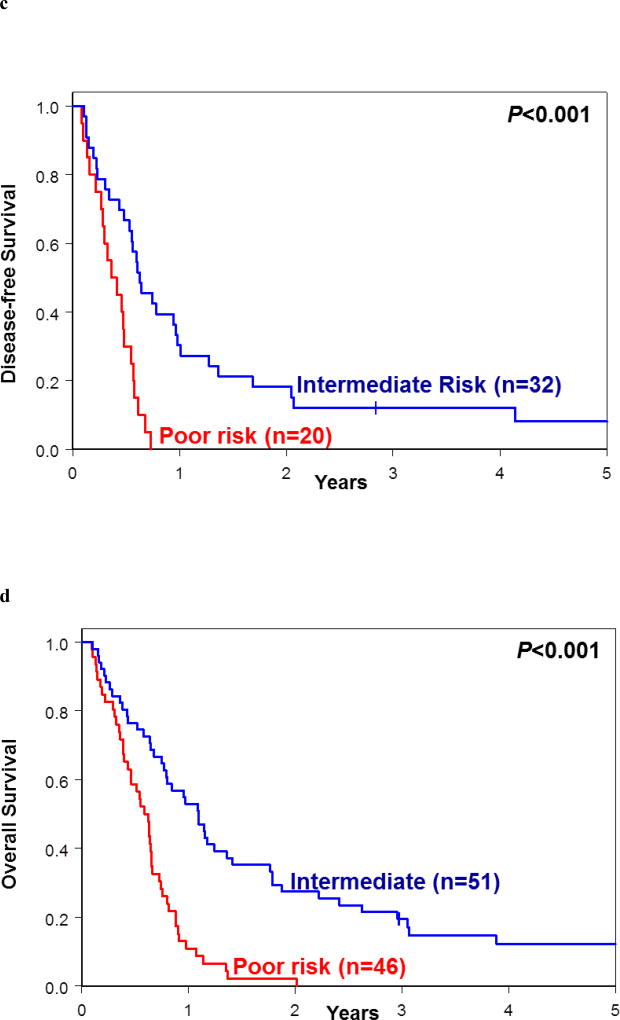
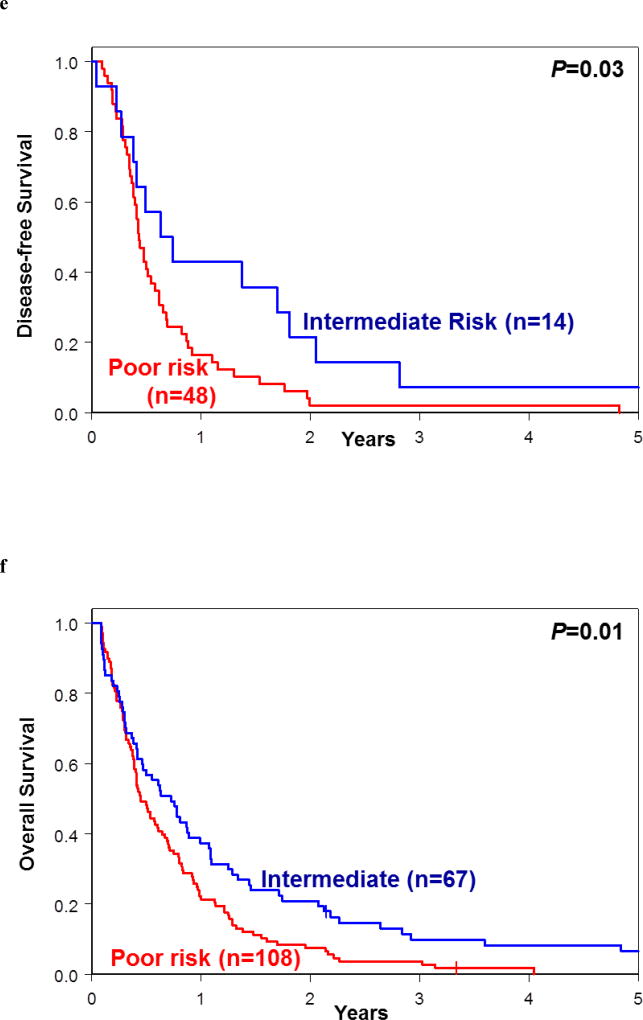
Re-classification of patients assigned into each of the 2017 European LeukemiaNet (ELN) risk groups into the good-, intermediate- and poor-risk groups following application of our proposed genetic risk stratification schema. (a) Disease-free survival and (b) overall survival of re-classified patients belonging to 2017 ELN Favorable-risk group. (c) Disease-free survival and (d) overall survival of re-classified patients belonging to 2017 ELN Intermediate-risk group. (e) Disease-free survival and (f) overall survival of re-classified patients belonging to 2017 ELN Adverse-risk group.
Application of our model to patients included in the 2017 ELN Intermediate-risk group resulted in delineation of two major risk groups, the intermediate-risk group (comprising 32 patients for DFS and 51 for OS) and poor-risk group (comprising 20 patients for DFS and 46 for OS); for DFS two and for OS four patients were re-classified into the good-risk group. The 3-year DFS rates for the new intermediate-risk and poor-risk groups were 13% and 0%, respectively (P<0.001), and the 3-year OS rates were 20% for the intermediate-risk and 0% for poor-risk group (P<0.001; Figure 5c and 5d; Supplementary Tables S5 and S6).
Finally, the 2017 ELN Adverse-risk group could be divided using our criteria into the intermediate-risk group (comprising 14 patients for DFS and 67 for OS) and poor-risk group (comprising 48 patients for DFS and 108 for OS); for DFS three patients and none for OS were re-classified into the good-risk group. Patients in the new intermediate-risk and poor-risk groups had the 3-year DFS rates of 7% and 2% (P=0.03) and the 3-year OS rates of 10% and 4% (P=0.01), respectively (Figures 5e and 5f; Supplementary Tables S5 and S6). These data suggest that the use of our proposed genetic risk-stratification schema may refine the current 2017 ELN classification for patients aged 60 years and older treated with standard chemotherapy.
DISCUSSION
Despite recent advances in our understanding of the molecular background of AML,3–6 most of the data pertain to younger AML patients. Our study, which, to our knowledge, was performed on the hitherto largest cohort of AML patients aged 60 years or older who were analyzed with a comprehensive next-generation sequencing panel, provides important insights into cytogenetic and mutational features in this age group.
In line with previous studies,24–26 NPM1 mutations were the dominating marker in the older AML patient population. NPM1 mutations were not only the most frequent, but also the only mutation whose presence is associated with a higher likelihood of achieving a CR by patients receiving standard induction chemotherapy. NPM1 mutations also confer longer DFS and OS. However, we have shown that the presence or absence of additional mutations, such as mutations in the chromatin remodeling, cohesin complex, methylation-related and RAS pathway genes for CR achievement, mutations in the ASXL1, SF1, SMC1A and SRSF2 genes for DFS and ASXL1, IDH2, SF1 and SRSF2 mutations for OS, can influence the prognostic impact of NPM1 mutation. This strongly suggests that those additional genes need to be tested together with NPM1 in older AML patients who receive standard chemotherapy.
The use of mutational testing is important for the identification of the small population of older patients who have an excellent chance to achieve a complete remission when treated with standard induction chemotherapy. We have shown that patients fit for chemotherapy who harbored NPM1 mutations together with such co-occurring mutations as those in chromatin remodeling, cohesin complex, FLT3-TKD, methylation-related, RAS pathway or spliceosome genes, or without FLT3-ITD constitute a good-risk group whose chance of achieving a CR was 81%. They represented 30% of our total patient cohort. In contrast, patients with U2AF1 or WT1 mutations, sole trisomy 11 and/or a typical complex karyotype, of whom only 32% achieved a CR, should receive alternative treatment regimens, if possible. However, importantly, the promising CR rates of the good-risk group did not lead to an equally good survival. Thus, it should be considered whether alternative consolidation regimens would be of benefit, especially for patients who achieve an initial CR. Novel strategies targeting co-associated mutations (IDH1 with AG-120, and IDH2 with AG-221), novel immune based therapies, or non-ablative allogeneic stem cell transplant might be options considered for such patients. Unfortunately, we were not able to specifically analyze the outcome of patients who received an allogeneic transplant after relapse, as most CALGB/Alliance protocols did not allow an allogeneic transplant. Thus, patients received their allogeneic SCT off protocol, and documentation after the event was too limited for further analysis.
We were also able to identify small patient subsets (approximately 10% of patients) that had more favorable outcomes at 3 years after enrollment (DFS, 46%; OS, 45%). Again, those good-risk groups were driven by the presence of NPM1 mutations, in combination with other mutations.
Our study further supports the notion that some recurrent cytogenetic abnormalities may have different prognostic significance in younger and older patients with AML. For example, t(9;11), which has been consistently associated with intermediate-risk group in younger adults,27–29 in our patient cohort conferred poor prognosis. This is consistent with our earlier study reporting that t(9;11) was associated with intermediate outcome only in AML patients younger than 60 years, whereas the outcome of patients with t(9;11) aged 60 years or more was adverse.16 The reasons of such age difference are currently unknown.
We have also compared our proposed genetic risk stratification schema with the 2017 ELN classification.9 Application of the latter to our older patient cohort created a relative large 2017 ELN modified Favorable-risk group (i.e., without patients with CBF-AML), and the 2017 ELN Intermediate-risk and Adverse-risk groups whose DFS and OS were virtually identical, unlike DFS and OS of the intermediate- and poor-risk groups in our proposed model. Moreover, the use of our criteria to re-classify patients categorized in each of the 2017 ELN risk groups helped to identify patient subsets with significantly different DFS and OS, suggesting that our proposed model may be better suited for risk stratification of patients aged 60 years and older who are treated with standard chemotherapy.
One of the potential limitations of our study is the use of different risk markers for each specific outcome endpoint, which might complicate the use of our model in clinical practice. However, we believe that our approach reflects the complex biology of the disease, in which the same cytogenetic or molecular marker, such as, for example mutated RUNX1, may be associated with worse DFS but not with CR attainment or OS.
In summary, our study highlights the extremely poor outcome of AML patients aged 60 years and older with current treatment approaches. This is of special importance as older patients account for the majority of AML patients. We were able to identify combinations of mutations associated with favorable outcome in subsets of older AML patients. A limitation of our study is the lack of a validation cohort to confirm our findings, which is due to the difficulty to allocate similarly large set of older AML patients treated with standard chemotherapy. Thus, our encouraging findings will require validation in future prospective studies.
Supplementary Material
Acknowledgments
The authors are grateful to the patients who consented to participate in these clinical trials and the families who supported them; to Donna Bucci and the CALGB/Alliance Leukemia Tissue Bank at The Ohio State University Comprehensive Cancer Center, Columbus, OH, for sample processing and storage services; and to Lisa J. Sterling and Christine Finks for data management. Research reported in this publication was supported by an allocation of computing resources from The Ohio Supercomputer Center. This study was supported in part by the National Cancer Institute of the National Institutes of Health under Award Numbers U10CA180821 and U10CA180882 (to the Alliance for Clinical Trials in Oncology), U10CA003927, U10CA047545, U10CA101140, U10CA140158, U10CA180850, U10CA180861, U10CA180866, U10CA180867, U24CA196171, R35CA197734 (JCB), UG1CA189850 and 5P30CA016058; the Coleman Leukemia Research Foundation; the National Comprehensive Cancer Network Foundation Young Investigator Award; the Alliance for Clinical Trials in Oncology Scholar Award (JSB); The D Warren Brown Foundation, and the Pelotonia Fellowship Program (A-KE).
Footnotes
The authors declare no conflicts of interest.
AUTHOR CONTRIBUTIONS
A-KE, KM, and CDB contributed to the study design; A-KE, KM, AdlC, and CDB contributed to the data interpretation, A-KE, KM, JK, and CDB wrote the manuscript; A-KE, SEM and SO performed laboratory-based research; JSB performed the data processing; JK and DN performed statistical analysis; RMS, AJC, KM, JEK, BLP, ESW and CDB were involved directly or indirectly in the care of patients and/or sample procurement. All authors read and agreed on the final version of the manuscript.
Supplementary Information is available at Leukemia’s website.
References
- 1.Döhner H, Weisdorf DJ, Bloomfield CD. Acute myeloid leukemia. N Engl J Med. 2015;373:1136–1152. doi: 10.1056/NEJMra1406184. [DOI] [PubMed] [Google Scholar]
- 2.Arber DA, Orazi A, Hasserjian R, Thiele J, Borowitz MJ, Le Beau MM, et al. The 2016 revision to the World Health Organization classification of myeloid neoplasms and acute leukemia. Blood. 2016;127:2391–2405. doi: 10.1182/blood-2016-03-643544. [DOI] [PubMed] [Google Scholar]
- 3.Cancer Genome Atlas Research Network. Genomic and epigenomic landscapes of adult de novo myeloid leukemia. N Engl J Med. 2013;368:2059–2074. doi: 10.1056/NEJMoa1301689. [DOI] [PMC free article] [PubMed] [Google Scholar]
- 4.Papaemmanuil E, Gerstung M, Bullinger L, Gaidzik VI, Paschka P, Roberts ND, et al. Genomic classification and prognosis in acute myeloid leukemia. N Engl J Med. 2016;374:2209–2221. doi: 10.1056/NEJMoa1516192. [DOI] [PMC free article] [PubMed] [Google Scholar]
- 5.Patel JP, Gönen M, Figueroa ME, Fernandez H, Sun Z, Racevskis J, et al. Prognostic relevance of integrated genetic profiling in acute myeloid leukemia. N Engl J Med. 2012;366:1079–1089. doi: 10.1056/NEJMoa1112304. [DOI] [PMC free article] [PubMed] [Google Scholar]
- 6.Metzeler KH, Herold T, Rothenberg-Thurley M, Amler S, Sauerland MC, Görlich D, et al. Spectrum and prognostic relevance of driver gene mutations in acute myeloid leukemia. Blood. 2016;128:686–698. doi: 10.1182/blood-2016-01-693879. [DOI] [PubMed] [Google Scholar]
- 7.Mrózek K, Heerema NA, Bloomfield CD. Cytogenetics in acute leukemia. Blood Rev. 2004;18:115–136. doi: 10.1016/S0268-960X(03)00040-7. [DOI] [PubMed] [Google Scholar]
- 8.Grimwade D, Mrózek K. Diagnostic and prognostic value of cytogenetics in acute myeloid leukemia. Hematol Oncol Clin North Am. 2011;25:1135–1161. doi: 10.1016/j.hoc.2011.09.018. [DOI] [PubMed] [Google Scholar]
- 9.Döhner H, Estey E, Grimwade D, Amadori S, Appelbaum FR, Büchner T, et al. Diagnosis and management of AML in adults: 2017 ELN recommendations from an international expert panel. Blood. 2017;129:424–447. doi: 10.1182/blood-2016-08-733196. [DOI] [PMC free article] [PubMed] [Google Scholar]
- 10.Marcucci G, Haferlach T, Döhner H. Molecular genetics of adult acute myeloid leukemia: prognostic and therapeutic implications. J Clin Oncol. 2011;29:475–486. doi: 10.1200/JCO.2010.30.2554. [DOI] [PubMed] [Google Scholar]
- 11.Meyer SC, Levine RL. Translational implications of somatic genomics in acute myeloid leukaemia. Lancet Oncol. 2014;15:e382–e394. doi: 10.1016/S1470-2045(14)70008-7. [DOI] [PubMed] [Google Scholar]
- 12.Grimwade D, Ivey A, Huntly BJP. Molecular landscape of acute myeloid leukemia in younger adults and its clinical significance. Blood. 2016;127:29–41. doi: 10.1182/blood-2015-07-604496. [DOI] [PMC free article] [PubMed] [Google Scholar]
- 13.Metzeler KH, Becker H, Maharry K, Radmacher MD, Kohlschmidt J, Mrózek K, et al. ASXL1 mutations identify a high-risk subgroup of older patients with primary cytogenetically normal AML within the ELN favorable genetic category. Blood. 2011;118:6920–6929. doi: 10.1182/blood-2011-08-368225. [DOI] [PMC free article] [PubMed] [Google Scholar]
- 14.Gaidzik VI, Bullinger L, Schlenk RF, Zimmermann AS, Röck J, Paschka P, et al. RUNX1 mutations in acute myeloid leukemia: results from a comprehensive genetic and clinical analysis from the AML study group. J Clin Oncol. 2011;29:1364–1372. doi: 10.1200/JCO.2010.30.7926. [DOI] [PubMed] [Google Scholar]
- 15.Mendler JH, Maharry K, Radmacher MD, Mrózek K, Becker H, Metzeler KH, et al. RUNX1 mutations are associated with poor outcome in younger and older patients with cytogenetically normal acute myeloid leukemia and with distinct gene and microRNA expression signatures. J Clin Oncol. 2012;30:3109–3118. doi: 10.1200/JCO.2011.40.6652. [DOI] [PMC free article] [PubMed] [Google Scholar]
- 16.Mrózek K, Marcucci G, Nicolet D, Maharry KS, Becker H, Whitman SP, et al. Prognostic significance of the European LeukemiaNet standardized system for reporting cytogenetic and molecular alterations in adults with acute myeloid leukemia. J Clin Oncol. 2012;30:4515–4523. doi: 10.1200/JCO.2012.43.4738. [DOI] [PMC free article] [PubMed] [Google Scholar]
- 17.Mrózek K, Carroll AJ, Maharry K, Rao KW, Patil SR, Pettenati MJ, et al. Central review of cytogenetics is necessary for cooperative group correlative and clinical studies of adult acute leukemia: the Cancer and Leukemia Group B experience. Int J Oncol. 2008;33:239–244. [PMC free article] [PubMed] [Google Scholar]
- 18.Vittinghoff E, Glidden DV, Shiboski SC, McCulloch CE. Regression Methods in Biostatistics: Linear, Logistic, Survival and Repeated Measures Models. Springer; New York, NY, USA: 2005. [Google Scholar]
- 19.Kaplan EL, Meier P. Nonparametric estimation from incomplete observations. J Am Stat Assoc. 1958;53:457–481. [Google Scholar]
- 20.Marcucci G, Maharry K, Radmacher MD, Mrózek K, Vukosavljevic T, Paschka P, et al. Prognostic significance of, and gene and microRNA expression signatures associated with, CEBPA mutations in cytogenetically normal acute myeloid leukemia with high-risk molecular features: a Cancer and Leukemia Group B study. J Clin Oncol. 2008;26:5078–5087. doi: 10.1200/JCO.2008.17.5554. [DOI] [PMC free article] [PubMed] [Google Scholar]
- 21.Patel JL, Schumacher JA, Frizzell K, Sorrells S, Shen W, Clayton A, et al. Coexisting and cooperating mutations in NPM1-mutated acute myeloid leukemia. Leuk Res. 2017;5:7–12. doi: 10.1016/j.leukres.2017.01.027. [DOI] [PubMed] [Google Scholar]
- 22.Mrózek K. Acute myeloid leukemia with a complex karyotype. Semin Oncol. 2008;35:365–377. doi: 10.1053/j.seminoncol.2008.04.007. [DOI] [PMC free article] [PubMed] [Google Scholar]
- 23.Eisfeld A-K, Mrózek K, Kohlschmidt J, Nicolet D, Orwick S, Walker CJ, et al. The mutational oncoprint of recurrent cytogenetic abnormalities in adult patients with de novo acute myeloid leukemia. Leukemia. 2017 doi: 10.1038/leu.2017.86. e-pub ahead of print 18 April 2017. [DOI] [PMC free article] [PubMed] [Google Scholar]
- 24.Becker H, Marcucci G, Maharry K, Radmacher MD, Mrózek K, Margeson D, et al. Favorable prognostic impact of NPM1 mutations in older patients with cytogenetically normal de novo acute myeloid leukemia and associated gene- and microRNA-expression signatures: a Cancer and Leukemia Group B study. J Clin Oncol. 2010;28:596–604. doi: 10.1200/JCO.2009.25.1496. [DOI] [PMC free article] [PubMed] [Google Scholar]
- 25.Ostronoff F, Othus M, Lazenby M, Estey E, Appelbaum FR, Evans A, et al. Prognostic significance of NPM1 mutations in the absence of FLT3-internal tandem duplication in older patients with acute myeloid leukemia: a SWOG and UK National Cancer Research Institute/Medical Research Council report. J Clin Oncol. 2015;33:1157–1164. doi: 10.1200/JCO.2014.58.0571. [DOI] [PMC free article] [PubMed] [Google Scholar]
- 26.Tsai C-H, Hou H-A, Tang J-L, Liu C-Y, Lin C-C, Chou W-C, et al. Genetic alterations and their clinical implications in older patients with acute myeloid leukemia. Leukemia. 2016;30:1485–1492. doi: 10.1038/leu.2016.65. [DOI] [PubMed] [Google Scholar]
- 27.Mrózek K, Heinonen K, Lawrence D, Carroll AJ, Koduru PR, Rao KW, et al. Adult patients with de novo acute myeloid leukemia and t(9; 11)(p22; q23) have a superior outcome to patients with other translocations involving band 11q23: a Cancer and Leukemia Group B study. Blood. 1997;90:4532–4538. [PubMed] [Google Scholar]
- 28.Krauter J, Wagner K, Schäfer I, Marschalek R, Meyer C, Heil G, et al. Prognostic factors in adult patients up to 60 years old with acute myeloid leukemia and translocations of chromosome band 11q23: individual patient data-based meta-analysis of the German Acute Myeloid Leukemia Intergroup. J Clin Oncol. 2009;27:3000–3006. doi: 10.1200/JCO.2008.16.7981. [DOI] [PubMed] [Google Scholar]
- 29.Grimwade D, Hills RK, Moorman AV, Walker H, Chatters S, Goldstone AH, et al. Refinement of cytogenetic classification in acute myeloid leukemia: determination of prognostic significance of rare recurring chromosomal abnormalities among 5876 younger adult patients treated in the United Kingdom Medical Research Council trials. Blood. 2010;116:354–365. doi: 10.1182/blood-2009-11-254441. [DOI] [PubMed] [Google Scholar]
Associated Data
This section collects any data citations, data availability statements, or supplementary materials included in this article.


