

Abstract
Aim
There are marked socioeconomic disparities in pediatric asthma control, but the molecular origins of these disparities are not well understood. To fill this gap, we performed genome-wide expression profiling of monocytes and T-helper cells from pediatric asthma patients of lower- and higher socioeconomic status (SES).
Method
99 children with asthma participated in a cross-sectional assessment. 87% were atopic, and most had disease of mild (54%) or moderate (29%) severity. Children were from lower-SES (n=49; household income < $50,000) or higher-SES (n=50; household income > $140,000) families. Peripheral blood monocytes and T-helper cells were isolated for genome-wide expression profiling of mRNA.
Results
Lower-SES children had worse asthma quality of life relative to higher-SES children, by both their own and their parents’ reports. Although the groups had similar disease severity, and potential confounds were controlled, their transcriptional profiles differed notably. The monocytes of lower-SES children showed transcriptional indications of up-regulated anti-microbial and pro-inflammatory activity. The T-helper cells of lower-SES children also had comparatively reduced expression of genes encoding γ-interferon and tumor necrosis factor-α, cytokines that orchestrate Type 1 responses. They also showed up-regulated activity of transcription factors that polarize cells towards Type 2 responses and promote Th17 cell maturation.
Conclusion
Collectively, these patterns implicate pro-inflammatory monocytes and Type 2 cytokine activity as mechanisms contributing to worse asthma control among lower-SES children.
Keywords: poverty, health disparities, asthma, pediatrics, cytokines
INTRODUCTION
There is appreciable variability in the clinical outcomes of children with asthma. Multiple factors contribute to this variability, including genetics, disease phenotype, care quality, trigger control, and medication adherence 1. Above and beyond these factors, children’s outcomes also pattern by their family’s socioeconomic status (SES). Compared with their more advantaged peers, lower-SES children with asthma have worse disease control, more school absences, more functional limitations, more hospital admissions, and higher mortality 2–5.
The pathologic basis of these disparities is starting to be understood, particularly in atopic patients whose disease is eosinophilic 6, 7. Relative to their advantaged peers, lower-SES children display more pronounced Type 2 cytokine 8, 9 and airway inflammatory 10 responses to asthma triggers. They also show indications of a sustained late-phase response, as reflected in higher circulating eosinophil counts 9 and greater alveolar nitric oxide content 11. Nevertheless, the molecular underpinnings of this dysregulation remain poorly understood. Here we sought to fill this gap by conducting genome-wide expression profiling on two populations of cells with roles in asthma control: CD14+ monocytes and CD3+/CD4+ T-helper lymphocytes.
Upon inhaled allergen exposure, monocytes are recruited from the blood into the lungs, where they can mature into dendritic cells and airway macrophages 12. Along with airway epithelia, these cells function as sentinels 13, which detect allergens, irritants, and pathogens, and steer T-helper lymphocytes to differentiate into distinct functional phenotypes. Based on studies of healthy individuals 14, 15, we predicted the monocytes of low-SES children would display indications of up-regulated activity, especially in transcriptional pathways that orchestrate antimicrobial and inflammatory responses, like those mediated by AP-1, GATA, NF-κB, and ELK-1.
T-helper lymphocytes are key drivers of the airway pathology that initiates and maintains asthma. Distinct functional phenotypes of these cells propagate effector functions that contribute to allergic sensitization, eosinophil and neutrophil recruitment, as well as downstream inflammation, remodeling, and hypersensitivity of the airways 16. Based on studies of cytokine production and airway inflammation 8, 9, 11, 15, 17, 18, we hypothesized that lower-SES children would display transcriptional profiles indicative of up-regulated T-helper lymphocyte activity with a polarization away from Type 1 cytokine profiles and toward Type 2 and/or Type 17 profiles. We reasoned this would be evident in transcripts and networks that coordinate antigen recognition and cellular differentiation, and mobilize Type 1 and Type 2 effector functions.
MATERIALS & METHODS
Patients
This cross-sectional analysis focuses on 99 children with asthma from either lower-SES (n=49) or higher-SES (n=50) families. They were drawn for a gene-expression sub-study from a larger cohort of 308 patients 19 and represent the poles of that sample’s SES distribution. Patients in the larger cohort were recruited between July 2013 and July 2016 from one health care system, NorthShore University HealthSystem, and one federally qualified health center, Erie Family Health Center, both in Evanston, Illinois. Children in the higher-SES group were in the upper 15% of the larger sample’s income distribution. All had family incomes exceeding $140,000 per year, and none was receiving government assistance. Children in the lower-SES group were in the bottom 15% of the larger sample’s income distribution. All had family incomes below < $50,000 per year and/or received government assistance. For the larger project, we screened a total of 494 children, 452 of whom were eligible for participation. Inclusion criteria were (a) ages 8–17, (b) fluency in English, and (c) physician diagnosis of asthma. Exclusion criteria were other chronic medical or psychiatric illness, and acute respiratory illness within 2 weeks. Of the 452 eligible children, 144 ultimately did not participate, because they either declined to do so following screening (n=48), revoked consent (n=3), or never attended an assessment (n=93). The protocol was approved by the Institutional Review Boards of Northwestern University, NorthShore University HealthSystem, and Erie Family Health Center. All children gave written assent before participating, and a caregiver provided written consent.
Socioeconomic Status
Each child’s caregiver was interviewed using items from the MacArthur Sociodemographic Questionnaire, which provides detailed information regarding family income, education, and resources.
Isolation of Cells and Extraction of RNA
20-ml of antecubital blood was drawn into Cell Preparation Tubes (Becton-Dickinson). Following the manufacturer’s protocol, peripheral blood mononuclear cells (PBMC) were isolated by density-gradient centrifugation. After washing, PBMC were incubated for 15 minutes at +4° C with immuno-magnetic beads (Miltenyi Biotec), then washed again. The re-suspended cells were passed through an automated cell sorter (autoMACS Pro; Miltenyi Biotec), whose magnetic columns enabled positive selection of monocytes (CD14+) and T-helper lymphocytes (CD3+/CD4+), with ≥ 90% purity as verified by flow cytometry. The isolated cell populations were then disrupted and homogenized by centrifugation in Qiashredder tubes containing RLT Plus Buffer (Qiagen). The resulting lysates were frozen at −80° C until the study ended. At that point, total RNA was extracted using PCR-clean and RNAse-free techniques with a commercially available kit (Qiagen RNeasy).
Gene Expression Profiling
Before analysis, RNA was tested for suitable mass (median = 491.49 ng) and integrity (median RIN = 8.5) on NanoDrop 1000 and Agilent TapeStation instruments. All but 3 samples (in each case, from CD14+ monocytes) passed a standard endpoint quality criterion (median probe fluorescence intensity > 100). The 3 failing samples (1 lower-SES, 2 higher-SES) were dropped from the CD14+ data set. Fluorescently-labeled cRNA targets were synthesized using a commercially available kit (Ambion TotalPrep), and hybridized to Illumina HT-12 v4 bead arrays, which were read on an Illumina iScan Station at the UCLA Neuroscience Genomics Core. This array covers more than 34,000 transcripts, including the vast majority of named human genes, and we have used it extensively in past research 14, 20. Raw data are deposited in the Gene Expression Omnibus repository (Accession # GSE109455; Token ubcxmiwkjboljal).
Asthma Quality of Life
Each child completed the Pediatric Asthma Quality of Life Questionnaire 21. This 23-item measure produces an overall score, as well as subscales that assess emotional difficulties, symptom burden, and activity limitations. These scales have been extensively validated, and showed high internal consistency her (Cronbach’s alphas > .85). To obtain collateral information, we also asked caregivers to complete the same questionnaire with respect to their child’s status. In each domain, higher scores indicate better quality of life.
Covariates
A priori, we identified a panel of covariates which might give rise to spurious associations between children’s SES and gene expression profiles. They included age, gender, racial group (coded as Caucasian/Non-Hispanic vs. Other), body mass index (BMI), asthma severity, and medication use. BMI was calculated as kg/m2 based on measurements taken with a balance-beam scale and stadiometer. Disease severity was coded based on guidelines from the National Asthma Education and Prevention Program/Expert Panel Report 2, and reflects the higher of medication use and symptom frequency 22. Children also brought their medications to the assessment and reported how many days in the past week they had used each; we coded these agents into categories reflecting short-acting β-agonists (SABA) and inhaled corticosteroids (ICS).
Statistical Analyses
Aside from the 3 patients with unsatisfactory CD14+ RNA, the dataset was complete and without missing values. Using higher-order bioinformatic analyses, we sought to identify socioeconomic differences in the activity of transcription control pathways and functional genomic categories. Accordingly, our results emphasize findings from these higher-order analyses, and intentionally downplay results for individual transcripts. Briefly, we estimated transcript abundance using default algorithms in Illumina GenomeStudio. After the raw data were quantile-normalized and log2-transformed, linear models were used to quantify the magnitude of differential gene expression between lower-SES and higher-SES groups, while adjusting for covariates. The pool of transcripts showing ≥ 1.20-fold differential expression between groups served as input into higher-order bioinformatic analyses, which maintain their own false discovery rates. Defining differential gene expression by point estimates of biological magnitude (i.e., fold thresholds) yields more replicable higher-order findings than does screening input based on p-/q-values 23, 24. First, to identify common functional characteristics of differentially expressed genes, we conducted Gene Ontology analyses using GOstat (http://gostat.wehi.edu.au). This statistical tool identifies sets of functional related transcripts using Benjamin-corrected p values to protect against false discoveries. Second, we used the Transcription Element Listening System (TELIS; http://www.telis.ucla.edu) to identify upstream transcription control pathways contributing to patterns of differential gene expression. TELiS identifies these pathways based on asymmetries in the prevalence of transcription factor-binding motifs in the promoters of differentially expressed genes 25. Standard errors for bioinformatic results were derived from bootstrap resampling of residual vectors from the linear models, which controls for the inter-correlation amongst transcripts.
RESULTS
Table 1 describes the sample. As explained in Methods, the patients were selected from a larger cohort to be from the lower or higher ends of the SES distribution, and accordingly the groups differed markedly on family income and government assistance. The bulk of children in the lower-SES group identified as racial or ethnic minorities, whereas most of those in the higher-SES group did not (65% vs. 6% as African-Americans). On average, the lower-SES children had higher body mass index than the higher-SES children (means of 24.9 vs. 21.0), and reported marginally less frequent SABA use (2.4 vs. 1.5 days in past week). The groups were similar with regard to age, gender, atopy, ICS use, and asthma severity. Nevertheless, to minimize confounding, all these variables were included as covariates in transcriptional analyses below.
Table 1.
Characteristics of the analytic sample (N=99)
| Lower-SES Group (N=49) Mean (SD) or N (%) |
Higher-SES Group (N=50) Mean (SD) or N (%) |
Group Difference (p value) | |
|---|---|---|---|
|
| |||
| Annual family income, dollars | 37,053 (17,070) | 260,187 (321,789) | .0001 |
|
| |||
| Family receives federal assistance | 35 (74.1%) | 0 (0.0%) | .0001 |
|
| |||
| Child age, years | 12.7 (2.9) | 13.0 (2.5) | .57 |
|
| |||
| Child sex, female | 22 (44.9%) | 22 (44.0%) | .55 |
|
| |||
| Child identifies as White race | 8 (16.3%) | 35 (70.0%) | .0001 |
|
| |||
| Child identifies as Black race | 32 (65.3%) | 3 (6.0%) | .0001 |
|
| |||
| Child identifies as Hispanic ethnicity | 10 (20.4) | 6 (12.0) | .19 |
|
| |||
| Child body mass index (kg/m2) | 24.9 (6.6) | 21.0 (4.4) | .001 |
|
| |||
| Atopy, positive | 40 (81.6%) | 43 (86.0%) | .60 |
|
| |||
| Days child used ICS, past week | 2.7 (2.9) | 3.3 (3.3) | .34 |
|
| |||
| Days child used SABA, past week | 2.4 (2.5) | 1.5 (2.0) | .05 |
|
| |||
| Child’s asthma severity category | .37 | ||
| Mild intermittent | 8 (16.3%) | 7 (14.0%) | |
| Mild persistent | 14 (28.6%) | 24 (48.0%) | |
| Moderate | 18 (36.7%) | 11 (22.0%) | |
| Severe | 9 (18.4%) | 8 (16.0%) | |
Quality of Life
Mirroring the broader literature, lower-SES children had worse asthma-related quality of life compared with higher-SES children (see Figure 1). On caregiver reports, these SES disparities were apparent for the scale’s total score, and subscales reflecting activity limitations, emotional functioning, and symptom burden (all p values <.001). Children’s reports showed the same pattern, with significant SES disparities on all dimensions (p values < .02) except symptom burden, where the difference was marginal (p = .08).
Figure 1.

Pediatric asthma patients reported on multiple dimensions of their asthma quality of life, and so did one of their patents. Across reporters, children from families of lower socioeconomic status (SES) had worse quality of life than counterparts from higher-SES families.
CD14+ Gene Expression
Linear-model analyses with control for covariates identified 49 monocyte transcripts showing a ≥ 1.20-fold difference in expression according to SES (Table 2). 33 of these transcripts showed a relative up-regulation among lower-SES children. Gene Ontology categories that were over-represented among these transcripts included chemokine activity (GO: 0008009; p = .0003; 3 hits including CCL2, CCL4L1, LOC728830) and wound healing (GO:0009611; p = .008; 4 hits including CCL2, LOC728830, CD9, PROK2). Lower-SES children also showed relative up-regulation of genes encoding components of the MHC Class 2 complex (e.g., HLADRB1, HLADRB5, HLADRB6) and proteins involved in antigen processing and presentation (e.g., CD9, CTSG, ERAP2). Consistent with these patterns, and with our hypotheses, TELIS analyses of transcription control pathways indicated relatively increased activity of AP-1 (TRANSFAC V$AP1_Q2 motif; fold difference = 2.13, SE = 0. 81, p = .018) and ELK-1 (TRANSFAC V$ELK1_01 motif; fold difference = 2.01, SE = 0.78, p = .035) in monocytes of lower-SES children (Figure 2, upper panel). These transcription factors coordinate gene expression programs that foster maturation, mobilization, and activation of monocytes.
Table 2.
Differentially expressed transcripts identified in isolated CD14+ cells.
| DOWN-REGULATED IN LOWER-SES CHILDREN | |
|---|---|
| Transcript | Adjusted Fold Difference (Lower:Higher SES) |
| HSPA1B | 0.602 |
| HSPA1A | 0.707 |
| DNAJB1 | 0.717 |
| HRASLS3 | 0.740 |
| THBS1 | 0.744 |
| RPS23 | 0.745 |
| LOC731682 | 0.756 |
| SPATA20 | 0.757 |
| UTS2 | 0.758 |
| HLA-DQB1 | 0.774 |
| FAM118A | 0.784 |
| RGS1 | 0.790 |
| HIST1H2BG | 0.804 |
| LOC85390 | 0.809 |
| ACCS | 0.818 |
| S100P | 0.828 |
| UP-REGULATED IN LOWER-SES CHILDREN | |
| Transcript | Adjusted Fold Difference (Lower:Higher SES) |
| LOC644936 | 1.696 |
| HLA-DRB5 | 1.405 |
| LOC728830 | 1.357 |
| CD9 | 1.343 |
| LOC729708 | 1.331 |
| LMNA | 1.328 |
| LOC645979 | 1.313 |
| LOC641768 | 1.289 |
| LOC441377 | 1.288 |
| LOC728823 | 1.282 |
| FOLR3 | 1.267 |
| CTSG | 1.267 |
| HES4 | 1.263 |
| IFITM3 | 1.261 |
| HLA-DRB1 | 1.257 |
| HLA-DRB6 | 1.256 |
| PROK2 | 1.253 |
| LOC100129650 | 1.252 |
| AFMID | 1.245 |
| LOC646753 | 1.242 |
| LOC100133823 | 1.237 |
| MSLN | 1.229 |
| LOC644928 | 1.226 |
| ERAP2 | 1.226 |
| GSTM2 | 1.222 |
| CCL2 | 1.220 |
| LOC442727 | 1.218 |
| EMP1 | 1.216 |
| CCL4L1 | 1.215 |
| LILRA3 | 1.213 |
| DFNA5 | 1.213 |
| LOC100129543 | 1.204 |
| LOC644934 | 1.203 |
In addition to SES group, the models also include the following covariates: age, sex, body mass index, asthma severity, and frequency of ICS and SABA use in past week.
Figure 2.
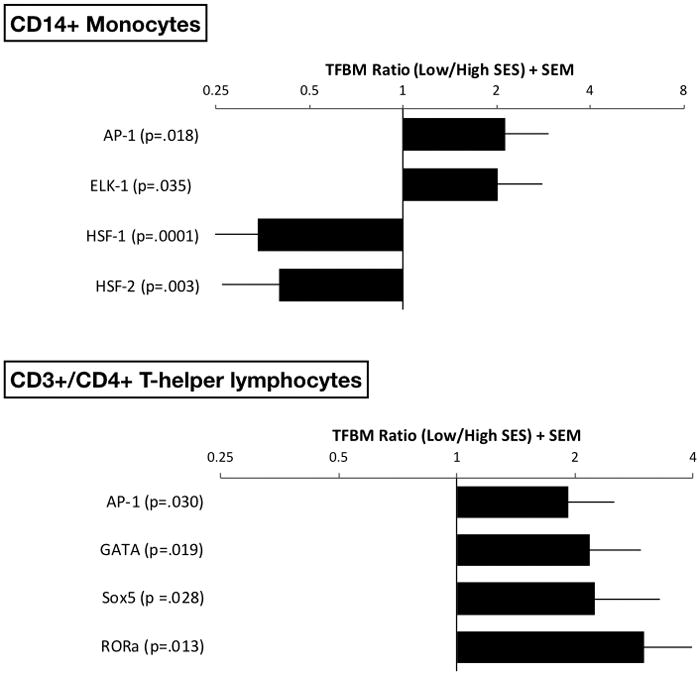
Linear models were used to estimate the magnitude of differential gene expression in groups of pediatric asthma patients with lower versus higher socioeconomic status (SES). The models were adjusted for a panel of a priori selected covariates. Genes showing 1.20-fold differential expression between groups served as input into higher-order bioinformatics analyses using the Transcription Factor Element Listening System. This platform quantified the prevalence of transcription factor binding motifs (TFBMs) in promoters of differentially expressed genes. TFBM ratios >1 indicate specified transcriptional pathway is up-regulated with low SES; ratios <1 indicate converse. Upper panel shows findings on CD14+ monocytes, and lower panel shows findings in CD3+/CD4+ T-helper lymphocytes.
Among the 16 transcripts down-regulated in monocytes of lower-SES children were heat-shock and cell-stress proteins (HSPA1A, HSPA1B, DNAJB1). Consistent with this pattern, TELIS analyses indicated down-regulated activity of the HSF-1 (TRANSFAC V$HSF1_01 motif; fold difference = 0.34, SE = 0.11, p = .0001) and HSF-2 (TRANSFAC V$HSF2_01 motif; fold difference = 0.40, SE = 0.14, p = .003) transcription control pathways in lower-SES children (Figure 2, upper panel). These pathways mediate heat-shock protein signaling.
CD3+/CD4+ Gene Expression
Covariate-adjusted linear-models identified 73 transcripts in T-helper lymphocytes showing a ≥ 1.20-fold difference in expression by SES (Table 3). 39 of those transcripts were relatively down-regulated among lower-SES children. The Gene Ontology categories over-represented among these transcripts included anti-viral response, as reflected in down-regulated expression of the canonical Type 1 cytokines γ-interferon and tumor necrosis factor-α (GO:0009615; 2 hits, p = 0.015), which orchestrate Type 1 immune responses against intracellular pathogens. Also over-represented among down-regulated transcripts were categories reflecting cellular differentiation and cellular development (GO:0030154 and GO:030154; both p’s = p = .0003; both categories with 9 hits including PMAIP1, HSPA1A, RHOB, IER3, GADD45G, IFNG, TNF, SPATA20). 34 T-helper cell transcripts were relatively up-regulated in lower-SES children, including a number whose expression is indicative of cellular activation (HLADRB1, HLADRB5, HLADRB6, FCGBP).
Table 3.
Differentially expressed transcripts identified in isolated CD3+/CD4+ cells.
| DOWN-REGULATED IN LOWER-SES CHILDREN | |
|---|---|
| Transcript | Adjusted Fold Difference (Lower:Higher SES) |
| HSPA1B | 0.474 |
| HSPA1A | 0.579 |
| EGR2 | 0.625 |
| LOC100008588 | 0.648 |
| TNF | 0.680 |
| HSPA6 | 0.701 |
| RPS23 | 0.734 |
| SERPINB6 | 0.759 |
| CRIP2 | 0.763 |
| IFNG | 0.764 |
| IER3 | 0.767 |
| HIST2H2AA3 | 0.770 |
| LOC100132564 | 0.772 |
| LOC642934 | 0.776 |
| ANKDD1A | 0.784 |
| UTS2 | 0.788 |
| HIST1H2BG | 0.790 |
| LOC729362 | 0.791 |
| LOC653610 | 0.795 |
| RASD1 | 0.797 |
| HIST1H2BD | 0.804 |
| RNU5A | 0.804 |
| LOC85390 | 0.808 |
| IPO8 | 0.809 |
| FAM118A | 0.813 |
| HBA1 | 0.813 |
| PMAIP1 | 0.817 |
| HBA2 | 0.818 |
| RHOB | 0.820 |
| HBB | 0.820 |
| P2RY5 | 0.822 |
| CCDC58 | 0.822 |
| LOC731682 | 0.823 |
| HS.572649 | 0.825 |
| EGR1 | 0.829 |
| GADD45G | 0.831 |
| LOC644889 | 0.832 |
| SPATA20 | 0.833 |
| LOC100008589 | 0.833 |
| UP-REGULATED IN LOWER-SES CHILDREN | |
| Transcript | Adjusted Fold Difference (Lower:Higher SES) |
| LOC644936 | 1.653 |
| HLA-DRB5 | 1.507 |
| HLA-DRB1 | 1.365 |
| LOC646753 | 1.346 |
| HLA-DRB6 | 1.326 |
| LOC650298 | 1.320 |
| LOC100133823 | 1.319 |
| LOC642178 | 1.302 |
| LOC100129650 | 1.285 |
| CD79A | 1.269 |
| LOC644928 | 1.266 |
| IFITM3 | 1.261 |
| LOC100131971 | 1.252 |
| HES4 | 1.246 |
| RPS26 | 1.246 |
| MYOM2 | 1.237 |
| LOC645979 | 1.236 |
| LOC728823 | 1.235 |
| LOC100129552 | 1.230 |
| PPFIBP2 | 1.228 |
| LOC644934 | 1.227 |
| LYZ | 1.227 |
| FCGBP | 1.227 |
| ERAP2 | 1.225 |
| HS.511717 | 1.223 |
| GSTM2 | 1.221 |
| ROBO3 | 1.211 |
| LOC730415 | 1.205 |
| GSTM1 | 1.205 |
| LOC644191 | 1.204 |
| PI16 | 1.203 |
| LOC650557 | 1.203 |
| MIR1978 | 1.202 |
| IGLL1 | 1.201 |
In addition to SES group, the models also include the following covariates: age, sex, body mass index, asthma severity, and frequency of ICS and SABA use in past week.
Consistent with these patterns, TELiS analyses found T-helper lymphocytes of lower-SES children to display relative up-regulated activity of the AP-1 (TRANSFAC V$AP1_Q2 motif; fold difference = 1.83, SE = 0.59, p = .030) and GATA (TRANSFAC V$GATA_C motif; fold difference = 2.18, SE = 0.76, p = .019) (Figure 2, lower panel) transcriptional pathways. These pathways are involved in T-lymphocyte proliferation and differentiation, and GATA-3 in particular is involved in mobilizing Type 2 effector functions. TELIS further indicated that lower-SES children had relatively up-regulated activity of Sox5 (TRANSFAC V$SOX5_01 motif; fold difference = 2.29, SE = 1.05, p = .028) and RORα (TRANSFAC V$RORA2_01 motif; fold difference = 3.00, SE = 1.55, p = .013) (Figure 2, lower panel); these transcriptional pathways help drive the differentiation of Th17 cells 26, 27.
DISCUSSION
There are marked socioeconomic disparities in the clinical sequelae of childhood asthma 2–5. To begin characterizing the molecular basis of these disparities in disease control, we performed genome-wide expression profiling of monocytes and T-helper cells from pediatric asthma patients of lower- and higher-SES families. Although the groups had similar disease severity, and other potential confounds were statistically controlled, their transcriptional profiles differed in several notable respects. The monocytes of lower-SES children showed indications of up-regulated anti-microbial and pro-inflammatory activity, as reflected in higher expression of genes involved in monocyte chemotaxis and processing and presentation of antigens. Bioinformatic analyses of response element prevalence implied a role for the transcription factors AP-1 and ELK-1 in orchestrating these differences. These patterns mirror earlier transcriptional studies in healthy adults, which showed higher anti-microbial and pro-inflammatory activity in monocytes of lower-SES individuals 14, 15. The current study supports AP-1 and ELK-1 as the primary transcriptional drivers of such effects in children with asthma, whereas earlier studies of healthy populations indicated a more prominent contribution from NF-κB. To clarify the basis of these differences, a follow-up study comparing healthy and asthmatic youth is needed. In the meantime, the findings here suggest that lower-SES youth may experience worse asthma outcomes partly because of increased monocyte trafficking to the airways and more aggressive clearance of antigens, both of which would presumably amplify downstream lymphocyte effector responses. Consistent with this scenario, there is increasing recognition that innate immune cells, including monocytes, play a role in both acute exacerbations of asthma, and the more chronic airway inflammation that characterizes poorly controlled disease 12, 13.
The groups’ T-helper cell profiles also diverged in several regards. Lower-SES children had comparatively reduced expression of the γ-interferon and tumor necrosis factor-α genes, which encode cytokines that orchestrate Type 1 immune responses. These patterns converge with findings in viral-challenge studies, which show that following pathogen exposure, lower-SES individuals have greater susceptibility to upper respiratory viruses 28, 29. Considered alongside evidence that airway viral infections exacerbate asthma 30, these data suggest the possibility that worse clinical outcomes in lower-SES patients are partly due to compromised Type 1 responses to respiratory pathogens. Also notable in the profiles of lower-SES children were indications of greater T-helper lymphocyte proliferation, differentiation, and activation, which are consistent with patterns observed in a small study of socioeconomic variations in T-cell transcriptional activity 31. Bioinformatic analyses suggested these disparities were orchestrated by the transcription factors AP-1, GATA, Sox5, and RORα. Although more in-depth functional studies are needed to characterize the significance of these patterns, they provide clues about underlying sources of T-helper cell dysregulation. GATA-3 plays a key role in the functional polarization of T-helper cells, inhibiting Type 1 while enhancing Type 2 cytokine responses 32. Consistent with a scenario involving excess GATA-3 activity, we found down-regulated expression of the canonical Type 1 cytokines γ-interferon and tumor necrosis factor-α in helper T cells of lower-SES children. Though no differences in Type 2 cytokine expression were observed, past studies have reported that lower-SES children with asthma have exaggerated production of interleukins-4, 5, and -13 following ex vivo stimulation 5, 8, 9. The bioinformatic indications of increased Sox5 and RORα signaling are also of interest. These transcription factors play key roles in the maturation and activation of Th17 cells 26, 27, which are involved in neutrophilic inflammation and remodeling of the airways 33.
What mechanisms might underlie the transcriptional disparities between lower- and higher-SES children? There are profound socioeconomic gradients in children’s exposure to psychological stressors, as well as irritants, pollutants, allergens, and pathogens that can trigger asthma exacerbations 7. Our study was not designed to elucidate the relative importance of these exposures in mediating transcriptional disparities. Nevertheless, we did not observe bioinformatic indications of group differences in the activity of transcriptional regimes that convey catecholamine and glucocorticoid signals to the leukocyte genome (for glucocorticoid response elements and CREB response elements, p’s ranged from .07 to .85). These findings suggest that stress hormones were not critical mediators of the differences observed here. (Though based on earlier research, it seems likely that stress-related differences in these hormones’ genomic effects come into play once cells have been activated by asthma triggers 5, 34. Lower-SES youth could also have different exposures related to lifestyle factors such as adiposity, smoking, or alcohol use, though we believe those are unlikely to explain the differences here. Only 3 children reported use of cigarettes and alcohol in the past year, and our models included body mass index as a covariate. Diet could play a role mediating SES differences, and it should be assessed in future research. Generally speaking, the literature suggests that both “social” and “physical” pollutants contribute to socioeconomic disparities in asthma outcomes, and do so through independent and synergistic pathways 35–37.
When interpreting this study’s findings, several limitations should be considered. First, the cross-sectional, extreme-groups design cannot provide inferences about causality. Although our models were adjusted for likely confounders, other factors could plausibly have inflated the associations (e.g., genetic variations that cluster within families, and contribute to both parental income and children’s health). That being said, experimental studies in animals show that causal effects of SES are biologically plausible; for instance, rodents exposed to early stressors involving deprivation subsequently display heightened susceptibility to airway inflammation and asthma exacerbations 38. Second, although we defined the study groups based on family income, they also differed on racial identity, with more African-Americans in the lower-SES category. This bias is not unique to our sample, but a reflection of broader racial differences in wealth in the United States. Nevertheless, by including race as a covariate, we minimized its influence here. Third, without a parallel comparison in healthy children, it remains unclear whether the observed SES differences in transcription are specific to asthma versus a more general characteristic of disadvantaged youth, perhaps arising through differential exposure to toxicants, infections, or stressors. Fourth, given the extreme-groups design, it is not clear how generalizable these results are to middle-income children, who represent the vast majority of the population. Finally, the cells used for transcriptional profiling were from peripheral blood, rather than the airways. Follow-up studies in sputum would strengthen confidence in the findings, particularly if conducted following an allergen challenge.
Despite these limitations, this study serves as a first step towards identifying the molecular origins of socioeconomic disparities in pediatric asthma control. Despite considerable effort, these disparities represent a substantial economic burden and psychosocial challenge for children and their families, and a major contributor to pediatric acute care expenditures 39. With a deeper understanding of the mechanisms involved, and progress refining multilevel, community-based approaches to intervention 7, 40, there are reasons to be optimistic these gaps will begin closing.
Acknowledgments
The research described here was supported by grants HL108723 and HL122328 from the National Institutes of Health. None of the authors has a conflict of interest – financial or otherwise – to report in relation to this article’s contents.
Funding: Supported by grants HL108723 and HL122328 from the National Institutes of Health
References
- 1.Anderson WC, Szefler SJ. New and future strategies to improve asthma control in children. J Allergy Clin Immunol. 2015;136:848–859. doi: 10.1016/j.jaci.2015.07.007. [DOI] [PubMed] [Google Scholar]
- 2.Thakur N, Martin M, Castellanos E, Oh SS, Roth LA, Eng C, Brigino-Buenaventura E, Davis A, Meade K, LeNoir MA, Farber HJ, Thyne S, Sen S, Bibbins-Domingo K, Borrell LN, Burchard EG. Socioeconomic status and asthma control in African American youth in SAGE II. J Asthma. 2014;51:720–728. doi: 10.3109/02770903.2014.905593. [DOI] [PMC free article] [PubMed] [Google Scholar]
- 3.Castro M, Schechtman KB, Halstead J, Bloomberg G. Risk factors for asthma morbidity and mortality in a large metropolitan city. J Asthma. 2001;38:625–635. doi: 10.1081/jas-100107540. [DOI] [PubMed] [Google Scholar]
- 4.Bloomberg GR, Banister C, Sterkel R, Epstein J, Bruns J, Swerczek L, Wells S, Yan Y, Garbutt JM. Socioeconomic, family, and pediatric practice factors that affect level of asthma control. Pediatrics. 2009;123:829–835. doi: 10.1542/peds.2008-0504. [DOI] [PMC free article] [PubMed] [Google Scholar]
- 5.Chen E, Shalowitz M, Story RE, Ehrlich KB, Levine CS, Hayen R, Leigh AK, Miller GE. Dimensions of socioeconomic status and childhood asthma outcomes: Evidence for distinct behavioral and biological associations. Psychosom Med. 2016;78:1043–1052. doi: 10.1097/PSY.0000000000000392. [DOI] [PMC free article] [PubMed] [Google Scholar]
- 6.Rosenberg SL, Miller GE, Brehm JM, Celedón JC. Stress and asthma: novel insights on genetic, epigenetic, and immunologic mechanisms. J Allergy Clin Immunol. 2014;134:1009–1015. doi: 10.1016/j.jaci.2014.07.005. [DOI] [PMC free article] [PubMed] [Google Scholar]
- 7.Wright RJ. Epidemiology of stress and asthma: from constricting communities and fragile families to epigenetics. Immunol Allergy Clin North Am. 2011;31:19–39. doi: 10.1016/j.iac.2010.09.011. [DOI] [PMC free article] [PubMed] [Google Scholar]
- 8.Chen E, Hanson MD, Paterson LQ, Griffin MJ, Walker HA, Miller GE. Socioeconomic status and inflammatory processes in childhood asthma: The role of psychological stress. J Allergy Clin Immunol. 2006;117:1014–1020. doi: 10.1016/j.jaci.2006.01.036. [DOI] [PubMed] [Google Scholar]
- 9.Chen E, Strunk RC, Trethewey A, Schreier HM, Maharaj N, Miller GE. Resilience in low-socioeconomic-status children with asthma: adaptations to stress. J Allergy Clin Immunol. 2011;128:970–976. doi: 10.1016/j.jaci.2011.06.040. [DOI] [PMC free article] [PubMed] [Google Scholar]
- 10.Chen E, Strunk RC, Bacharier LB, Chan M, Miller GE. Socioeconomic status associated with exhaled nitric oxide responses to acute stress in children with asthma. Brain Behav Immun. 2010;24:444–450. doi: 10.1016/j.bbi.2009.11.017. [DOI] [PMC free article] [PubMed] [Google Scholar]
- 11.Rosa MJ, Divjan A, Hoepner L, Sheares BJ, Diaz D, Gauvey-Kern K, Perera FP, Miller RL, Perzanowski MS. Fractional exhaled nitric oxide exchange parameters among 9-year-old inner-city children. Pediatr Pulmonol. 2011;46:83–91. doi: 10.1002/ppul.21328. [DOI] [PMC free article] [PubMed] [Google Scholar]
- 12.Draijer C, Peters-Golden M. Alveolar macrophages in allergic asthma: The forgotten cell awakes. Curr Allergy Asthma Rep. 2017;17:12. doi: 10.1007/s11882-017-0681-6. [DOI] [PMC free article] [PubMed] [Google Scholar]
- 13.Holtzman MJ, Byers DE, Alexander-Brett J, Wang X. The role of airway epithelial cells and innate immune cells in chronic respiratory disease. Nat Rev Immunol. 2014;14:686–698. doi: 10.1038/nri3739. [DOI] [PMC free article] [PubMed] [Google Scholar]
- 14.Miller GE, Chen E, Fok A, Walker H, Lim A, Nicholls EP, Cole SW, Kobor MS. Low early-life social class leaves a biological residue manifest by decreased glucocorticoid and increased pro-inflammatory signaling. Proc Natl Acad Sci U S A. 2009;106:14716–14721. doi: 10.1073/pnas.0902971106. [DOI] [PMC free article] [PubMed] [Google Scholar]
- 15.Elwenspoek MMC, Kuehn A, Muller CP, Turner JD. The effects of early life adversity on the immune system. Psychoneuroendocrinology. 2017;82:140–154. doi: 10.1016/j.psyneuen.2017.05.012. [DOI] [PubMed] [Google Scholar]
- 16.Lloyd CM, Hessel EM. Functions of T cells in asthma: more than just T(H)2 cells. Nat Rev Immunol. 2010;10:838–848. doi: 10.1038/nri2870. [DOI] [PMC free article] [PubMed] [Google Scholar]
- 17.Wright RJ, Visness CM, Calatroni A, Grayson MH, Gold DR, Sandel MT, Lee-Parritz A, Wood RA, Kattan M, Bloomberg GR, Burger M, Togias A, Witter FR, Sperling RS, Sadovsky Y, Gern JE. Prenatal maternal stress and cord blood Innate and adaptive cytokine responses in an inner-city cohort. Am J Respir Crit Care Med. 2010;182:25–33. doi: 10.1164/rccm.200904-0637OC. [DOI] [PMC free article] [PubMed] [Google Scholar]
- 18.Wright RJ, Finn P, Contreras JP, Cohen S, Wright RO, Staudenmayer J, Wand M, Perkins D, Weiss ST, Gold DR. Chronic caregiver stress and IgE expression, allergen-induced proliferation, and cytokine profiles in a birth cohort predisposed to atopy. J Allergy Clin Immunol. 2004;113:1051–1057. doi: 10.1016/j.jaci.2004.03.032. [DOI] [PubMed] [Google Scholar]
- 19.Chen E, Shalowitz MU, Story RE, Ehrlich KB, Manczak EM, Ham PJ, Le V, Miller GE. Parents’ childhood socioeconomic circumstances are associated with their children’s asthma outcomes. J Allergy Clin Immunol. doi: 10.1016/j.jaci.2016.11.040. in press, ePub ahead of print. [DOI] [PMC free article] [PubMed] [Google Scholar]
- 20.Cole SW, Hawkley LC, Arevalo JM, Cacioppo JT. Transcript origin analysis identifies antigen-presenting cells as primary targets of socially regulated gene expression in leukocytes. Proc Natl Acad Sci U S A. 2011;108:3080–3085. doi: 10.1073/pnas.1014218108. [DOI] [PMC free article] [PubMed] [Google Scholar]
- 21.Juniper EF, Guyatt GH, Feeny DH, Ferrie PJ, Griffith LE, Townsend M. Measuring quality of life in children with asthma. Qual Life Res. 1996;5:35–46. doi: 10.1007/BF00435967. [DOI] [PubMed] [Google Scholar]
- 22.Bacharier LB, Strunk RC, Mauger D, White D, Lemanske RFJ, Sorkness CA. Classifying asthma severity in children: mismatch between symptoms, medication use, and lung function. Am J Respir Crit Care Med. 2004;170:426–432. doi: 10.1164/rccm.200308-1178OC. [DOI] [PubMed] [Google Scholar]
- 23.Shi L, Jones WD, Jensen RV, Harris SC, Perkins RG, Goodsaid FM, Guo L, Croner LJ, Boysen C, Fang H, Qian F, Amur S, Bao W, Barbacioru CC, Bertholet V, Cao XM, Chu TM, Collins PJ, Fan XH, Frueh FW, Fuscoe JC, Guo X, Han J, Herman D, Hong H, Kawasaki ES, Li QZ, Luo Y, Ma Y, Mei N, Peterson RL, Puri RK, Shippy R, Su Z, Sun YA, Sun H, Thorn B, Turpaz Y, Wang C, Wang SJ, Warrington JA, Willey JC, Wu J, Xie Q, Zhang L, Zhang L, Zhong S, Wolfinger RD, Tong W. The balance of reproducibility, sensitivity, and specificity of lists of differentially expressed genes in microarray studies. BMC Bioinformatics. 2008;9(Suppl 9):S10. doi: 10.1186/1471-2105-9-S9-S10. [DOI] [PMC free article] [PubMed] [Google Scholar]
- 24.Cole SW, Galic Z, Zack JA. Controlling false-negative errors in microarray differential expression analysis: a PRIM approach. Bioinformatics. 2003;19:1808–1816. doi: 10.1093/bioinformatics/btg242. [DOI] [PubMed] [Google Scholar]
- 25.Cole SW, Yan W, Galic Z, Arevalo J, Zack JA. Expression-based monitoring of transcription factor activity: the TELiS database. Bioinformatics. 2005;21:803–810. doi: 10.1093/bioinformatics/bti038. [DOI] [PubMed] [Google Scholar]
- 26.Tanaka S, Suto A, Iwamoto T, Kashiwakuma D, Kagami S, Suzuki K, Takatori H, Tamachi T, Hirose K, Onodera A, Suzuki J, Ohara O, Yamashita M, Nakayama T, Nakajima H. Sox5 and c-Maf cooperatively induce Th17 cell differentiation via RORγt induction as downstream targets of Stat3. J Exp Med. 2014;211:1857–1874. doi: 10.1084/jem.20130791. [DOI] [PMC free article] [PubMed] [Google Scholar]
- 27.Castro G, Liu X, Ngo K, De Leon-Tabaldo A, Zhao S, Luna-Roman R, Yu J, Cao T, Kuhn R, Wilkinson P, Herman K, Nelen MI, Blevitt J, Xue X, Fourie A, Fung-Leung WP. RORγt and ROR7agr; signature genes in human Th17 cells. PLoS One. 2017;12:e0181868. doi: 10.1371/journal.pone.0181868. [DOI] [PMC free article] [PubMed] [Google Scholar]
- 28.Cohen S, Alper CM, Doyle WJ, Adler N, Treanor JJ, Turner RB. Objective and subjective socioeconomic status and susceptibility to the common cold. Health Psychol. 2008;27:268–274. doi: 10.1037/0278-6133.27.2.268. [DOI] [PubMed] [Google Scholar]
- 29.Cohen S, Janicki-Deverts D, Turner RB, Marsland AL, Casselbrant ML, Li-Korotky HS, Epel ES, Doyle WJ. Childhood socioeconomic status, telomere length, and susceptibility to upper respiratory infection. Brain Behav Immun. 2013;34:31–38. doi: 10.1016/j.bbi.2013.06.009. [DOI] [PMC free article] [PubMed] [Google Scholar]
- 30.Castillo JR, Peters SP, Busse WW. Asthma exacerbations: Pathogenesis, prevention, and treatment. J Allergy Clin Immunol Pract. 2017;5:918–927. doi: 10.1016/j.jaip.2017.05.001. [DOI] [PMC free article] [PubMed] [Google Scholar]
- 31.Chen E, Miller GE, Walker HA, Arevalo JM, Sung CY, Cole SW. Genome-wide transcriptional profiling linked to social class in asthma. Thorax. 2009;64:38–43. doi: 10.1136/thx.2007.095091. [DOI] [PMC free article] [PubMed] [Google Scholar]
- 32.Zhu J. T helper 2 (Th2) cell differentiation, type 2 innate lymphoid cell (ILC2) development and regulation of interleukin-4 (IL-4) and IL-13 production. Cytokine. 2015;75:14–24. doi: 10.1016/j.cyto.2015.05.010. [DOI] [PMC free article] [PubMed] [Google Scholar]
- 33.Chesné J, Braza F, Mahay G, Brouard S, Aronica M, Magnan A. IL-17 in severe asthma. Where do we stand. Am J Respir Crit Care Med. 2014;190:1094–1101. doi: 10.1164/rccm.201405-0859PP. [DOI] [PubMed] [Google Scholar]
- 34.Miller GE, Gaudin A, Zysk E, Chen E. Parental support and cytokine activity in childhood asthma: The role of glucocorticoid sensitivity. J Allergy Clin Immunol. 2009;123:824–830. doi: 10.1016/j.jaci.2008.12.019. [DOI] [PubMed] [Google Scholar]
- 35.Shankardass K, McConnell R, Jerrett M, Milam J, Richardson J, Berhane K. Parental stress increases the effect of traffic-related air pollution on childhood asthma incidence. Proc Natl Acad Sci U S A. 2009;106:12406–12411. doi: 10.1073/pnas.0812910106. [DOI] [PMC free article] [PubMed] [Google Scholar]
- 36.Chen E, Schreier HM, Strunk RC, Brauer M. Chronic traffic-related air pollution and stress interact to predict biologic and clinical outcomes in asthma. Environ Health Perspect. 2008;116:970–975. doi: 10.1289/ehp.11076. [DOI] [PMC free article] [PubMed] [Google Scholar]
- 37.Bose S, Chiu YM, Hsu HL, Di Q, Rosa MJ, Lee A, Kloog I, Wilson A, Schwartz J, Wright RO, Cohen S, Coull BA, Wright RJ. Prenatal nitrate exposure and childhood asthma: Influence of maternal prenatal stress and fetal sex. Am J Respir Crit Care Med. 2017 doi: 10.1164/rccm.201702-0421OC. [DOI] [PMC free article] [PubMed] [Google Scholar]
- 38.Kruschinski C, Skripuletz T, Bedoui S, Raber K, Straub RH, Hoffmann T, Grote K, Jacobs R, Stephan M, Pabst R, von Horsten S. Postnatal life events affect the severity of asthmatic airway inflammation in the adult rat. J Immunol. 2008;180:3919–3925. doi: 10.4049/jimmunol.180.6.3919. [DOI] [PubMed] [Google Scholar]
- 39.Canino G, McQuaid EL, Rand CS. Addressing asthma health disparities: a multilevel challenge. J Allergy Clin Immunol. 2009;123:1209–1217. doi: 10.1016/j.jaci.2009.02.043. [DOI] [PMC free article] [PubMed] [Google Scholar]
- 40.Clark NM. Community-based approaches to controlling childhood asthma. Annu Rev Public Health. 2012;33:193–208. doi: 10.1146/annurev-publhealth-031811-124532. [DOI] [PubMed] [Google Scholar]