Abstract
An Arabidopsis thaliana accession with naturally low vein density, Eifel-5 (Ei-5), was compared to Columbia-0 (Col-0) with respect to rosette growth, foliar vein architecture, photosynthesis, and transpiration. In addition to having to a lower vein density, Ei-5 grew more slowly, with significantly lower rates of rosette expansion, but had similar capacities for photosynthetic oxygen evolution on a leaf area basis compared to Col-0. The individual foliar minor veins were larger in Ei-5, with a greater number of vascular cells per vein, compared to Col-0. This compensation for low vein density resulted in similar values for the product of vein density × phloem cell number per minor vein in Ei-5 and Col-0, which suggests a similar capacity for foliar sugar export to support similar photosynthetic capacities per unit leaf area. In contrast, the product of vein density × xylem cell number per minor vein was significantly greater in Ei-5 compared to Col-0, and was associated not only with a higher ratio of water-transporting tracheary elements versus sugar-transporting sieve elements but also significantly higher foliar transpiration rates per leaf area in Ei-5. In contrast, previous studies in other systems had reported higher ratios of tracheary to sieve elements and higher transpiration rate to be associated with higher – rather than lower – vein densities. The Ei-5 accession thus further underscores the plasticity of the foliar vasculature by illustrating an example where a higher ratio of tracheary to sieve elements is associated with a lower vein density. Establishment of the Ei-5 accession, with a low vein density but an apparent overcapacity for water flux through the foliar xylem network, may have been facilitated by a higher level of precipitation in its habitat of origin compared to that of the Col-0 accession.
Keywords: Arabidopsis thaliana, phloem, photosynthesis, transpiration, vein density, xylem
Introduction
The maximal capacity of a leaf to carry out photosynthesis is closely coordinated with the capacity of the foliar vasculature for sugar and water transport, and these features co-vary in response to the growth environment as has been documented in several genotypes of the winter annual Arabidopsis thaliana (Cohu et al., 2013a,b; Adams et al., 2016; Stewart et al., 2016, 2017a,b, 2018). Foliar vascular modulation in response to the growth environment includes adjustment in vein density (Amiard et al., 2005; Adams et al., 2007, 2013a, 2016; Dumlao et al., 2012; Muller et al., 2014b; Stewart et al., 2016, 2017a,b), number of vascular cells per minor vein (Adams et al., 2013a, 2016; Cohu et al., 2013a,b, 2014; Muller et al., 2014b; Stewart et al., 2016, 2017a,b), size of individual vascular cells (Adams et al., 2013a; Muller et al., 2014b; Stewart et al., 2017a,b), and the ultrastructure of phloem transfer cells (Amiard et al., 2005, 2007; Adams et al., 2014a, 2016). Such modulation of foliar vascular features is predicted to support photosynthesis as the need for water import and sugar export change in response to the growth environment. Leaves need to replace water lost during CO2 uptake in order to keep stomata open for photosynthesis (Brodribb et al., 2007; Hölttä et al., 2017; Sperry et al., 2017). In addition, expedient removal of sugar produced in photosynthesis counteracts carbohydrate build-up in leaves and downregulation of photosynthesis (Krapp et al., 1993; Krapp and Stitt, 1995; Pego et al., 2000; Kasai, 2008; Adams et al., 2013b, 2014b).
The foliar vascular architecture is highly flexible and exhibits acclimatory adjustment of its components in response to environmental conditions and dependent on genotype. However, minor vein anatomical features consistently correlated with leaf function across this variation among genotypes and environmental conditions. Under all conditions, adjustment of minor-vein phloem features involved in sugar-loading and sugar-export capacity closely matched adjustment of photosynthetic capacity (Adams et al., 2013a, 2014a, 2016; Cohu et al., 2013a,b, 2014; Muller et al., 2014b; Stewart et al., 2016, 2017a,b). Conversely, adjustment of vein density and xylem features of minor veins involved in leaf hydraulic conductivity closely matched transpiration rates under all conditions (Adams et al., 2016; Stewart et al., 2016, 2017a,b). For instance, acclimation to high versus low light involved parallel upregulation of foliar vascular features associated with higher capacities for both sugar and water transport, of photosynthetic capacities, and of transpiration rates (Stewart et al., 2017a,b).
In addition to concomitant changes in foliar vascular features and photosynthetic capacity, the foliar vasculature can also be packaged differently to support similar photosynthetic capacities. For instance, leaves of summer annuals typically exhibit numerous minor veins that are of small size, whereas winter annuals typically have leaves with fewer, but larger minor veins (Demmig-Adams et al., 2014; Polutchko et al., 2018; see also Cohu et al., 2014; Stewart et al., 2016). Under the growth conditions and in the A. thaliana genotypes examined thus far, a higher vein density was consistently associated with a higher proportion of transpiration to photosynthesis, xylem to phloem, and water conduits to sugar conduits (Adams et al., 2016; Stewart et al., 2016, 2017a,b, 2018). Investigations of mutants with altered foliar vascular phenotypes have also reported corresponding differences in leaf functioning relative to wild-type (e.g., Caringella et al., 2015; Feldman et al., 2017). The present study uses a naturally occurring low-vein-density phenotype to evaluate whether these associations are fixed or exhibit acclimatory flexibility.
Some A. thaliana accessions exhibit naturally occurring unusual foliar vein densities as rare occurrences in nature. In a survey of over 250 A. thaliana accessions, Candela et al. (1999) discovered only two (Eifel-5 and Blackmount-1) with foliar vein densities that were “unequivocally different” from others in the study (see also Pérez-Pérez et al., 2009). Of these two accessions, Eifel-5 (Ei-5) had the most simplified venation pattern, resulting from a recessive allele of HVE/CAND1 (Alonso-Peral et al., 2006) – a gene involved in auxin signaling (see also Cheng et al., 2004). We asked whether such a genetically imposed constraint limits the ability of this accession to deliver water and export sugars, thereby resulting in lower rates of photosynthesis. Or does minor-vein composition and architecture of the Ei-5 accession undergo compensatory adjustments to maintain water- and sugar-transport capacities per unit leaf area? The present study compared foliar anatomical and physiological characteristics of the low-vein-density Ei-5 accession with the widely studied Col-0 accession of A. thaliana.
Materials and Methods
Plant Material
Seeds of both the Columbia-0 (Col-0) and low-vein-density Eifel-5 (Ei-5; CS1128) accessions of A. thaliana were obtained from The Arabidopsis Information Resource1. The Columbia accession originates from northwestern Poland (52.7°N, 15.7°E; from El-Lithy et al., 2004; see also Rédei, 1992; Koornneef and Meinke, 2010) and the Eifel accession originates from western Germany (50.3°N, 6.3°E; from the Master Accession List on 1001 Genomes’ website2), the sites of which are separated by 702 km (calculated with Latitude/Longitude Distance Calculator on NOAA’s website3). Daylength data of the geographic sites from which the accessions originate were obtained from The United States Naval Observatory’s website4. Altitude, temperature, and precipitation data of the geographic sites from which the accessions originate were obtained from the WorldClim database (Hijmans et al., 20055) with DIVA-GIS software (Hijmans et al., 20126). The Col-0 and low-vein-density Ei-5 accessions of A. thaliana thus experienced similar photoperiods (Figures 1A,B) and similar temperatures (Figures 1C,D) over the course of the year, but the Ei-5 accession received almost twice as much annual precipitation compared to Col-0 (1034 mm vs. 558 mm, respectively; Figures 1E,F).
FIGURE 1.
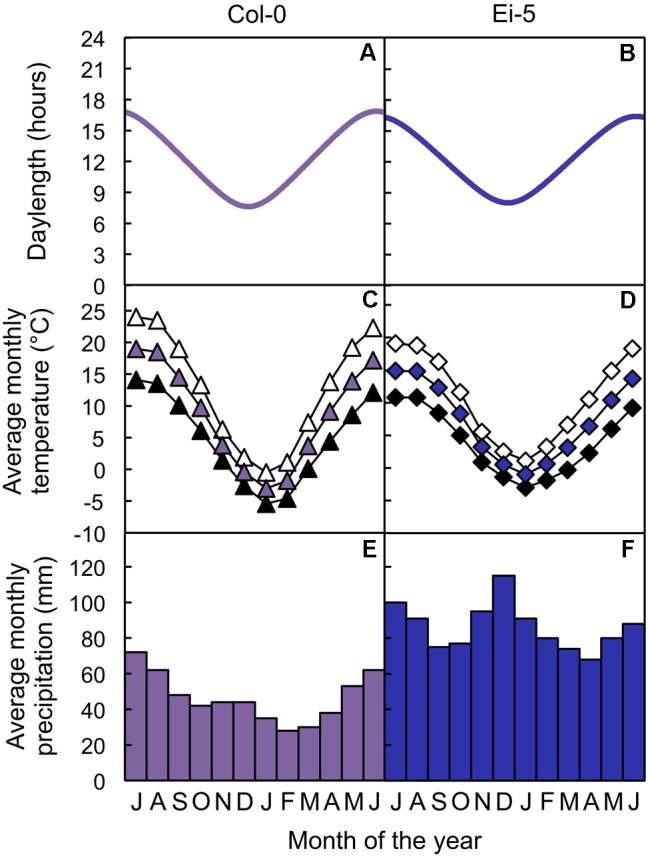
(A,B) Photoperiods, (C,D) average monthly maximum (open symbols), mean (colored symbols), and minimum (closed symbols) temperatures, and (E,F) average monthly precipitation totals of the sites from which the (A,C,E) Col-0 (violet) and (B,D,F) low-vein-density Ei-5 (indigo) accessions of Arabidopsis thaliana originate.
Growth Conditions
Col-0 and Ei-5 were grown under contrasting light intensities of 100 μmol vs. 1000 μmol photons m-2 s-1 at a common leaf temperature of 20°C as previously described (Stewart et al., 2017a). Seeds were incubated in water at 4°C for 4 days and germinated in six-pack seed starting trays (maximal volume of 50 mL) containing soil (Fafard Growing Mix 2; Sun Gro Horticulture, Agawam, MA, United States) in Conviron E15 and PGR15 growth chambers (Controlled Environments Ltd., Winnipeg, MB, Canada) with air temperatures set at 25°C during a 9-h photoperiod of 100 or 1000 μmol photons m-2 s-1 and 20°C during the 15-h dark period. Following germination and the removal of excess seedlings, individual seedlings were transplanted with soil from their respective cells into larger pots (maximal volume of 2.9 L). Under the high light regime, seedlings were transferred to a constant air temperature of 15°C for 1 week before being transferred to the final growth temperature of 12°C, which resulted in leaf temperatures of 20°C during the photoperiod and 12°C during the dark period. Under the low light conditions, seedlings were transferred to 20°C/15°C (light/dark) for 1 week before being transferred to the final growth temperature of 20°C during the photoperiod and 12°C during the dark period. Plants received nutrients (Jack’s Professional LX Water-Soluble Fertilizer, J.R. Peters, Inc., Allentown, PA, United States) via a Dosatron D14MZ2 injector system (Dosatron International, Inc., Clearwater, FL, United States) every other day and water on days when they did not receive nutrients (Stewart et al., 2017b).
Photosynthesis and Transpiration
Photosynthetic capacity was determined as the light- (1500 [low-light plants] or 2000 [high-light plants] μmol photons m-2 s-1) and CO2- (50,000 ppm) saturated rate of oxygen evolution using actinic light sources and leaf-disk oxygen electrode chambers (Hansatech Instruments, King’s Lynn, Norfolk, United Kingdom; Delieu and Walker, 1981; Adams et al., 2002) coupled to circulating water baths (Fisher Scientific, Pittsburgh, PA, United States) set to 25°C. For measurements of transpirational water loss and CO2 uptake, plants were removed from the growth chamber one at a time approximately 5 h into the photoperiod and exposed to either 100 or 1000 μmol photons m-2 s-1 (the light intensity during the photoperiod for plants grown under low or high light intensity, respectively) in air (409 ± 30 ppm CO2) for approximately 5 min, resulting in leaf temperatures of 27.4 ± 1.4°C and vapor-pressure deficits of 2.14 ± 0.23 kPa (n = 16). Transpiration rate and CO2 uptake were measured with an LCi Portable Photosynthesis System (ADC Bioscientific, Hoddesdon, England, United Kingdom).
Leaf and Vein Anatomical Metrics
Rosette area was determined as the total light-exposed leaf area per plant from images taken directly above the plants and quantified using ImageJ software (Rasband WS, National Institutes of Health, Bethesda, MD, United States) as described in Stewart et al. (2015). Leaf mass per area was determined from leaf disks that were dried at 70°C for 1 week. Foliar vein density was assessed as vein length per leaf area from leaf sections that had been chemically cleared by soaking leaf tissue in 70% (v/v) ethanol and then 5% (w/v) NaOH (described in Stewart et al., 2017a). For the determination of foliar vein orders, chemically cleared leaf sections were stained with a dilute (0.01% [w/v]) Safranin O solution and imaged with a high-resolution scanner (Perfection 3200 Photo; Epson America, Inc., Long Beach, CA, United States). Foliar vein cross-sectional area and cell numbers were determined as described in Cohu et al. (2013a) from semi-thin (0.7–0.9 μm) cross-sections that were obtained with an Ultracut E microtome (Reichert Technologies Life Science, Buffalo, NY, United States) from leaf pieces (approximately 2 mm × 2 mm) that had been fixed in glutaraldehyde and paraformaldehyde, dehydrated through an acetone series, and embedded in Spurr resin (Spurr, 1969) as described by Dumlao et al. (2012; see also Stewart et al., 2017b). For Ei-5 plants grown under low light, five to six foliar veins per plant were characterized — rather than the seven to ten per plant described in Cohu et al. (2013a) — due to the relative scarcity of appropriate foliar vein cross-sections. Foliar vein density, cross-sectional area, and cell numbers were measured with ImageJ from images that were obtained using an Axioskop 20 light microscope (Carl Zeiss AG, Oberkochen, Germany) and an OptixCam Summit Series digital microscope camera and OCView software (The Microscope Store, LLC, Roanoke, VA, United States).
Statistical Analyses
Differences between Col-0 and the low-vein-density Ei-5 accession were assessed via t-tests. The effects of genotype, growth light intensity, and genotypic response to growth light intensity were assessed via two-way analysis of variance. The relationship between groups with consideration of multiple variables was assessed via principal component analysis (see Polutchko et al., 2018). Non-linear growth curves for rosette area data were generated using a three-parameter logistic model (Paine et al., 2012), which has been used for similar analyses of A. thaliana (e.g., Tessmer et al., 2013). All statistical analyses were conducted with JMP software (Pro 13.1; SAS Institute, Inc., Cary, NC, United States).
Results
The rosettes of the low-vein-density Ei-5 accession were consistently much smaller than those of Col-0 when grown under either low or high light at 20°C (Figure 2). The difference in rosette size was significant after a short period of growth, and became increasingly more pronounced over time as plants continued to grow (Figure 3). All vein orders (from largest [i.e., 1°] to smallest [i.e., 4°] veins) were present in the leaves of the two accessions under both low and high growth light (Figure 4). Minor-vein density was significantly lower in Ei-5 compared to Col-0 (Figure 5A and Table 1), but the number of vascular cells per minor vein was significantly greater in Ei-5 (Figure 5B and Table 1). These latter two differences compensated for each other, and total vascular cell number normalized for vein density was the same in the two accessions, as ascertained by multiplication of foliar vein density × the number of vascular cells per minor vein (Figure 5C and Table 1). Additional complexity was revealed when minor-vein xylem and phloem components were considered separately. The difference in cell number per minor vein between the two accessions grown under high light was even more pronounced for xylem (Figure 6A) than for phloem (Figure 6B), resulting in a greater ratio of xylem to phloem cells in the minor veins of Ei-5 compared to Col-0 (Figure 6C and Table 1).
FIGURE 2.
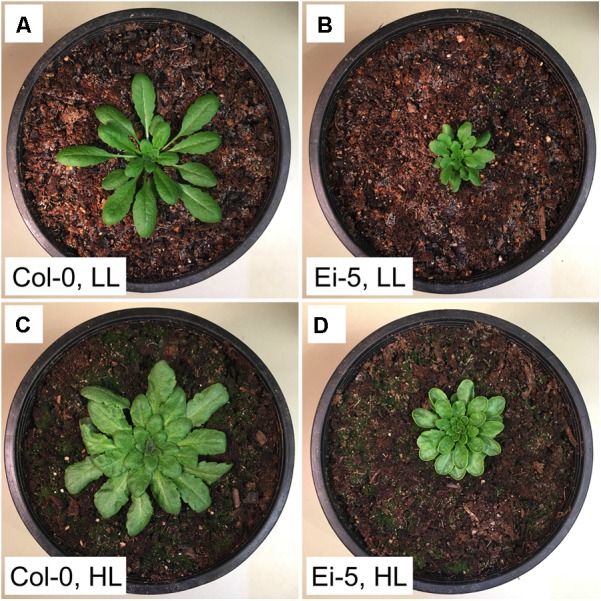
Photographic images of the (A,C) Col-0 and (B,D) low-vein-density Ei-5 accessions of A. thaliana grown under a 9-h photoperiod of (A,B) 100 (LL) or (C,D) 1000 (HL) μmol photons m-2 s-1 at a leaf temperature of 20°C for 42 days.
FIGURE 3.
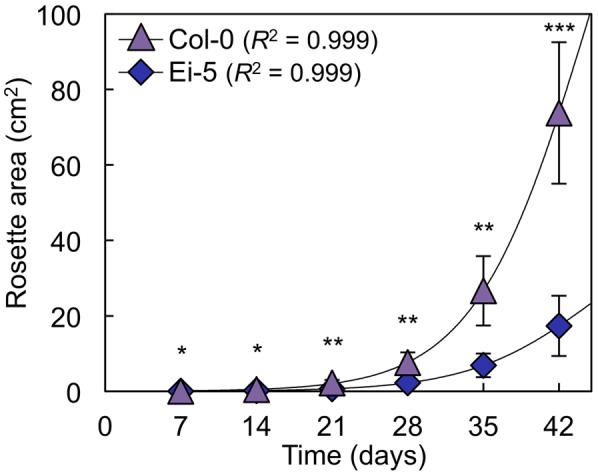
Total light-exposed rosette area per plant determined at weekly intervals for the Col-0 (violet triangles) and low-vein-density Ei-5 (indigo diamonds) accessions of A. thaliana during 42 days of growth under a 9-h photoperiod of 1000 μmol photons m-2 s-1 at a leaf temperature of 20°C. Non-linear growth curves were generated using three-parameter logistic models (Paine et al., 2012). Mean values ± standard deviations, n = 4. The asterisks denote significant differences between accessions in rosette size; ∗P < 0.05, ∗∗P < 0.01, and ∗∗∗P < 0.001.
FIGURE 4.
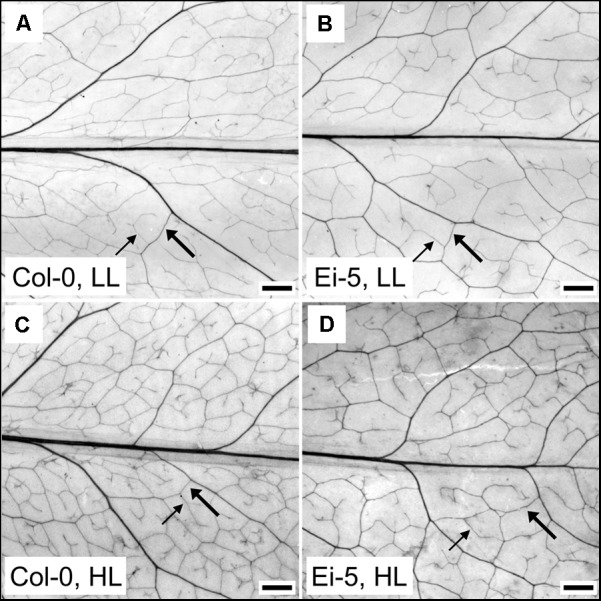
Images of representative chemically cleared leaves of the (A,C) Col-0 and (B,D) low-vein-density Ei-5 accessions of A. thaliana grown under a 9-h photoperiod of (A,B) 100 (LL) or (C,D) 1000 (HL) μmol photons m-2 s-1 at a leaf temperature of 20°C. To better visualize the leaf vascular network, the contrast of each image was enhanced using the “Auto Contrast” feature in Adobe Photoshop CS4 (Adobe Photosystems, Inc., San Jose, CA, United States). Representative third (3°) and fourth (4°) order minor veins are indicated with thick and thin arrows, respectively. Scale bar = 1 mm.
FIGURE 5.
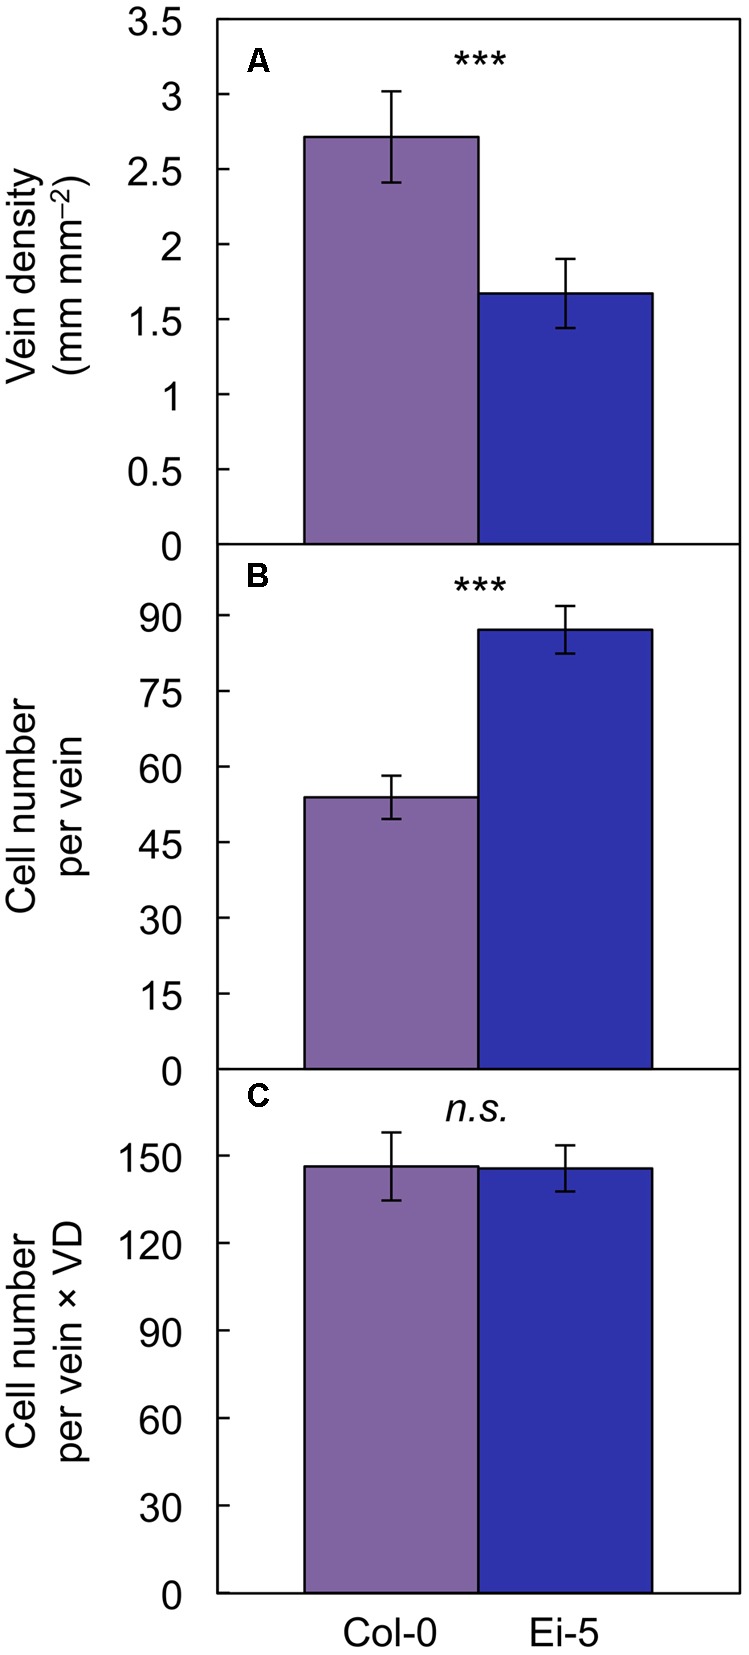
The (A) foliar vein density, (B) number of cells per minor vein, and (C) product of vein density and the number of cells per minor vein in the Col-0 (violet columns) and low-vein-density Ei-5 (indigo columns) accessions of A. thaliana grown under a 9-h photoperiod of 1000 μmol photons m-2 s-1 at a leaf temperature of 20°C. Mean values ± standard deviation for (A) and ±standard error for (B,C); n = 4. The asterisks denote significant differences between the mean values; ∗∗∗P < 0.001 and n.s., not significantly different.
Table 1.
Leaf minor vein features and gas exchange for the Col-0 and low-vein-density Ei-5 accessions of Arabidopsis thaliana grown under a 9-h photoperiod of 100 μmol photons m-2 s-1 at a leaf temperature of 20°C.
| Low light |
|||
|---|---|---|---|
| Parameter | Col-0 | Ei-5 | P |
| Minor vein density (mm mm-2) | 2.12 @ 0.10 | 1.52 @ 0.12 | ∗∗∗ |
| Cells per minor vein | 39.4 @ 1.9 | 54.9 @ 1.4 | ∗∗∗ |
| Cells per minor vein × vein density | 83.8 @ 4.1 | 83.6 @ 2.1 | n.s. |
| Xylem cells per minor vein | 5.8 @ 0.6 | 10.7 @ 0.9 | ∗∗ |
| Phloem cells per minor vein | 30.6 @ 1.2 | 39.7 @ 1.7 | ∗∗ |
| Ratio of xylem to phloem cells | 0.187 @ 0.017 | 0.273 @ 0.034 | ∗ |
| Tracheary elements per minor vein | 3.46 @ 0.37 | 6.53 @ 0.47 | ∗∗ |
| Sieve elements per minor vein | 7.0 @ 0.4 | 10.2 @ 0.6 | ∗∗ |
| CCs + PCs per minor vein | 23.7 @ 0.8 | 29.5 @ 1.2 | ∗∗ |
| Ratio of tracheary to sieve elements | 0.509 @ 0.054 | 0.666 @ 0.069 | n.s. |
| Photosynthetic capacity (μmol O2 m-2 s-1) | 16.0 @ 3.3 | 16.0 @ 0.8 | n.s. |
| Phloem cells per minor vein × vein density | 65.1 @ 2.5 | 60.4 @ 2.6 | n.s. |
| Sieve elements per minor vein × vein density | 14.8 @ 0.9 | 15.5 @ 0.9 | n.s. |
| CCs + PCs per minor vein × vein density | 50.3 @ 1.8 | 44.9 @ 1.9 | ∗ |
| Transpiration ratio (mol H2O mol-1 CO2) | 321 @ 59 | 705 @ 206 | ∗∗ |
| Xylem cells per minor vein × vein density | 12.4 @ 1.4 | 16.3 @ 1.3 | ∗ |
| Tracheary elements per minor vein × vein density | 7.36 @ 0.79 | 9.95 @ 0.71 | ∗ |
Mean values ± standard deviation for vein density and gas exchange parameters and ± standard error for minor vein parameters; n = 3–4. The asterisks denote significant differences between the mean values; ∗P < 0.05, ∗∗P < 0.01, ∗∗∗P < 0.001, and n.s., not significantly different. CC, companion cells; PC, phloem parenchyma cells.
FIGURE 6.
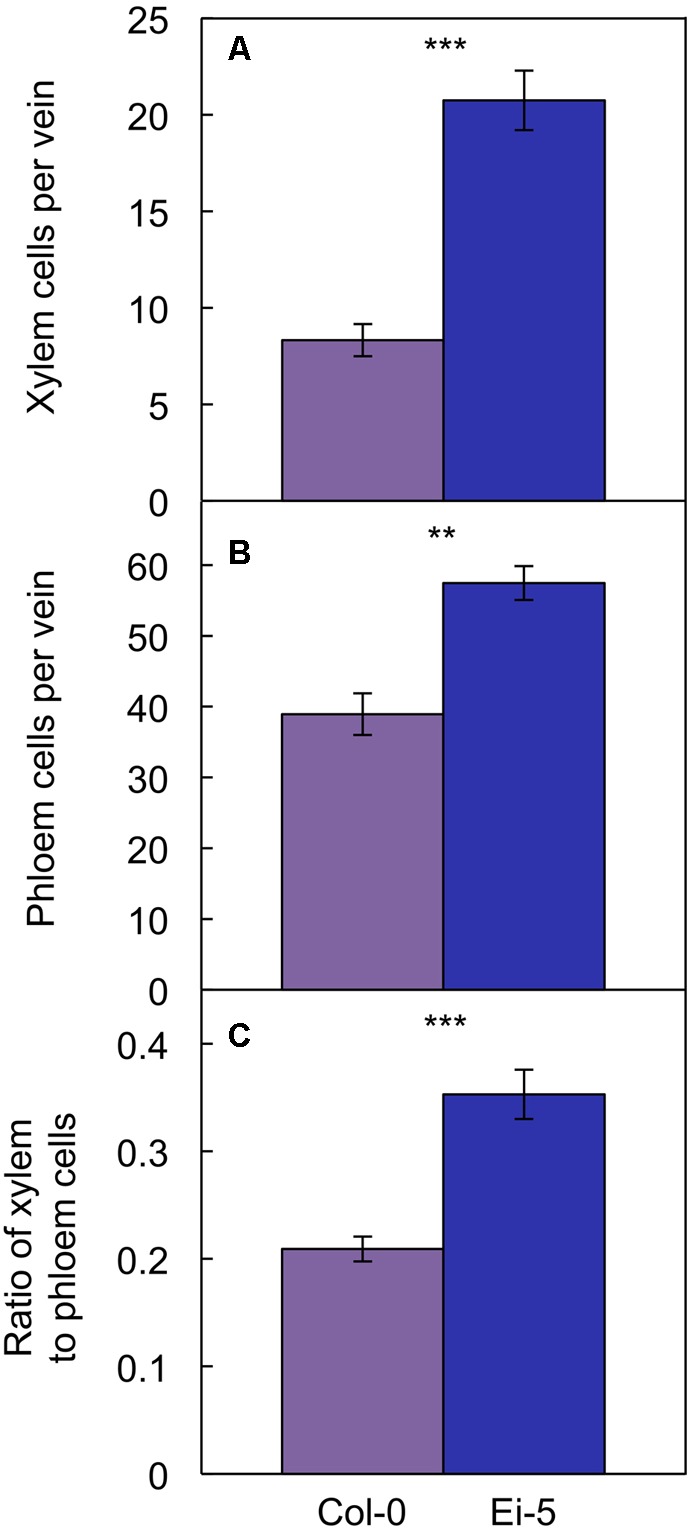
The number of (A) xylem cells per minor vein, (B) phloem cells per minor vein, and (C) ratio of xylem to phloem cells in minor veins of the Col-0 (violet columns) and low-vein-density Ei-5 (indigo columns) accessions of A. thaliana grown under a 9-h photoperiod of 1000 μmol photons m-2 s-1 at a leaf temperature of 20°C. Mean values ± standard errors; n = 4. The asterisks denote significant differences between the mean values; ∗∗P < 0.01, ∗∗∗P < 0.001.
Probing into the cell types comprising xylem or phloem confirmed these trends. Comparing Ei-5 with Col-0, the xylem’s tracheary elements were even more enhanced in their numbers per minor vein (Figure 7A and Table 1) than the phloem’s sieve elements (Figure 7B and Table 1) or companion cells and phloem parenchyma cells (Figure 7C and Table 1). These differential adjustments resulted in a higher ratio of water-transporting tracheary elements to sugar-transporting sieve elements in minor veins of Ei-5 compared to Col-0 that was, again, significant only under high growth light (Figure 7D and Table 1).
FIGURE 7.
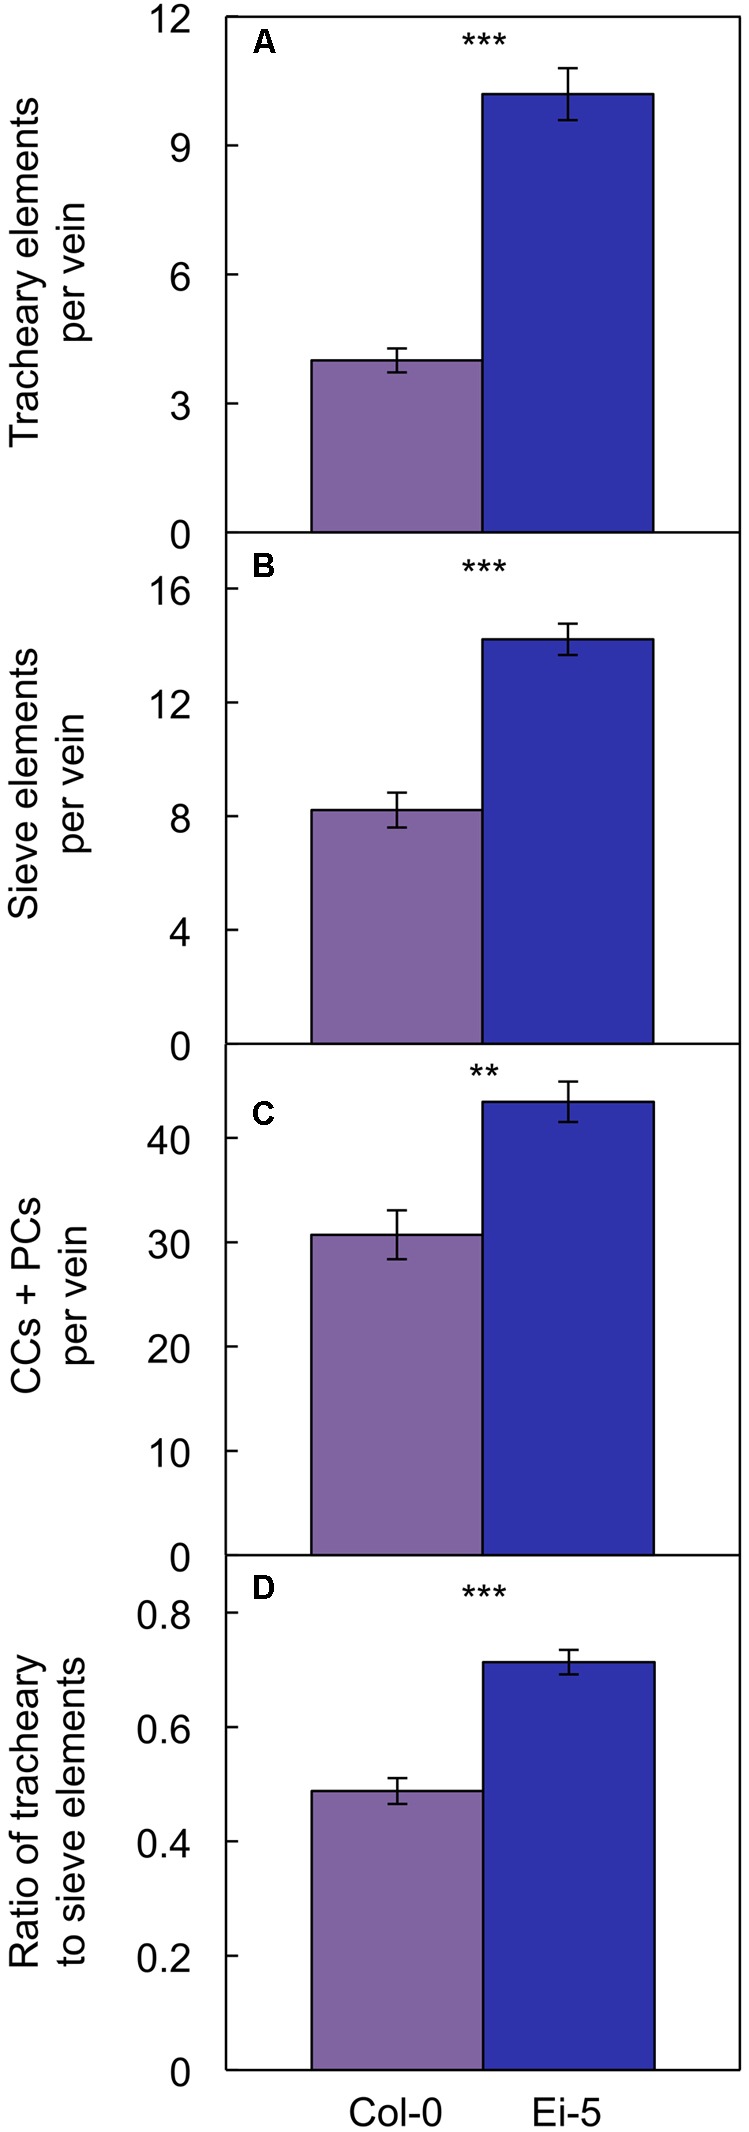
The number of (A) tracheary elements per minor vein, (B) sieve elements per minor vein, (C) companion cells (CCs) plus phloem parenchyma cells (PCs) per minor vein, and (D) ratio of tracheary to sieve elements in minor veins of the Col-0 (violet columns) and low-vein-density Ei-5 (indigo columns) accessions of A. thaliana grown under a 9-h photoperiod of 1000 μmol photons m-2 s-1 at a leaf temperature of 20°C. Mean values ± standard error, n = 4. The asterisks denote significant differences between the mean values; ∗∗P < 0.01, ∗∗∗P < 0.001.
Multiplying the cell number of various phloem cell types per minor vein × vein density revealed that there was no significant difference between the two accessions in phloem cell numbers per minor vein so normalized for vein density for leaves grown under high light (Figures 8B–D). This finding of no significant difference in cell number per minor vein when normalized for vein density applied to the sum of all phloem cells (Figure 8B and Table 1) as well as to those cells (sieve elements) serving as conduits for moving sugars out of the leaf (Figure 8C and Table 1) of leaves grown under either high or low light. For the cells involved solely in phloem loading (CCs + PCs), there was likewise no difference when normalized for vein density in leaves grown in high light (Figure 8D); however, there were slightly fewer phloem-loading cells in Ei-5 leaves grown in low light compared to Col-0 (Table 1). The similarity between the accessions in the number of phloem cells per minor vein after normalization for vein density is consistent with their similar photosynthetic capacity (Figure 8A and Table 1) and CO2 uptake for leaves grown in high light (29.4 ± 5.9 μmol m-2 s-1 vs. 32.7 ± 5.9 μmol m-2 s-1 in Col-0 vs. Ei-5, respectively).
FIGURE 8.
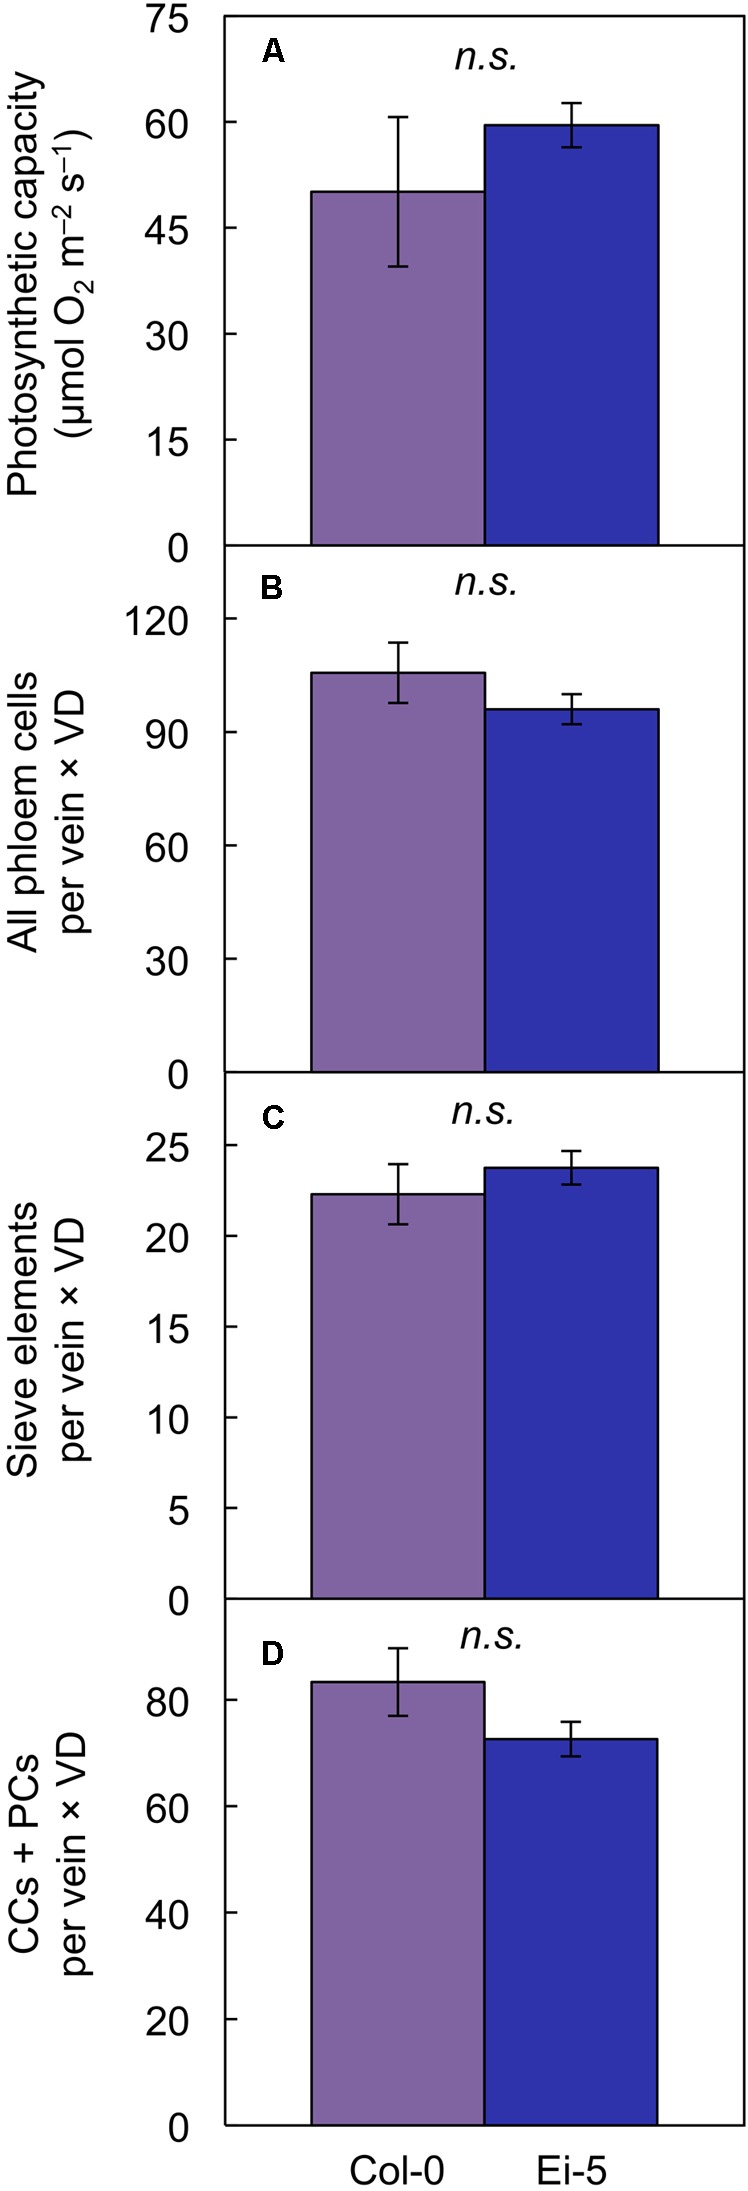
The (A) light- and CO2-saturated rate of photosynthetic oxygen evolution (photosynthetic capacity), (B) product of the number of phloem cells per minor vein and vein density, (C) product of the number of sieve elements per minor vein and vein density, and (D) product of the number of companion cells (CCs) plus phloem parenchyma cells (PCs) per minor vein and vein density in leaves of the Col-0 (violet columns) and low-vein-density Ei-5 (indigo columns) accessions of A. thaliana grown under a 9-h photoperiod of 1000 μmol photons m-2 s-1 at a leaf temperature of 20°C. Mean values ± standard deviations for (A) and ± standard errors for (B–D); n = 4. There was no significant difference (n.s.) between any of the mean values.
However, transpiration rate per leaf area (Figure 9A) and the ratio of transpirational water loss to CO2 uptake (Figure 9B and Table 1) were both significantly higher in Ei-5 compared to Col-0, which is consistent with the difference in the ratio of tracheary elements to sieve elements between the two accessions (Figure 7D and Table 1). To make a more direct comparison to transpiration rate on a leaf area basis, the number of minor-vein xylem cells and tracheary elements was normalized for leaf area by multiplication × vein density, revealing significantly higher normalized numbers of both minor-vein xylem cells (Figure 9C and Table 1) and water-transporting tracheary elements (Figure 9D and Table 1) in Ei-5 compared to Col-0.
FIGURE 9.
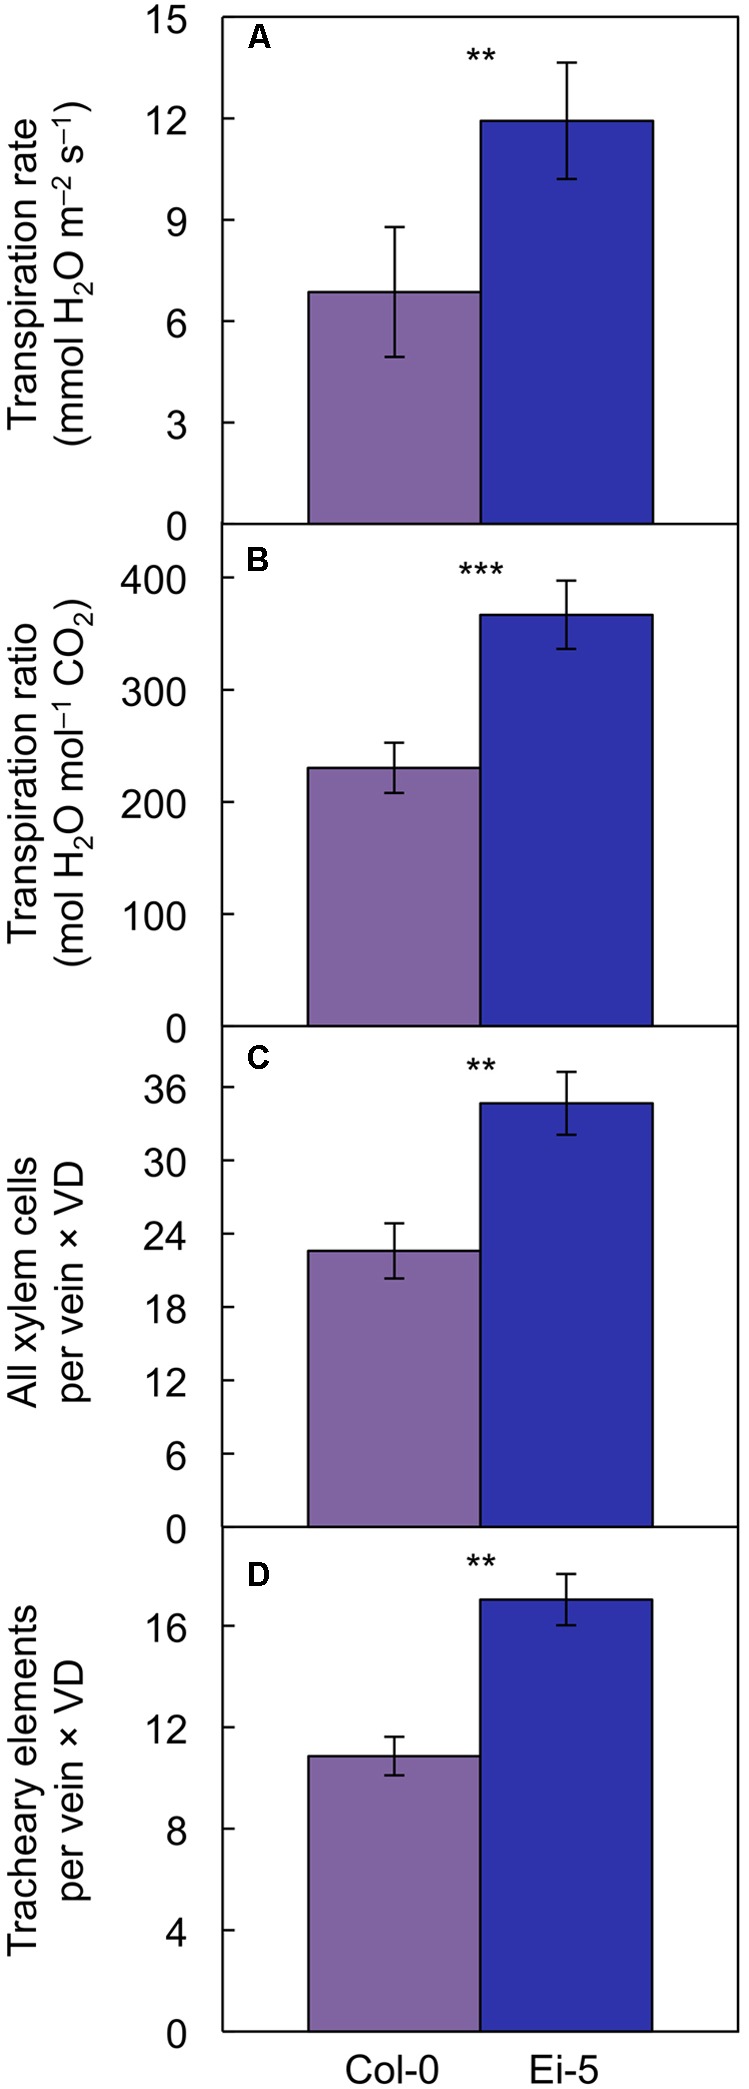
The (A) rate of transpirational water loss, (B) ratio of transpirational water loss to CO2 uptake, (C) product of the number of xylem cells per minor vein and vein density, and (D) product of the number of tracheary elements per minor vein and vein density in leaves of the Col-0 (violet columns) and low-vein-density Ei-5 (indigo columns) accessions of A. thaliana grown under a 9-h photoperiod of 1000 μmol photons m-2 s-1 at a leaf temperature of 20°C. Mean values ± standard deviations for (A,B) and ± standard errors for (C,D); n = 4. The asterisks denote significant differences between the mean values; ∗∗P < 0.01, ∗∗∗P < 0.001.
A two-way analysis of variance revealed a highly significant effect of genotype on all minor-vein and gas-exchange parameters with the exception of vascular cell numbers per minor vein normalized for vein density (Table 2). The impact of growth light intensity was also significant for all parameters except for the ratio of tracheary to sieve elements in the minor veins (Table 2). The interaction of genotype and growth light intensity was only significant for the number of vascular cells (xylem cells and tracheary and sieve elements) per minor vein and the transpiration ratio (Table 2).
Table 2.
Results of a two-way analysis of variance for the effect of genotype, growth light intensity, and the degree of genotype response to growth light intensity for parameters in Table 1 and scores of principal components 1 and 2 (see Figure 10).
| Parameter | Genotype | Light | Genotype × Light |
|---|---|---|---|
| Minor vein density (mm mm-2) | ∗∗∗ | ∗∗ | n.s. |
| Cells per minor vein | ∗∗∗ | ∗∗∗ | ∗ |
| Cells per minor vein × vein density | n.s. | ∗∗∗ | n.s. |
| Xylem cells per minor vein | ∗∗∗ | ∗∗∗ | ∗∗ |
| Phloem cells per minor vein | ∗∗∗ | ∗∗∗ | n.s. |
| Ratio of xylem to phloem cells | ∗∗∗ | ∗ | n.s. |
| Tracheary elements per minor vein | ∗∗∗ | ∗∗∗ | ∗∗ |
| Sieve elements per minor vein | ∗∗∗ | ∗∗∗ | ∗ |
| CCs + PCs per minor vein | ∗∗∗ | ∗∗∗ | n.s. |
| Ratio of tracheary to sieve elements | ∗∗ | n.s. | n.s. |
| Photosynthetic capacity (μmol O2 m-2 s-1) | n.s. | ∗∗∗ | n.s. |
| Phloem cells per minor vein × vein density | n.s. | ∗∗∗ | n.s. |
| Sieve elements per minor vein × vein density | n.s. | ∗∗∗ | n.s. |
| CCs + PCs per minor vein × vein density | n.s. | ∗∗∗ | n.s. |
| Transpiration ratio (mol H2O mol-1 CO2) | ∗∗∗ | ∗∗∗ | ∗ |
| Xylem cells per minor vein × vein density | ∗∗ | ∗∗∗ | n.s. |
| Tracheary elements per minor vein × vein density | ∗∗∗ | ∗∗∗ | n.s. |
| Principal component 1 | ∗∗∗ | ∗∗∗ | ∗∗∗ |
| Principal component 2 | ∗∗∗ | ∗∗∗ | ∗∗∗ |
The asterisks denote significant effects; ∗P < 0.05, ∗∗P < 0.01, ∗∗∗P < 0.001, and n.s., not significant. CC, companion cells; PC, phloem parenchyma cells.
Principal component analysis was conducted to evaluate the difference in overall vascular organization between the low-vein-density Ei-5 accession and various other A. thaliana accessions and several summer annual crops (Figure 10). This analysis included minor-vein density and cross-sectional area, as well as the number of sieve elements, tracheary elements, and the sum of companion cells plus phloem parenchyma cells per minor vein in leaves of Ei-5, Col-0, two A. thaliana ecotypes from Sweden and Italy (Ågren and Schemske, 2012; see also Adams et al., 2016), and eight summer annual crops: cotton, cucumber, pumpkin, squash, sunflower, tobacco, tomato, and watermelon (for more details, see Muller et al., 2014b; Polutchko et al., 2018). The first principal component (PC1) explained 86.7% of the variation in this data set and was driven negatively by minor-vein density and positively by minor-vein cross-sectional area and cell numbers (Figure 10B). The summer annuals and A. thaliana completely separated along PC1, with negative PC1 scores for all summer annuals and positive PC1 scores for all A. thaliana (Figure 10A). Density ellipses (P = 0.950) encapsulated 80 out of 83 summer annuals and 73 out of 78 A. thaliana points, with five of seven Ei-5 points falling outside of the latter ellipse (Figure 10A). In addition, all four Ei-5 points from the high light plants had more positive PC1 scores than all of the other 74 A. thaliana points, and the three Ei-5 points from low light had PC1 scores that were considerably more positive than their low light Col-0 counterparts (Figure 10A). The second principal component was driven primarily by foliar vein density and vein cross-sectional area, although it should be noted that this component explained less than 10% of the variation in the data set. The effects of genotype and growth light intensity, as well as the interaction of genotype and growth light intensity, were highly significant for the scores of the first two principal components (Table 2). In summary, the accessions of the winter annual A. thaliana formed a cluster that segregated completely from summer annual species, with lower vein density, larger veins, and greater numbers of all vascular cell types in the winter annual. Ei-5 aligned with all of the other A. thaliana ecotypes, but extended the range to even lower vein densities and larger veins with greater numbers of vascular cells.
FIGURE 10.
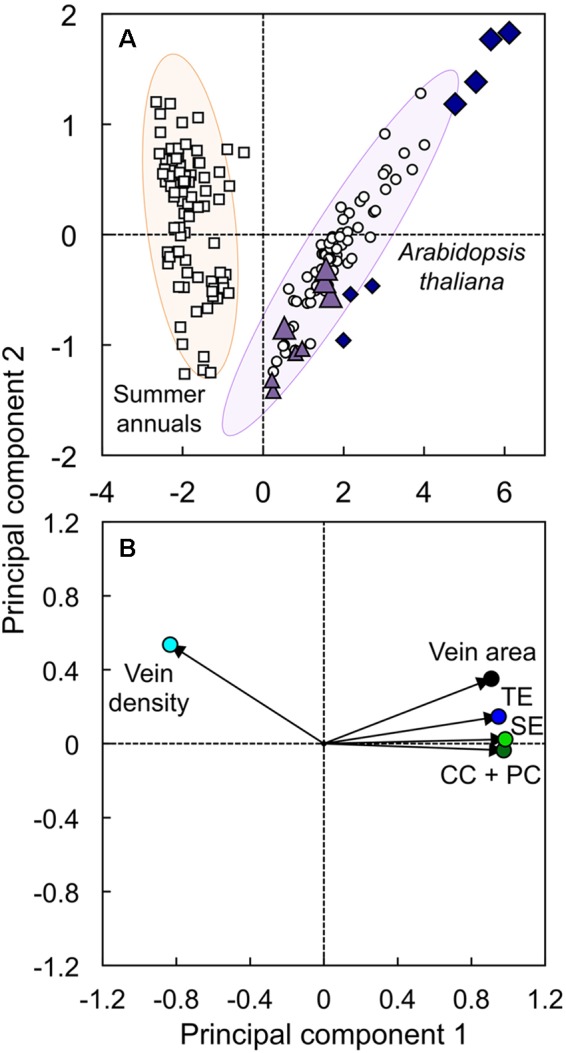
The (A) score and (B) loading plots from a principal component analysis of foliar vein density (light blue circle), minor vein cross-sectional area (black circle), and number of tracheary elements (TE; dark blue circle), sieve elements (SE; green circle), and companion cells plus phloem parenchyma cells (CC + PC; dark green circle) per minor vein in leaves of the Col-0 (violet triangles) and low-vein-density Ei-5 (indigo diamonds) accessions of A. thaliana grown under a 9-h photoperiod of 100 (small triangles and diamonds) or 1000 (large triangles and diamonds) μmol photons m-2 s-1 at a leaf temperature of 20°C, as well as leaves of Col-0, Italian and Swedish ecotypes of A. thaliana (open circles; n = 67), and summer annual crop species (open squares; n = 83) grown under multiple experimental conditions. Principal component 1 explained 86.7% of the variation in the data, and principal component 2 explained 8.64% of the variation in the data. Density ellipses (P = 0.950) of the summer-annual (orange ellipse) and A. thaliana (purple ellipse) groups have been superimposed behind the score plot. Data for A. thaliana from Cohu et al. (2013a,b), Adams et al. (2016), and Stewart et al. (2017a,b), and data for summer annuals from Cohu et al. (2014); Muller et al. (2014b), and Polutchko et al. (2018)
Discussion
The findings of this study add to a body of literature (Adams et al., 2013a, 2014a, 2016; Cohu et al., 2013b, 2014; Muller et al., 2014a,b; Stewart et al., 2016, 2017a,b, 2018; Polutchko et al., 2018) demonstrating a strong relationship between photosynthetic capacity and several minor-vein parameters; these parameters include proxies for the capacity for sugar loading into foliar phloem and export out of the leaf as well as parameters associated with water import into the leaf and transpirational water loss relative to photosynthesis. The present findings provide further evidence of compensatory adjustments in minor-vein architecture that contribute to the adaptation and acclimation of photosynthetic capacity. Adjustments seen in Ei-5 apparently facilitate a level of sugar loading and export from the leaf mesophyll tissue equivalent to that of Col-0 with its higher foliar vein density. It is likely that maintenance of sugar-export capacity in Ei-5 despite its low vein density prevents sugar build-up in the leaves and thereby permits maintenance of photosynthetic capacity in Ei-5 (see Ainsworth and Bush, 2011; Adams et al., 2013a; Nikinmaa et al., 2013). The importance of a high sink strength comprised of the plant’s growing, reproductive, and/or storage tissues in keeping up the demand for photosynthate has been well documented (Körner, 2013; Fatichi et al., 2014). Avoiding limitations to photosynthetic performance by insufficient sugar export from leaves can be thought of as removing yet another “sink limitation.” Specifically, the present study demonstrates that a greater number of phloem cells per minor vein fully compensates for the genetic constraint of low vein density in the Ei-5 accession.
While the low-vein-density accession Ei-5 exhibited compensatory generation of greater numbers of phloem cells in each of its fewer foliar minor veins, the xylem tissue showed over-proportional adjustment in the number of xylem cells. This xylem adjustment in Ei-5 apparently provided for enhanced hydraulic capacity, thus supporting a significantly higher rate of transpiration compared to Col-0, which is a novel and somewhat unexpected combination of features in view of the findings from previous studies. In all previously documented cases of leaves with a greater number of tracheary elements per minor vein and higher ratios of tracheary to sieve elements, such leaves also had greater vein densities (Adams et al., 2016; Stewart et al., 2016, 2017a, 2018). It is unknown whether the combination of reduced foliar vein density and enhanced foliar water-flux capacity of Ei-5 compared to Col-0 is maladaptive or has any ecological significance. One may speculate that the geographic Ei-5 location, with its relatively high precipitation level (Figures 1E,F), may offer more support to the low-vein density phenotype of Ei-5 than a location with lower precipitation levels. Comparison of vein density among several A. thaliana ecotypes from locations with different precipitation levels revealed that the ecotype from the driest location had the highest vein density (Adams et al., 2016). In support of the possibility that the relatively high and consistent precipitation experienced by Ei-5 in its native habitat permits persistence of this phenotype, the Ba-1 accession, noted by Candela et al. (1999) as the only other A. thaliana accession in their survey with an exceptionally low vein density (see also Pérez-Pérez et al., 2009), originates from a site near Blackmount, United Kingdom (56.5°N, 4.8°W) that receives 1824 mm in annual precipitation – more than threefold greater than the site from which Col-0 originates.
Another possible explanation for its the unusual vascular composition is that Ei-5 may compensate for limitations in water flux that could be inherent to having only very few, large veins by preferential augmentation of minor-vein xylem tissue (see Sack and Scoffoni, 2013). A greater number of xylem cells per minor vein of Ei-5 presumably not only increases water-flux capacity through tracheary element conduits but also provides a greater surface area at the interface between xylem and adjacent mesophyll tissues for enhanced water distribution across the lamina compared to the scenario with fewer xylem cells per vein in the Col-0 accession (for discussions of these issues among species with different vein densities, see Prado and Maurel, 2013; Buckley et al., 2015).
Photosynthetic capacity per leaf area was similar in Ei-5 and Col-0 despite a significantly lower vein density, altered minor vein architecture, and significantly reduced shoot growth in Ei-5. These reduced growth rates of Ei-5, and its smaller rosettes compared to Col-0, are curious given the ability of Ei-5 to maintain similar photosynthetic capacities per leaf area. This finding suggests that there may be a link between reduced rosette development and the auxin-signaling-related hve-1 allele that gives rise to the low-vein-density phenotype in Ei-5 (Alonso-Peral et al., 2006). Coordination of venation and leaf growth via genetic control was also suggested to explain reduced vein densities and leaf sizes of hve mutants in the Col-0 background (Pérez-Pérez et al., 2011; see also Dengler and Kang, 2001). Another explanation for reduced growth in Ei-5 compared to Col-0 is a possible impact of low vein density on the growth-driving water potential of the mesophyll cells furthest from the nearest minor vein (see discussion in Buckley et al., 2015). Such genetic and biophysical effects may also offer an explanation for relatively high growth rates of many summer annual crops with relatively high vein densities compared to A. thaliana despite similar photosynthetic capacities and sugar-exporting tissues per leaf area (see Demmig-Adams et al., 2014; Polutchko et al., 2018).
Author Contributions
WA and BD-A designed the experiments. JS and SP carried out the experiments and collected the data. JS analyzed the data, assembled the climatological data, executed the statistical analyses, and rendered the figures. WA, JS, and BD-A wrote the manuscript.
Conflict of Interest Statement
The authors declare that the research was conducted in the absence of any commercial or financial relationships that could be construed as a potential conflict of interest.
Acknowledgments
We thank Dr. Christopher M. Cohu for assistance with data collection, the reviewers EP, LF, AF, and RE for their feedback that improved the clarity and quality of this paper, and the editor MT for his efforts on our behalf.
Funding. This work was supported by the National Science Foundation (Award Number DEB-1022236 to BD-A and WA) and the University of Colorado at Boulder. Publication of this article was funded by the University of Colorado Boulder Libraries Open Access Fund.
References
- Adams W. W., III, Cohu C. M., Amiard V., Demmig-Adams B. (2014a). Associations between phloem-cell wall ingrowths in minor veins and maximal photosynthesis rate. Front. Plant Sci. 5:24. 10.3389/fpls.2014.00024 [DOI] [PMC free article] [PubMed] [Google Scholar]
- Adams W. W., III, Cohu C. M., Muller O., Demmig-Adams B. (2013a). Foliar phloem infrastructure in support of photosynthesis. Front. Plant Sci. 4:194. 10.3389/fpls.2013.00194 [DOI] [PMC free article] [PubMed] [Google Scholar]
- Adams W. W., III, Demmig-Adams B., Rosenstiel T. N., Brightwell A. K., Ebbert V. (2002). Photosynthesis and photoprotection in overwintering plants. Plant Biol. 4 545–557. 10.1055/s-2002-35434 [DOI] [Google Scholar]
- Adams W. W., III, Muller O., Cohu C. M., Demmig-Adams B. (2014b). “Photosystem II efficiency and non-photochemical quenching in the context of source-sink balance,” in Non-Photochemical Quenching and Energy Dissipation in Plants, Algae and Cyanobacteria. Advances in Photosynthesis and Respiration Vol. 40 eds Demmig-Adams B., Garab G., Adams W., III, Govindjee (Dordrecht: Springer; ), 503–529. [Google Scholar]
- Adams W. W., III, Muller O., Cohu C. M., Demmig-Adams B. (2013b). May photoinhibition be a consequence, rather than a cause, of limited plant productivity? Photosynth. Res. 117 31–44. 10.1007/s11120-013-9849-7 [DOI] [PubMed] [Google Scholar]
- Adams W. W., III, Stewart J. J., Cohu C. M., Muller O., Demmig-Adams B. (2016). Habitat temperature and precipitation of Arabidopsis thaliana ecotypes determine the response of foliar vasculature, photosynthesis, and transpiration to growth temperature. Front. Plant Sci. 7:1026. 10.3389/fpls.2016.01026 [DOI] [PMC free article] [PubMed] [Google Scholar]
- Adams W. W., III, Watson A. M., Mueh K. E., Amiard V., Turgeon R., Ebbert V., et al. (2007). Photosynthetic acclimation in the context of structural constraints to carbon export from leaves. Photosynth. Res. 94 455–466. 10.1007/s11120-006-9123-3 [DOI] [PubMed] [Google Scholar]
- Ågren J., Schemske D. W. (2012). Reciprocal transplants demonstrate strong adaptive differentiation of the model organism Arabidopsis thaliana in its native range. New Phytol. 194 1112–1122. 10.1111/j.1469-8137.2012.04112.x [DOI] [PubMed] [Google Scholar]
- Ainsworth E. A., Bush D. R. (2011). Carbohydrate export from the leaf: a highly regulated process to enhance photosynthesis and productivity. Plant Physiol. 155 64–69. 10.1104/pp.110.167684 [DOI] [PMC free article] [PubMed] [Google Scholar]
- Alonso-Peral M. M., Candela H., del Pozo J. C., Martínez-Laborda A., Ponce M. R., Micol J. L. (2006). The HVE/CAND1 gene is required for the early patterning of leaf venation in Arabidopsis. Development 133 3755–3766. 10.1242/dev.02554 [DOI] [PubMed] [Google Scholar]
- Amiard V., Demmig-Adams B., Mueh K. E., Turgeon R., Combs A. F., Adams W. W., III (2007). Role of light and jasmonic acid signaling in regulating foliar phloem cell wall ingrowth development. New Phytol. 173 722–731. 10.1111/j.1469-8137.2006.01954.x [DOI] [PubMed] [Google Scholar]
- Amiard V., Mueh K. E., Demmig-Adams B., Ebbert V., Turgeon R., Adams W. W., III. (2005). Anatomical and photosynthetic acclimation to the light environment in species with differing mechanisms of phloem loading. Proc. Natl. Acad. Sci. U.S.A. 102 12968–12973. 10.1073/pnas.0503784102 [DOI] [PMC free article] [PubMed] [Google Scholar]
- Brodribb T. J., Feild T. S., Jordan G. J. (2007). Leaf maximum photosynthetic rate and venation are linked by hydraulics. Plant Physiol. 144 1890–1898. 10.1104/pp.107.101352 [DOI] [PMC free article] [PubMed] [Google Scholar]
- Buckley T. N., John G. P., Scoffoni C., Sack L. (2015). How does leaf anatomy influence water transport outside the xylem? Plant Physiol. 168 1616–1635. 10.1104/pp.15.00731 [DOI] [PMC free article] [PubMed] [Google Scholar]
- Candela H., Matínez-Laborda A., Micol J. L. (1999). Venation pattern formation in Arabidopsis thaliana vegetative leaves. Dev. Biol. 205 205–216. 10.1006/dbio.1998.9111 [DOI] [PubMed] [Google Scholar]
- Caringella M. A., Bongers F. J., Sack L. (2015). Leaf hydraulic conductance varies with vein anatomy across Arabidopsis thaliana wild-type and leaf vein mutants. Plant Cell Environ. 38 2735–2746. 10.1111/pce.12584 [DOI] [PubMed] [Google Scholar]
- Cheng Y., Dai X., Zhao Y. (2004). AtCAND1, a HEAT-repeat protein that participates in auxin signaling in Arabidopsis. Plant Physiol. 135 1020–1026. 10.1104/pp.104.044495 [DOI] [PMC free article] [PubMed] [Google Scholar]
- Cohu C. M., Muller O., Adams W. W., III, Demmig-Adams B. (2014). Leaf anatomical and photosynthetic acclimation to cool temperature and high light in two winter versus two summer annuals. Physiol. Plant. 152 164–173. 10.1111/ppl.121154 [DOI] [PubMed] [Google Scholar]
- Cohu C. M., Muller O., Demmig-Adams B., Adams W. W., III. (2013a). Minor loading vein acclimation for three Arabidopsis thaliana ecotypes in response to growth under different temperature and light regimes. Front. Plant Sci. 4:240. 10.3389/fpls.2013.00240 [DOI] [PMC free article] [PubMed] [Google Scholar]
- Cohu C. M., Muller O., Stewart J. J., Demmig-Adams B., Adams W. W., III. (2013b). Association between minor loading vein architecture and light- and CO2-saturated photosynthetic oxygen evolution among Arabidopsis thaliana ecotypes from different latitudes. Front. Plant Sci. 4:264. 10.3389/fpls.2013.00264 [DOI] [PMC free article] [PubMed] [Google Scholar]
- Delieu T., Walker D. A. (1981). Polarographic measurement of photosynthetic oxygen evolution by leaf discs. New Phytol. 89 165–178. 10.1111/j.1469-8137.1981.tb07480 [DOI] [Google Scholar]
- Demmig-Adams B., Stewart J. J., Adams W. W., III. (2014). Multiple feedbacks between chloroplast and whole plant in the context of plant adaptation and acclimation to the environment. Philos. Trans. R. Soc. Lond. B Biol. Sci. 369:20130244. 10.1098/rstb.2013.0244 [DOI] [PMC free article] [PubMed] [Google Scholar]
- Dengler N., Kang J. (2001). Vascular patterning and leaf shape. Curr. Opin. Plant Biol. 4 50–56. 10.1105/tpc.9.7.1121 [DOI] [PubMed] [Google Scholar]
- Dumlao M. R., Darehshouri A., Cohu C. M., Muller O., Mathias J., Adams W. W., III, et al. (2012). Low temperature acclimation of photosynthetic capacity and leaf morphology in the context of phloem loading type. Photosynth. Res. 113 181–189. 10.1007/s11120-012-9762-5 [DOI] [PubMed] [Google Scholar]
- El-Lithy M. E., Clerkx E. J. M., Ruys G. J., Koorneef M., Vreugdenhil D. (2004). Quantitative trait locus analysis of growth-related traits in a new Arabidopsis recombinant inbred population. Plant Physiol. 135 444–458. 10.1104/pp.103.036822 [DOI] [PMC free article] [PubMed] [Google Scholar]
- Fatichi S., Leuzinger S., Körner C. (2014). Moving beyond photosynthesis: from carbon source to sink-driven vegetation modeling. New Phytol. 201 1086–1095. 10.1111/nph.12614 [DOI] [PubMed] [Google Scholar]
- Feldman A. B., Leung H., Baraoidan M., Elmido-Mabilangan A., Canicosa I., Quick W. P., et al. (2017). Increasing leaf vein density via mutagenesis in rice results in an enhanced rate of photosynthesis, smaller cell sizes and can reduce interveinal mesophyll cell number. Front. Plant Sci. 8:1883. 10.3389/fpls.2017.01883 [DOI] [PMC free article] [PubMed] [Google Scholar]
- Hijmans R. J., Cameron S. E., Parra J. L., Jones P. G., Jarvis A. (2005). Very high resolution interpolated climate surfaces for global land areas. Int. J. Climatol. 25 1965–1978. 10.1002/joc.1276 [DOI] [Google Scholar]
- Hijmans R. J., Guarino L., Mathur P. (2012). DIVA-GIS. Version 7.5 A Geographic Information System for the Analysis of Species Distribution Data. Available at: www.diva-gis.org [Google Scholar]
- Hölttä T., Lintunen A., Chan T., Mäkelä A., Nikinmaa E. (2017). A steady-state stomatal model of balanced leaf gas exchange, hydraulics and maximal source-sink flux. Tree Physiol. 37 851–868. 10.1093/treephys/tpx011 [DOI] [PubMed] [Google Scholar]
- Kasai M. (2008). Regulation of leaf photosynthetic rate correlating with leaf carbohydrate status and activation state of Rubisco under a variety of photosynthetic source/sink balances. Physiol. Plant. 134 216–226. 10.1111/j.1399-3054.2008.01105.x [DOI] [PubMed] [Google Scholar]
- Koornneef M., Meinke D. (2010). The development of Arabidopsis as a model plant. Plant J. 61 909–921. 10.1111/j.1365-313X.2009.04086.x [DOI] [PubMed] [Google Scholar]
- Körner C. (2013). Growth controls photosynthesis – mostly. Nova Acta Leopoldina 114 273–283. [Google Scholar]
- Krapp A., Hofmann B., Schäfer C., Stitt M. (1993). Regulation of the expression of rbcS and other photosynthetic genes by carbohydrates: a mechanism for the ‘sink regulation’ of photosynthesis? Plant J. 3 817–828. 10.1111/j.1365-313X.1993.00817.x [DOI] [Google Scholar]
- Krapp A., Stitt M. (1995). An evaluation of direct and indirect mechanisms for the “sink-regulation” of photosynthesis in spinach: changes in gas exchange, carbohydrates, metabolites, enzyme activities and steady-state transcript levels after cold-girdling source leaves. Planta 195 313–323. 10.1007/BF00202587 [DOI] [Google Scholar]
- Muller O., Cohu C. M., Stewart J. J., Protheroe J. A., Demmig-Adams B., Adams W. W., III. (2014a). Association between photosynthesis and contrasting features of minor veins in leaves of summer annuals loading phloem via symplastic versus apoplastic routes. Physiol. Plant. 152 174–183. 10.1111/ppl.12155 [DOI] [PubMed] [Google Scholar]
- Muller O., Stewart J. J., Cohu C. M., Polutchko S. K., Demmig-Adams B., Adams W. W., III. (2014b). Leaf architectural, vascular, and photosynthetic acclimation to temperature in two biennials. Physiol. Plant. 152 763–772. 10.1111/ppl.12226 [DOI] [PubMed] [Google Scholar]
- Nikinmaa E., Hölttä T., Hari P., Kolari P., Mäkelä A., Sevanto S., et al. (2013). Assimilate transport in phloem set conditions for leaf gas exchange. Plant Cell Environ. 36 655–669. 10.1111/pce.12004 [DOI] [PubMed] [Google Scholar]
- Paine C. E. T., Marthews T. R., Vogt D. R., Purves D., Rees M., Hector A., et al. (2012). How to fit nonlinear plant growth models and calculate growth rates: an update for ecologists. Methods Ecol. Evol. 3 245–256. 10.1111/j.2041-210X.2011.00155.x [DOI] [Google Scholar]
- Pego J. V., Kortstee A. J., Huijser C., Smeekens S. C. M. (2000). Photosynthesis, sugars and the regulation of gene expression. J. Exp. Bot. 51 407–416. 10.1093/jexbot/51.suppl_1.407 [DOI] [PubMed] [Google Scholar]
- Pérez-Pérez J. M., Candela H., Robles P., Quesada V., Ponce M. R., Micol J. L. (2009). Lessons from a search of leaf mutants in Arabidopsis thaliana. Int. J. Dev. Biol. 53 1623–1634. 10.1387/ijdb.072534jp [DOI] [PubMed] [Google Scholar]
- Pérez-Pérez J. M., Rubio-Díaz S., Dhondt S., Hernández-Romero D., Sánchez-Soriano J., Beemster G. T., et al. (2011). Whole organ, venation and epidermal cell morphological variations are correlated in the leaves of Arabidopsis mutants. Plant Cell Environ. 34 2200–2211. 10.1111/j.1365-3040.2011.02415.x [DOI] [PubMed] [Google Scholar]
- Polutchko S. K., Stewart J. J., Demmig-Adams B., Adams W. W., III. (2018). Evaluating the link between photosynthetic capacity and leaf vascular organization with principal component analysis. Photosynthetica 56 392–403. 10.1007/s11099-017-0764-6 [DOI] [Google Scholar]
- Prado K., Maurel C. (2013). Regulation of leaf hydraulics: from molecular to whole plant levels. Front. Plant Sci. 4:255. 10.3389/fpls.2013.00255 [DOI] [PMC free article] [PubMed] [Google Scholar]
- Rédei G. P. (1992). “A heuristic glance at the past of Arabidopsis genetics,” in Methods in Arabidopsis Research, eds Koncz C., Chua N.-H., Schell (Singapore: World Scientific; ), 1–15. [Google Scholar]
- Sack L., Scoffoni C. (2013). Leaf venation: structure, function, development, evolution, ecology and applications in the past, present and future. New Phytol. 198 983–1000. 10.1111/nph.12253 [DOI] [PubMed] [Google Scholar]
- Sperry J. S., Venturas M. D., Anderegg W. R. L., Menuccini M., Mackay D. S., Love D. M. (2017). Predicting stomatal responses to the environment from the optimization of photosynthetic gain and hydraulic cost. Plant Cell Environ. 40 816–830. 10.1111/pce.12852 [DOI] [PubMed] [Google Scholar]
- Spurr A. R. (1969). A low-viscosity epoxy resin embedding medium for electron microscopy. J. Ultrastruct. Res. 26 31–43. [DOI] [PubMed] [Google Scholar]
- Stewart J. J., Adams W. W., III, Cohu C. M., Demmig-Adams B. (2018). Tocopherols modulate leaf vein arrangement and composition without impacting photosynthesis. Photosynthetica 56 384–391. 10.1007/s11099-017-0757-5 [DOI] [Google Scholar]
- Stewart J. J., Adams W. W., III, Cohu C. M., Polutchko S. K., Lombardi E. M., Demmig-Adams B. (2015). Differences in light-harvesting, acclimation to growth-light environment, and leaf structural development between Swedish and Italian ecotypes of Arabidopsis thaliana. Planta 242 1277–1290. 10.1007/s00425-015-2368-3 [DOI] [PubMed] [Google Scholar]
- Stewart J. J., Demmig-Adams B., Cohu C. M., Wenzl C. A., Muller O., Adams W. W., III. (2016). Growth temperature impact on leaf form and function in Arabidopsis thaliana ecotypes from northern and southern Europe. Plant Cell Environ. 39 1549–1558. 10.111/pce.12720 [DOI] [PubMed] [Google Scholar]
- Stewart J. J., Polutchko S. K., Adams W. W., III, Cohu C. M., Wenzl C. A., Demmig-Adams B. (2017a). Light, temperature, and tocopherol status influence foliar vascular anatomy and leaf function in Arabidopsis thaliana. Physiol. Plant. 160 98–110. 10.1111/ppl.12543 [DOI] [PubMed] [Google Scholar]
- Stewart J. J., Polutchko S. K., Adams W. W., III, Demmig-Adams B. (2017b). Acclimation of Swedish and Italian ecotypes of Arabidopsis thaliana to light intensity. Photosynth. Res. 134 215–229. 10.1007/s11120-017-0436-1 [DOI] [PubMed] [Google Scholar]
- Tessmer O. L., Jiao Y., Cruz J. A., Kramer D. M., Chen J. (2013). Functional approach to high-throughput plant growth analysis. BMC Syst. Biol. 7:S17. 10.1186/1752-0509-7-S6-S17 [DOI] [PMC free article] [PubMed] [Google Scholar]


