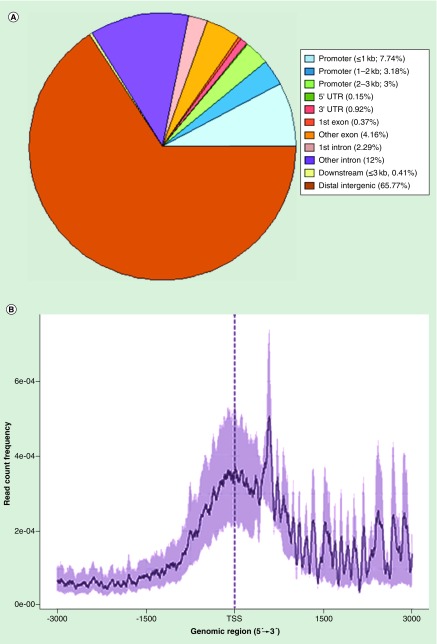
Figure 1. . Distribution of histone peak regions within the genome.
(A) Displays the data in pie chart format, indicating the percentage of peaks obtained from the chromatin immunoprecipitation sequencing experiment in different genomic regions. (B) When examining 2000 base pairs in either direction of aggregated TSS, acetylation peak intensity tends to cluster around the TSS and promoter region.
TSS: Transcription start site.

