

ABSTRACT
Steinert disease, or myotonic dystrophy type 1 (DM1), is a multisystemic disorder caused by toxic noncoding CUG repeat transcripts, leading to altered levels of two RNA binding factors, MBNL1 and CELF1. The contribution of CELF1 to DM1 phenotypes is controversial. Here, we show that the Drosophila CELF1 family member, Bru-3, contributes to pathogenic muscle defects observed in a Drosophila model of DM1. Bru-3 displays predominantly cytoplasmic expression in muscles and its muscle-specific overexpression causes a range of phenotypes also observed in the fly DM1 model, including affected motility, fiber splitting, reduced myofiber length and altered myoblast fusion. Interestingly, comparative genome-wide transcriptomic analyses revealed that Bru-3 negatively regulates levels of mRNAs encoding a set of sarcomere components, including Actn transcripts. Conversely, it acts as a positive regulator of Actn translation. As CELF1 displays predominantly cytoplasmic expression in differentiating C2C12 myotubes and binds to Actn mRNA, we hypothesize that it might exert analogous functions in vertebrate muscles. Altogether, we propose that cytoplasmic Bru-3 contributes to DM1 pathogenesis in a Drosophila model by regulating sarcomeric transcripts and protein levels.
KEY WORDS: Bruno-3, RNA CLIP, CELF1, Drosophila, mRNA stability, Myotonic dystrophy type 1
Summary: Our data suggest that, the so far ignored, cytoplasmic Bru-3/CELF1 contributes to myotonic dystrophy type 1 pathogenesis in a Drosophila model by regulating sarcomeric transcripts and protein levels.
INTRODUCTION
The finding that 75% of human disease-related genes have functional orthologs in the fruit fly (Rubin et al., 2000) drove the development of Drosophila models for inherited disorders, including neuromuscular diseases (Chartier et al., 2006; Shcherbata et al., 2007; Garcia-Lopez et al., 2008) such as myotonic dystrophy type 1 (DM1) (de Haro et al., 2006; Yu et al., 2011; Picchio et al., 2013). DM1, which affects 1/8000 people worldwide, is an autosomal dominant disease caused by an unstable expansion of CTG repeats in the 3′ untranslated region (3′UTR) of the DMPK gene on chromosome 19 (Brook et al., 1992; Fu et al., 1992). A peculiarity of DM1 is its multisystemic feature – patients display symptoms ranging from baldness and cataract to myotonia, muscle weakness/loss, heart block, sterility, digestive disorders and DM1 type 2 diabetes (Fardaei et al., 2002). Importantly, the severity of symptoms is positively correlated with the size of CTG expansion (Kroksmark et al., 2005), which can vary from 50 to several thousand triplet repeats in the most severe congenital form of DM1. It is well accepted that in muscle cells, mutated DMPK transcripts with large CUG expansion form secondary structures (Mooers et al., 2005) able to sequester the muscleblind-like 1 (MBNL1) splicing factor into foci within nuclei (Taneja et al., 1995; Davis et al., 1997). The important role of this factor for DM1 pathogenesis has already been demonstrated in transgenic mouse (Kanadia et al., 2006) and fly (de Haro et al., 2006; Picchio et al., 2013) models. Furthermore, by an as-yet undetermined mechanism, PKCα (PRKCA) is hyperactivated and stabilizes the splicing factor CELF1 (CUGBP, Elav-like family member 1, also known as CUGBP1) through hyperphosphorylation (Kuyumcu-Martinez et al., 2007). MBNL1 and CELF1 play antagonistic roles in regulating the alternative splicing of CLCN1 (Charlet-B et al., 2002; Kino et al., 2009), InR (Kino et al., 2009; Savkur et al., 2004) and cTNT (up) (Philips et al., 1998; Tran et al., 2011) transcripts. The reverse balance of MBNL1 and CELF1 in DM1 leads to the mis-splicing of these pre-mRNAs, collectively explaining myotonia, diabetes and reduced myocardial function manifested in patients. Some other transcripts, such as alpha-actinin (Actn1-4) (Suzuki et al., 2002), MYH14 (Rinaldi et al., 2012) or Tau (MAPT) (Dhaenens et al., 2011) have been shown to be specifically mis-spliced by CELF1 in DM1. In addition to its role in the regulation of alternative splicing (Philips et al., 1998; Ladd et al., 2001, 2005), CELF1 is also involved in regulating translation (Timchenko et al., 1999; Iakova et al., 2004), mRNA deadenylation and decay (Paillard et al., 2003; Vlasova and Bohjanen, 2008; Lee et al., 2010; Le Tonquèze et al., 2010; Rattenbacher et al., 2010), and RNA editing (Anant et al., 2001). A recent report revealed that CELF1 and MBNL1 antagonize not only to control pre-mRNA splicing, but also to control mRNA stability (Wang et al., 2015). Therefore, CELF1 accumulation in DM1 patients can lead to various alterations in transcript processing.
The role of CELF1 in the DM1-related heart and skeletal muscle disorders has been shown in short-lived mouse models overexpressing Celf1 (Timchenko et al., 2004; Wang et al., 2007). It has also been demonstrated that adult flight muscle degeneration in inducible Drosophila DM1 lines can be worsened by overexpressing human CELF1 (de Haro et al., 2006). However, the role of the Drosophila CELF1 counterpart and its impact on DM1-associated muscle phenotypes has not yet been investigated. Among the three Drosophila genes related to CELF1, i.e. arrest or bruno (aret/bru; bruno-1), bruno-2 (bru-2) and bruno-3 (bru-3) (Good et al., 2000; Delaunay et al., 2004), the protein encoded by the ubiquitously expressed bru-3 is the only one that carries both the RNA recognition motif (RRM) and the linker-specific motif (lsm) (Delaunay et al., 2004), both important for RNA-binding specificities. Bru-3 is also the only Bruno protein capable of binding the EDEN motif, a conserved translational repression element (Delaunay et al., 2004). Thus, we hypothesized that bru-3 represents a CELF1-like gene in Drosophila and tested whether it contributes to DM1 pathogenesis by analyzing the effects of muscle-targeted expression of Bru-3 in fly. We recently generated a set of inducible site-specific Drosophila DM1 lines expressing an increasing number of noncoding CUG repeats in larval somatic muscles (Picchio et al., 2013). Among them, the high repeat number DM1960 line that carries 960 interrupted CTG repeats displays particularly severe muscle phenotypes mirroring those observed in DM1 patients. Here, by comparing somatic muscle phenotypes in the DM1960 Drosophila line, a bru-3-overexpressing line and the DM1960 line combined with a hemizygous bru-3 deficiency, we show that the increased level of Bru-3 alters motility and is involved in reduced myofiber length and myoblast fusion. However, we also found that the muscle hypercontraction induced by the expression of the high number of CTG repeats is not Bru-3 dependent. Interestingly, genome-wide transcriptomic analysis performed on larvae with increased muscle levels of Bru-3 identified the downregulation of a large set of genes encoding sarcomere components. Among them, the sarcomeric transcripts encoded by Actn were found to be associated with cytoplasmic granules, some of which also colocalize with cytoplasmic Bru-3. As modulating Bru-3 has an opposite effect on Actn RNA versus Actn protein levels, we propose that cytoplasmic Bru-3 plays a dual role in DM1. First, increased Bru-3 promotes Actn transcript release from the granules and, second, it favors their subsequent in situ translation (close to the site of protein incorporation) and a quick post-translational decay (fast mRNA degradation after its translation).
Thus, our data suggest that Bru-3 not only negatively regulates amounts of stored sarcomeric transcripts but also acts as a positive regulator of their in situ translation.
RESULTS
The Drosophila CELF family member, Bru-3, is expressed in larval somatic muscles
Alignment of protein domains of human and Drosophila CELF family members (Fig. 1A) revealed that Bru-3 conserves both RRM and lsm domains (Delaunay et al., 2004). Alignment of the lsm domain of human CELF proteins and Drosophila Bruno proteins (Fig. S1) showed that only CELF1, CELF2 and Bru-3 lsm domains are well conserved (95-100%) compared with other CELF and Bruno proteins, for which conservation ranges from 62% to 14%. In addition, Aret/Bru which is known to be expressed in a subset of adult muscles (Oas et al., 2014; Spletter et al., 2015) is not expressed in Drosophila larval muscles as shown by immunostaining (Fig. S1B,C), making it unlikely that it is a functional CELF1 ortholog. Thus, among the Bru genes, bru-3 appears to be the closest Drosophila CELF1 homolog. To characterize the bru-3 expression pattern, we generated an antibody raised against the Bru-3 N-terminus end (Fig. 1A), a very specific portion of this protein. We found that Bru-3 protein is detected in larval body wall muscles and displays a cytoplasmic striated pattern (Fig. 1B,G) that frames the Z-line revealed by Actinin (Actn) immunostaining in red (Fig. 1G). Interestingly, other RNA-binding proteins, including the involved-in-DM1 splicing factor Muscleblind (Mbl) (Llamusi et al., 2013) and fragile X-related protein 1 (FXR1) (Khandjian et al., 1998; Mientjes et al., 2004; Whitman et al., 2011), are expressed in sarcomeres. A higher-magnification view (Fig. 1C) shows that cytoplasmic Bru-3 is also found in granules around nuclei. These granules can be observed around all nuclei. Finally, low levels of Bru-3 are found in the nuclei of muscle fibers (Fig. 1B,B′), reflecting its potential role as a splicing factor. These immunostaining data are also supported by western blot analysis results (Fig. S1E), revealing Bru-3 protein in both cytoplasmic and nuclear fractions. That the generated antibody specifically detects Bru-3 protein is supported by the lack of pre-immune serum staining (Fig. 1D-E), the reduced intensity of Bru-3 fluorescent signal in muscles dissected from bru-3 RNAi knockdown larvae (Mef>bru-3RNAi) (Fig. 1F,L,R) and by western blot detection of Bru-3 protein (Fig. S1E). Muscle-targeted overexpression of bru-3 leads to increased signal intensity in the cytoplasm (Fig. 1F,H,I; Fig. S1E) combined with a higher nuclear accumulation of Bru-3 (Fig. 1F,N,O). Among two bru-3-overexpressing lines, quantification of immunostaining revealed that UAS-bru-3(37) has a significantly higher nuclear level of Bru-3 than has UAS-bru-3(43) (Fig. 1F). When considering bru-3 transcript expression, in Mef>bru-3(37) context, they were highly upregulated but remained at control levels in DM1960 pathogenic context (Fig. S1D).
Fig. 1.

Bru-3 is expressed in larval somatic muscles and enriched in pathological lines. (A) CELF1 sequence aligned with Bruno orthologs. lsm, linker-specific motif; RRM, RNA recognition motif. The N-terminus peptide designed to raise the antibody specifically against Bru-3 is highlighted in red. (B-E) Bru-3 expression in WT larval muscle. Immunostaining against Bru-3 (gray) shows that Bru-3 is expressed in larval somatic muscles more specifically in the sarcomeres (B,B′) as well as in granules around the nuclei, as indicated by white arrows (C). This antibody also detected weak Bru-3 expression in nuclei (B′). (D-E) Immunostaining of larval muscles with pre-immune serum shows the specificity of the antibody raised against Bru-3. (F) Densitometric measurements of Bru-3 in the nucleus and cytoplasm of different genotypes. Cytoplasmic signal measurement was performed using ImageJ as described previously by McCloy et al. (2014). DAPI was used as reporter of tissue accessibility for the staining, because sarcomeric markers expression is potentially altered in pathological contexts (see Fig. 4). *P<0.05, **P<0.01, ***P<0.001 versus WT. (G-L) Bru-3 expression in segment border muscle (SBM) of third-instar larvae. Sarcomeric immunostained Bru-3 (gray) frames the Z-line represented by Actn immunostaining (red) in WT muscle (G). Bru-3 immunostaining is also shown in Mef>bru-3(43) (H), Mef>bru-3(37) (I), Mef>960CTG (J), Mef>960CTG,Df(bru-3) (K) and Mef>bru-3RNAi (L) conditions. (M-R) Representative pictures of nuclear Bru-3 expression compared with corresponding DAPI staining (M′-R′) in third-instar larval muscle. Bru-3 immunostaining is shown in WT (M), Mef>bru-3(43) (N), Mef>bru-3(37) (O), Mef>960CTG (P), Mef>960CTG,Df(bru-3) (Q) and Mef>bru-3RNAi (R). Scale bars: 20 µM.
As CELF1 is increased in DM1 cardiac and skeletal muscles of both patients and mice (Savkur et al., 2001; Wang et al., 2007; Orengo et al., 2008), we assessed Bru-3 expression in larval muscles of pathological Drosophila lines. We observed that Bru-3 expression pattern in muscles of DM1960 larvae [a high-repeat-number line that carries 960 interrupted CTG repeats (Picchio et al., 2013)] is similar to the wild-type (WT) pattern (Fig. 1G,J). However, we recorded a significantly increased intensity of the fluorescent signal detected by anti-Bru-3 antibody in the cytoplasm (Fig. 1F,J) and the nuclei (Fig. 1F,P). We also found that Bru-3 signal intensity is rescued in DM1960 muscles with hemizygous bru-3 deficiency (Fig. 1F,K,Q; Fig. S1E, Table S1). Hence, the DM1960 line not only mimics the muscle phenotype of DM1 patients (Picchio et al., 2013) but also increased the protein levels of its CELF1 counterpart. Thus, our DM1 and bru-3-overexpressing lines appear suitable for comparative studies and assessing CELF1/bru-3-dependent pathological phenotypes in DM1.
Increased Bru-3 levels contribute to impaired motility and muscle morphology defects in DM1, but not to muscle hypercontraction
To assess the functionality of muscles with increased Bru-3 levels, we performed a righting assay by putting a larva on its back and recording the time it takes to revert to ventral position. We observed that all control lines needed ∼5 s to complete this exercise, whereas Mef>bru-3(37), Mef>bru-3(43) and DM1960 lines needed 12, 14 and 17 s, respectively (Fig. 2A). The hemizygous bru-3 deficiency, which reduces Bru-3 levels (Fig. 1K), completely restores the motility of the DM1960 line (Fig. 2A). To test whether muscle defects are at the origin of impaired larva motility, we scored morphological abnormalities in the body-wall musculature of third-instar larvae. The main defects identified were splitting fibers and extra fibers (Fig. 2B,B′), with extra fibers already defined as a consequence of extreme muscle fiber splitting (Picchio et al., 2013). The total number of defects observed (including splitting, extra fibers and missing fibers) was significantly increased in the pathological lines compared with the Mef>lacZ control line (Fig. 2C). Note that the number of defects was higher in the strongest bru-3-overexpressing line, Mef>bru-3(37), than in the Mef>bru-3(43) line, despite an absence of difference of righting between those two lines. Thus, the former line was used for subsequent experiments. We also noted a significantly reduced number of splitting fibers and overall defects in the DM1960,Df(bru-3) rescue line compared with the DM1960 line (Fig. 2C), suggesting that Bru-3 accumulation in DM1 induces the splitting fiber phenotype. Taken together, these data indicate an important contribution of Bru-3 to the altered muscle performance and morphological muscle defects observed in our Drosophila DM1 model.
Fig. 2.
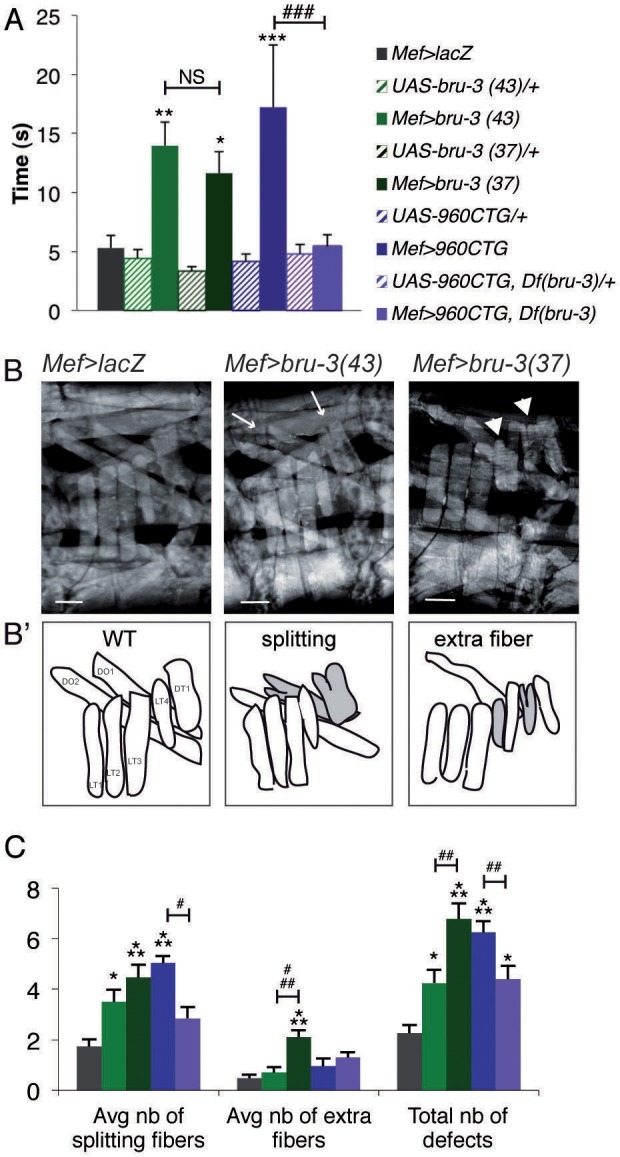
Bru-3 overexpression alters motility and contributes to fiber splitting. (A) Righting assay. The graph represents the average recorded time taken for the larvae of each genotype to turn over. (B-C) Assessment of overall muscle pattern and quantification of muscle abnormalities. Z-stacks of in vivo scans of muscle pattern in a single third-instar larvae abdominal segment (between A5 and A7) (B). Arrows point to splitting fibers and arrowheads to extra fibers, both represented by schemes in B′. Muscles taken into account for quantification are represented and named in WT context (B′): LT1, LT2, LT3 and LT4 refer to lateral transverse muscles; DT1, dorso transverse 1; DO1 and DO2, dorso oblique muscles. Graphs show the average number of each defect observed in vivo for each mutant line on a window of three abdominal segments (C). Color coding is as in A. *P<0.05, **P<0.01, ***P<0.001 versus Mef>lacZ. NS, not significant. #P<0.05, ##P<0.01, ###P<0.001 Mef>960CTG versus Mef>960CTG,Df(bru-3) or Mef>bru-3(37) versus Mef>bru-3(43). Scale bars: 70 µM.
It is well known that in cell culture, the fusion ability of DM1 satellites cells (Furling et al., 2001; Thornell et al., 2009) and expanded CUG repeat tract-expressing C2C12 myoblasts is altered (Furling et al., 2001; Amack and Mahadevan, 2001) and impacts on myotube size. As previously observed (Picchio et al., 2013), the larval ventrolateral (VL3) fibers were shorter and displayed a significantly reduced number of nuclei in DM1 lines (Mef>960CTG, Fig. 3A,B). The same was true in the Mef>bru-3(37) line (Fig. 3A,B). Importantly, fiber length and number of nuclei were partially restored in DM1960,Df(bru-3) larvae (Fig. 3A,B), indicating that bru-3 overexpression contributes to muscle fusion phenotypes observed in DM1 lines. One can note that nuclei are normally distributed along the fiber in bru-3 overexpression context (Fig. 3C). Fig. 3D shows that the number of sarcomeres along muscle fibers remains unchanged in pathological lines compared with controls, meaning that fiber growth defects cannot account for reduced fiber size, as can reduced number of nuclei. Thus, both the expression of CUG repeats and bru-3 overexpression affect muscle fibers length resulting from reduced number of myoblast fusion events.
Fig. 3.

bru-3 overexpression affects myoblast fusion process, but not contractility, in vivo. (A) The average length of abdominal VL3 fibers is significantly reduced in Mef>bru-3(37) and Mef>bru-3(43) lines, and in Mef>960CTG and Mef>960CTG,Df(bru-3) lines, compared with controls (Mef>lacZ and corresponding transgenic control line). (B,C) Myoblast fusion defect in DM1 condition is Bru-3 dependent. The average number of nuclei per abdominal VL3 fiber is significantly reduced in Mef>bru-3 and Mef>960CTG lines, but is rescued in Mef>960CTG,Df(bru-3) condition (B). Number of nuclei is used as an indicator of the number of fusion events during myogenesis. Fusion is therefore affected in the DM1 line in a Bru-3-dependent manner. Images of abdominal VL3 fibers representative of an altered condition [Mef>bru-3(37)] and control condition [UAS-bru-3(37)/+] (C). Nuclei were stained with anti-Lamin antibody (green). Actin was stained with phalloidin (gray). (D) Larval muscle growth was not affected in pathological contexts. The average number of sarcomeres along the VL3 fiber is represented for each genotype and represents an index of fiber growth. (E,F) Sarcomere shortening in DM1 condition is not Bru-3 dependent. Z-band profiles along VL3 fibers were assessed with phalloidin staining along a 100-µM length (E). The distance measured between two peaks gives sarcomere size. Thus, more peaks present on the profiles equates to more contracted muscle. *P<0.05, **P<0.01 versus both Mef>lacZ and respective transgenic control line. Sarcomere size, which reflects the state of contraction or relaxation of VL3 muscle, is presented on the graph for each mutant line (F). A significant reduction in the length of a sarcomere is an index of muscle hypercontraction. ***P<0.001.
As previously described (Picchio et al., 2013), systematic quantification of sarcomere size following Z-line staining with phalloidin in several larvae revealed muscle hypercontraction in the Mef>960CTG line (Fig. 3E,F). In contrast, the sarcomere size was not significantly affected in the bru-3 overexpression line compared with the Mef>lacZ control line (Fig. 3E,F). This result suggests that bru-3 overexpression does not affect muscle relaxation. In line with this observation, sarcomere size is still reduced in the DM1960,Df(bru-3) line, as it is in the DM1960 line, which indicates that Bru-3 is not involved in the hypercontracted muscle phenotype in the Drosophila model of DM1, much like its vertebrate counterpart, CELF1 (Ward et al., 2010).
mRNA profiling of bru-3-overexpressing and DM1 lines reveals bru-3-dependent deregulation of genes encoding sarcomeric components
The above data show that bru-3 overexpression contributes to impaired motility and muscular defects in the DM1 line. We carried out a transcriptomic analysis to obtain a more global picture of how far Bru-3 contributes to CTG repeat-induced gene deregulations. By profiling gene expression in the strongest bru-3-overexpressing line, Mef>bru-3(37), we identified 396 upregulated and 451 downregulated genes (Table S2). We compared this repertoire of genes with the microarray data from our previous work [Mef>mblRNAi, Mef>600CTG and Mef>960CTG (Picchio et al., 2013)]. Comparison of the data sets was facilitated by the fact that we used the same microarray platform and the same controls. As shown in the Venn diagrams in Fig. 4A, 32% of the genes downregulated in DM1 are common to the bru-3 overexpression condition, compared with 82% for mbl attenuation. For the upregulated genes, Mef>bru-3 represents 53% of the deregulations against 70% for Mef>mblRNAi (Fig. S2A). Hence, the extent of gene deregulation indicates that the bru-3-dependent transcriptomic alterations in DM1 lines are less pronounced than mbl-dependent alterations. Interestingly, 8% of the genes downregulated, and 9% of the genes upregulated, in the DM1 line are dependent on bru-3 overexpression but not on mbl attenuation (Fig. 4A; Fig. S2A). Thus, the global gene deregulation in bru-3 overexpression illustrates its partial contribution to DM1 phenotypes.
Fig. 4.

Global gene expression analysis of bru-3 overexpression suggests a cytoplasmic function for Bru-3 in regulating sarcomeric transcript stability. (A) Venn diagrams of genes downregulated in Mef>bru-3(37) condition versus Mef>mblRNAi and DM1 (Mef>960CTG∩Mef>600CTG) lines show that ∼80% of transcriptomic alterations caused by Bru-3 overexpression are common to DM1 and/or mbl-attenuated lines. The diagram was generated from a list of transcripts that are >1.5-fold enriched or depleted relative to the Mef>lacZ reference. (B) Volcano plot summarizing microarray data for the Mef>bru-3(37) line versus Mef>lacZ. The horizontal axis plots the fold change on a log2 scale. The vertical axis plots the P-value on a −log10 scale. Gray dots indicate probes below the threshold. Green dots indicate probes with significantly altered expression. Black dots indicate downregulated sarcomere component probes. (C) Expression of transcripts encoding sarcomeric proteins is Bru-3 dependent. RT-qPCR on a set of mRNAs encoding sarcomeric proteins in normal condition (Mef>lacZ), pathological contexts [Mef>960CTG, Mef>bru-3(37)] and rescue condition [Mef>960CTG,Df(bru-3)]. *P<0.05, **P<0.01 versus Mef>lacZ or versus Mef>960CTG where indicated by a colored bar. #P<0.05, ##P<0.01 indicate significant differences in data distribution between genotypes (Kruskal–Wallis test). (D) Sarcomeric transcript Mlc1 (red) colocalizes with Bru-3 (green) in cytoplasmic granules surrounding the DAPI-stained nuclei (blue) in WT condition. Scale bar: 20 µM. (E) qPCR of nascent Mlc-1 and mature Mlc1 transcripts indicates that despite a reduced level of mature transcripts, transcription is at the same rate between control (Mef>lacZ) and bru-3-overexpressing lines. *P<0.05 versus Mef>lacZ. (F) Sarcomeric Actn transcripts (red), similar to Mlc1 transcripts (D), colocalize with Bru-3 (green) in cytoplasmic granules. DAPI-stained nuclei are in blue. Scale bar: 60 µm.
A gene ontology (GO) classification of the genes downregulated (Fig. S2B) and upregulated (Fig. S2C) in muscle-targeted bru-3 overexpression showed that genes implicated in redox processes and genes encoding sarcomeric proteins were mainly downregulated. As deregulation of sarcomere components might weaken muscle structure and lead to splitting of muscle fibers, a phenotype observed in both DM1 patients and our DM1 Drosophila model, we focused on this category of genes (Fig. S2B, Table 1). As charted on the volcano plot (Fig. 4B), we found that the increased level of Bru-3 leads to downregulation of 11 genes encoding sarcomeric proteins including α-Actinin (Actn), Myosin heavy and light chains (Mhc, Mlc1 and Mlc2), Tropomyosin 1 and 2 (Tm1 and Tm2), Troponin I (wupA) and C47D (TpnC47D), bent, Paramyosin (Prm), Zasp52 and Unc-89.
Table 1.
Orthology between Drosophila and human sarcomeric genes
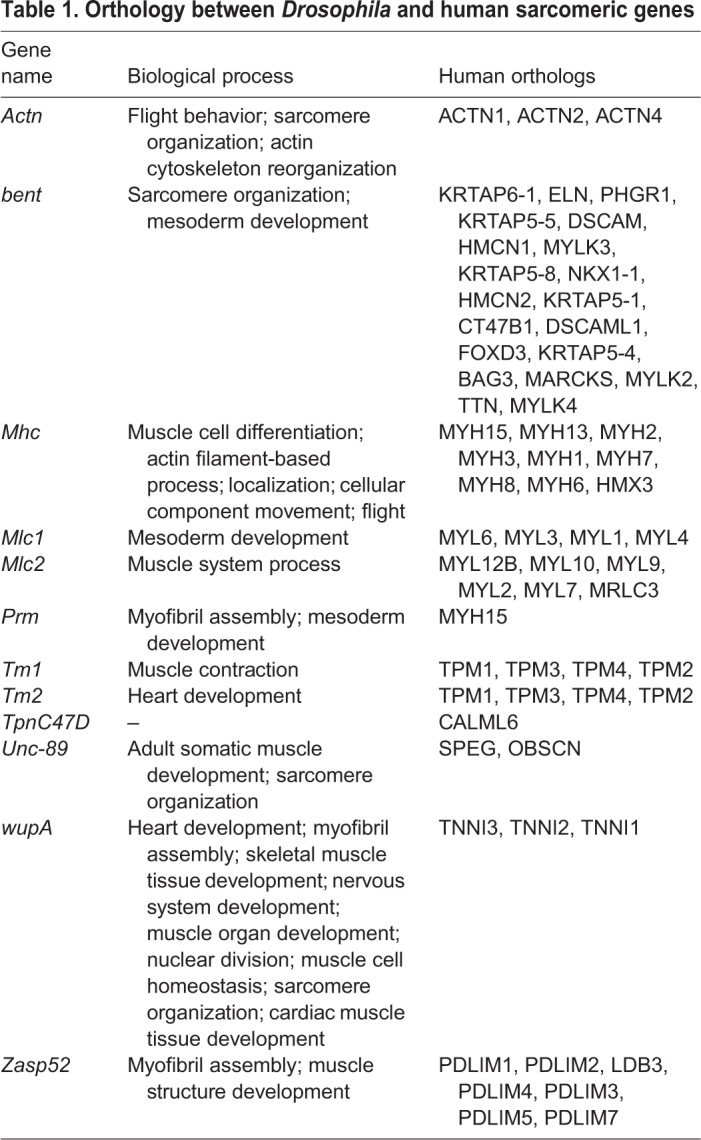
This finding raised the possibility that Bru-3 is directly involved in the observed DM1-induced repression of sarcomeric genes. To investigate this possibility, we first used reverse transcription (RT)- quantitative polymerase chain reaction (qPCR) to test whether the identified sarcomeric transcripts are indeed downregulated. In bru-3 overexpression, all candidates except bent showed significantly decreased expression (Fig. 4C), thus validating the global gene expression data. We also confirmed that expression of Actn, Mhc, Mlc1, Mlc2, Tm1, TpnC47D, Unc-89 and wupA (eight of the 11 transcripts downregulated in microarrays) was significantly decreased in DM1. Finally, we demonstrated that decreasing Bru-3 in DM1 context by combining the DM1 line with bru-3 deficiency partially or totally rescued sarcomeric transcript levels, providing evidence for bru-3-dependent downregulation of sarcomeric genes in the Drosophila DM1 model. Interestingly, crosslinking immunoprecipitation (CLIP) followed by sequencing (CLIP-seq) experiments performed on mouse muscle tissues by Wang et al. (2015) also identified sarcomeric genes as direct targets of CELF1. Among them, orthologs of bent (Eln, Bag3, Mylk2, Ttn), Mhc (Myh1), Mlc1 (Myl1, Myl3), Tm1 and Tm2 (Tpm2), Unc-89 (Speg) and Zasp52 (Ldb3, Pdlim3, Pdlim5, Pdlim7) sorted out.
The observed lower levels of sarcomeric mRNAs in bru-3 overexpression suggested that bru-3 overexpression could affect sarcomeric mRNAs transcription or stability. We favor the idea that Bru-3 controls sarcomeric mRNA stability for several reasons. First, mammalian CELF1 has been shown to bind 3′UTRs of target transcripts and regulate their stability (Paillard et al., 2003; Vlasova and Bohjanen, 2008; Wang et al., 2015; Masuda et al., 2012), and this function might be conserved in Drosophila. Second, fluorescent in situ hybridization (FISH) of Mlc1 followed by Bru-3 immunostaining (Fig. 4D) showed that Mlc1 mRNA colocalizes with Bru-3 in WT larval muscles in granular cytoplasmic structures, consistent with an interaction between Mlc1 mRNA and Bru-3. Last, but not least, we found that the nascent Mlc1 transcripts quantified using intron-specific RT-qPCR are present at the same level in bru-3-overexpressing and WT larval muscles, despite a reduced level of mature Mlc1 RNA in the first condition (Fig. 4E). Hence, Bru-3 does not interfere with Mlc1 transcription. Taken together, these data suggest that Bru-3 controls the abundance of Mlc1 and potentially other sarcomeric transcripts by a post-transcriptional mechanism.
We next explored the nature of granular structures in which Mlc1 RNA and Bru-3 colocalize. As CELF1 has been shown to recruit occludin mRNA or E-cadherin mRNA to P-bodies (Yu et al., 2013, 2016), we hypothesized that they correspond to P-bodies. Indeed, Bru-3 partially colocalizes with Me31B and FMRP, two P-body markers (Fig. S2D,E). As P-bodies are associated with mRNA storage, distribution and decay, we suggest that Bru-3 controls sarcomeric mRNA stability in a P-body-dependent manner.
Conservation of CELF1 interaction with sarcomeric transcripts in C2C12 myotubes
To assess whether the observed cytoplasmic expression and function of Bru-3 is conserved in vertebrate muscle cells, we tested CELF1 expression in C2C12 myoblasts and differentiated myotubes. In C2C12 myoblasts, CELF1 is mainly present in nuclei (Fig. 5A). However, after 10 days of differentiation, CELF1 is essentially excluded from the nuclei and relocalized, predominantly in the cytoplasm of myotubes (Fig. 5A). This suggests that, like in Drosophila, it exerts mainly cytoplasmic functions in differentiated muscle cells. To test this hypothesis, we performed an RNA CLIP experiment on C2C12 myotubes using anti-CELF1 antibody and RT-qPCR to individually test orthologs (Table 1) of 12 sarcomeric candidates sorted with the Drosophila model. Among them, we found that Pdlim5 (Zasp52), Tpm2 (Tm1 and Tm2) and Actn1 (Actn) transcripts are significantly enriched in CLIP complexes (Fig. 5B; Fig. S3) suggesting that these mRNAs physically interact with CELF1. Interestingly, in silico exploration revealed an enrichment of CELF1-dependent destabilizing sites (Lee et al., 2010) in the 3′UTR of these transcripts, as observed in the positive control used for the CLIP (Jun; Jra) and contrary to the 3′UTR of the negative control (Gapdh) (Fig. 5C; Table S3). Consequently, we argue a cytoplasmic role for Bru-3/CELF1 in the post-transcriptional regulation of sarcomeric transcripts in both flies and mammals.
Fig. 5.

The Bru-3 ortholog, CELF1, is relocalized in the cytoplasm of C2C12 myotubes and binds mRNA transcripts orthologous to Bru-3 targets. (A) Immunostaining against CELF1 (using 3B1 antibody) in undifferentiated C2C12 myoblasts and C2C12 myotubes after 10 days of differentiation. CELF1 signal (red) is essentially nuclear in myoblasts and accumulates in the cytoplasm upon differentiation. Nuclei are DAPI counterstained (blue). Scale bars: 20 µM. (B) Sarcomeric transcripts physically bound to CELF1 in myotubes. Strip charts show the enrichments of cross-linked mRNAs in immunopurified complexes (CLIP experiments). Enrichments on anti-CELF1 beads (gray boxes) are compared with those on IgG beads (white boxes). Student’s t-test P-values are shown above each lane of the graph. Jun mRNA (a known CELF1 target) was used as a positive control; Gapdh was used as a negative control. (C) 3′UTR of significantly-enriched sarcomeric transcripts in CLIP experiments. Destabilizing sites (Lee et al., 2010) (Table S3) are represented in red and random sites in white. Jun was used as a positive control; Gapdh was used as a negative control. *P<0.05, **P<0.01.
Actn, an example of Bru-3-dependent regulation of sarcomere components in normal and pathological conditions
To further analyze the consequences of sarcomeric transcript deregulation and establish a link between Bru-3 function and DM1, we focused on Actn, a conserved sarcomeric target of Bru-3/CELF1. Similar to Mlc1 mRNA, Actn mRNA revealed by a standard in situ hybridization protocol was detected in granular cytoplasmic structures scattered around the nuclei and, in part, co-expressing Bru-3 (Fig. 4F). Using a Stellaris single-molecule hybridization protocol to more accurately detect Actn transcripts in muscle cytoplasm, we observed a widespread cloud of mRNAs around the nuclei in the WT condition (Fig. 6A). In DM1960 and bru-3-overexpressing lines, the number of spots detected is decreased owing to reduced Actn transcript levels, as demonstrated by microarray (Fig. 4B) and RT-qPCR (Fig. 4C) analyses. On the contrary, in a bru-3 knockdown context (Mef>bru-3RNAi), the Actn mRNA signal is homogenously increased in the cytoplasm (Fig. 6A). Thus, these observations suggest that cytoplasmic Bru-3 directly or indirectly promotes the degradation of Actn mRNA. Whether nuclear Bru-3 contributes to the negative Actn transcript regulation in Mef>bru-3 context remains to be tested. However, considering that Bru-3 does not regulate Mlc1 at a transcriptional level (Fig. 4E), and that both Mlc1 and Actn transcripts display similar sensitivity to Bru-3 (Fig. 4C), we hypothesize that Actn regulation follows the Mlc1 scheme and is essentially post-transcriptional.
Fig. 6.

Modulating Bru-3 level influences Actn transcript and protein levels in an opposite manner. (A) Single-molecule FISH showing Actn transcripts in muscle cytoplasm (gray). Nuclei are visualized with DAPI (blue). Very low and lower Actn signals are detected in DM1960 and bru-3-overexpressing lines, respectively, compared with WT. Actn mRNA is enriched in the cytoplasm of the knockdown line muscles. Scale bars: 10 µm. (B) Actn protein immunostaining in the different conditions. Scale bars: 20 µm. (C) Western blot analysis of Actn protein and protein quantification relative to alpha-tubulin (α-tub) immunoblot (n=3-4). (D) qPCR of nascent and mature Actn transcripts shows that the Actn transcription rate remains unchanged between control (Mef>lacZ) and bru-3-overexpressing lines. **P<0.01 versus Mef>lacZ. (E) Models of Bru-3 actions on Actn transcripts and on Actn protein levels in normal and pathological conditions.
We next investigated Actn expression in pathological lines at the protein level. Actn displayed a striated pattern in control and pathological lines (Fig. 6B). Surprisingly, as shown by western blotting, changes in Actn protein levels did not follow those of Actn transcripts. In Bru-3-accumulating Mef>960CTG and Mef>bru-3 lines characterized by a highly reduced level of Actn RNA, reduction in Actn protein levels, even if detectable, was much less pronounced (Fig. 6C). In an opposite way, in the Mef>bru-3RNAi line, despite a high Actn transcript content in the cytoplasm, the Actn protein in the sarcomeres was dramatically reduced (Fig. 6B,C). Also, only the mature, but not nascent, Actn transcripts are reduced in Mef>bru-3 context (Fig. 6D), supporting post-transcriptional regulation of Actn by Bru-3. Altogether, these observations suggest that, in addition to negatively regulating Actn transcript storage, Bru-3 also positively regulates Actn protein synthesis. As the polyribosomes have been previously observed associated with sarcomeric myosin thick filaments (Heywood et al., 1967; Allen and Terrence, 1968), we hypothesize that sarcomeric proteins might be translated in situ (close to the site of protein incorporation), thus supporting the translation/co-translational assembly model of Zarnescu and Gregorio (2013). Cytoplasmic Bru-3 in the sarcomeres could be involved in positively regulating in situ translation (Fig. 6E).
DISCUSSION
The underlying molecular mechanisms of DM1 are particularly complex. Among them, the disruption of the balance between the splicing factors MBNL1 and CELF1 (Ho et al., 2005; Kuyumcu-Martinez et al., 2007), transcription factor deregulation (Ebralidze et al., 2004; Yadava et al., 2006; Dansithong et al., 2011), or altered maturation of miRNA (Perbellini et al., 2011; Rau et al., 2011) all lead to perturbations in transcript levels. MBNL1 sequestration and CELF1 accumulation are the first and best-studied mechanisms of DM1 pathogenesis, but the specific contribution of CELF1 to DM1-associated phenotypes has not yet been entirely elucidated. As 77% of human genes involved in diseases have an ortholog in Drosophila melanogaster (Reiter et al., 2001), we hypothesized that obtaining insights into CELF1 counterpart function in the fly could contribute to elucidating its significance in DM1.
The Drosophila CELF1-like gene, bru-3, is expressed in larval muscle and contributes to DM1-associated muscle phenotypes
Studies on mice have been conducted to dissect the involvement of MBNL1 and CELF1 in DM1 (Timchenko et al., 2004; Ho et al., 2005; Kanadia et al., 2006; Wang et al., 2007; Koshelev et al., 2010; Ward et al., 2010; Suenaga et al., 2012). However, understanding the respective contributions of these factors to DM1 phenotypes needs further investigation. Here, we applied a Drosophila model to better characterize the functions of CELF1/Bru-3.
Contrary to mbl attenuation, which reproduces all muscle phenotypes observed in DM1 larvae (Picchio et al., 2013), bru-3 overexpression phenocopies only some of them. Furthermore, we observed that reducing Bru-3 in the DM1960 line [DM1960,Df(bru-3)] preserves muscle function but fails to rescue myotonia-related muscle hypercontraction. Interestingly, a similar observation was made in the 5-313+/− mouse model of DM1, in which loss of CELF1 preserves muscle function but does not improve myotonia (Kim et al., 2014), thus suggesting that Drosophila is a reliable model for studying CELF1 involvement in DM1.
The partial contribution of Bru-3 to DM1 phenotypes is also indicated by the genome-wide analyses revealing that only 32% of the genes downregulated in DM1 contexts are also downregulated after muscle-targeted overexpression of bru-3. Among the downregulated genes common to DM1/overexpressed Bru-3, we found those encoding major sarcomeric components, such as Actn or Tpm, which suggests that their depletion could contribute to reduced muscle performance in DM1. As we observed that reducing Bru-3 in DM1 larvae corrected expression levels for most of the downregulated sarcomeric genes, we assume that sarcomeric gene deregulation in the Drosophila DM1 model is Bru-3 dependent.
Hence, our study is consistent with previous findings (Wang et al., 2007; Kim et al., 2014; de Haro et al., 2013) showing that CELF1 overexpression alone does not reproduce all the DM1 phenotypes.
Bru-3 and CELF1 regulate levels of sarcomere component transcripts
So far, it has been demonstrated that the alterations of MBNL1 or CELF1 in DM1 lead to mis-splicing of some sarcomere component transcripts, e.g. PDLIM3 (Lin et al., 2006), MYH14 (Rinaldi et al., 2012), MYOM1 (Koebis et al., 2011), TNNT2 (Philips et al., 1998) or TNNT3 (Lin et al., 2006; Vihola et al., 2010; Yamashita et al., 2012). However, a recent report showed that CELF1 has no major role in alternative splicing regulation in differentiating myoblasts (Peng et al., 2015). Absence of CELF1 did not correct mis-splicing events in a DM1 mouse model (5-313+/−) (Kim et al., 2014). Because CELF1 is also known as a key regulator of mRNA translation and decay in the cytoplasm (Iakova et al., 2004; Vlasova St Louis et al., 2013), we propose that the cytoplasmic functions of Bru-3/CELF1 might have an important, and so far underestimated, impact.
Indeed, as revealed by our transcriptomic studies, a set of transcripts encoding sarcomeric proteins displays a reduced level dependent on Bru-3. This could hardly result from mis-splicing as no alternative splicing events have been reported for some of them (Mlc2, TpnC47D). We also tested by CLIP-PCR whether CELF1 that is re-localized to the cytoplasm of C2C12 myotubes binds to sarcomeric mature mRNAs, and found that Actn, Tpm2 and Pdlim5 sort as its targets. Importantly, a report by Wang et al. (2015) confirms our findings, showing that in mouse muscles, CELF1 interacts directly with a large set of mRNAs encoding sarcomeric proteins. Consistent with our observations on bru-3 overexpression in flies, several sarcomeric transcripts are also affected by overexpressing CELF1 (Wang et al., 2015), suggesting a general role of CELF1/Bru-3 in regulating the stability/storage of mRNAs encoding sarcomeric components.
Potential dual role of Bru-3 in the sarcoplasm
Bru-3 in the cytoplasm resides in granules detected around nuclei and also displays striated sarcomeric pattern. In the bru-3 knockdown line, in which Bru-3 granules are almost absent, Actn mRNAs accumulate in muscle cytoplasm. Therefore, we hypothesize that Bru-3 could play a role in Actn mRNA release from granules. Also, the difference in ratios between transcripts and proteins of Actn in different contexts indicates a potential role for sarcomeric Bru-3 as a positive regulator of translation of mRNAs encoding sarcomeric proteins. One possibility is that Bru-3 regulates translation in muscle cells directly in sarcomeres, where it is localized. Taking all these observations into account, we propose a model for the dual cytoplasmic role of Bru-3 in muscles (Fig. 7).
Fig. 7.

Hypothetical model for dual Bru-3 role in the sarcoplasm. Sarcomeric transcripts such as Actn transcripts are exported from the nuclei to the sarcoplasm independently of Bru-3. Before being translated, they are stored in cytoplasmic granules/P-bodies. Cytoplasmic Bru-3 associates with granules and promotes release of sarcomeric mRNAs, which then undergo in situ translation in sarcomeres. Bru-3 positively regulates this in situ translation and at the same time leads to co-translational mRNA decay. The newly synthesized proteins, such as Actn protein, are immediately incorporated to the sarcomeres. Thus, according to this model, the increased levels of cytoplasmic Bru-3 detected in Bru-3-overexpressing and DM1 contexts would have double impact on sarcomeric components. Bru-3 associated with granules would favor the release of sarcomeric transcripts from these storage sites. In parallel, Bru-3 associated with sarcomeres would promote in situ translation of released transcripts and their quick subsequent decay, leading to the reduction of sarcomeric RNA levels. In such a context, proper turnover of sarcomeric components will be affected, or at least inefficient, and could contribute to muscle weakening observed in DM1.
According to this model, Bru-3 associated with stored mRNAs in granules/P-bodies around the nuclei would promote sarcomeric transcript release from these granules, whereas Bru-3 lying on both sides of the Z-line would positively regulate sarcomeric transcript translation and subsequent decay.
Several previously reported data support this hypothetical view. There is growing evidence that CELF1 colocalizes with P-bodies (Yu et al., 2013) and/or stress granules (Fujimura et al., 2008; Huichalaf et al., 2010; Vlasova-St Louis et al., 2013), and it has been reported that, in the absence of CELF1, p21 (CDKN1A) mRNA (a CELF1 target) accumulates in stress granules concomitant to an increased stability and a decreased translational efficiency. Inversely, chemical disruption of stress granules increased p21 translation while decreasing mRNA levels (Gareau et al., 2011). It has also been reported that Bru-3 could act as positive regulator of translation (Horb and Horb, 2010), that striated localization of Actn2 protein in cardiac myofibrils in the Celf1 knockdown condition is affected (Blech-Hermoni et al., 2016), and that polyribosomes align along myosin thick filaments in differentiating myofibrils (Heywood et al., 1967; Allen and Terrence, 1968). Finally, our hypothesis fits well with a previously proposed translation/co-translational assembly model of Zarnescu and Gregorio (2013) and with co-translational RNA decay as described in yeast (Pelechano et al., 2015).
In conclusion, this study shows that the Drosophila CELF1 counterpart, Bru-3, contributes to DM1 muscle alterations, and could thus represent an interesting target for therapeutic strategies. Our data suggest a novel dual cytoplasmic role of Bru-3 in DM1 in the regulation of sarcomere component expression. Bru-3 associated with granules would favor the release of sarcomeric transcripts from these storage sites, while Bru-3 located within sarcomeres would promote in situ translation of released transcripts and their quick subsequent decay. As a consequence, transcript/protein ratios of sarcomeric components are affected and could impact on sarcomeric protein turnover, thus contributing to muscle structure defects and reduced muscle performance observed in DM1 patients. Further insights into Bru-3/CELF1 function in the sarcoplasm could shed more light on sarcomere maintenance and disturbed muscle function in DM1.
MATERIALS AND METHODS
Drosophila strains and crosses
All D. melanogaster stocks were grown and crossed on standard medium at 25°C. The site-specific inducible UAS-960CTG line that expresses 960-interrupted CTG has been described previously (Picchio et al., 2013). This line was recombined with the Df(3L)Exel6119 line obtained from the Bloomington Drosophila Stock Center (BDSC, Bloomington, IN, USA) and is referred to as UAS-960CTG,Df(bru-3). bru-3d09837 [also cited as UAS-bru-3(37)], bru-3d09843 [also cited as UAS-bru-3(43)] and w1118;P{UAS-lacZ.B}meltBg4-1-2 (cited as UAS-lacZ) were also obtained from the BDSC. bru-3KK111663 (cited as the UAS-bru-3RNAi line) was obtained from the Vienna Drosophila RNAi Center (Vienna, Austria). Transgene expression was specifically driven in somatic muscles via the Mef>mCD8GFP line (a gift from A. Paululat, University of Osnabrück, Osnabrück, Germany) or the Mef-Gal4 line (#27390, BDSC). Transgenic control lines were obtained by crossing transgenic lines with standard w1118. The driver control line was obtained by crossing the driver line with the UAS-lacZ line (Mef>lacZ).
Motility test, muscle pattern assessment and measurements
The righting assay and muscle pattern assessment and measurements were performed as previously described (Picchio et al., 2013).
Microarray analysis
Three independent total RNA isolations were performed on Mef>bru-3(37) and Mef>lacZ third-instar larvae using TRIzol reagent (Invitrogen) and the Agilent Drosophila gene expression microarray (G2519F, Strasbourg, France). Treeview (version 1.60, University of California at Berkeley) was used to confirm similarity (>70% Pearson correlation) between triplicates. The cutoff was set to a P-value <0.001 and a twofold increase/decrease. Differentially expressed genes were then classified according to the biological process they are involved in (Flybase). Microarray data are available in the ArrayExpress database under accession numbers E-MTAB-3231 and E-MTAB-1469.
RT-qPCR
Total RNA was extracted from ∼100 µg of whole third-instar larvae using TRIzol reagent (Invitrogen). Then, 5 µg total RNA was treated with DNase I and reverse transcribed on a SuperScriptIII First Strand Synthesis System according to the provider's protocol (Invitrogen). Quantitative PCR was performed in duplicate in a final volume of 20 µl using Power SYBR Green PCR Master Mix (Roche, Applied Science) on a LightCycler 480 Real-Time PCR System (Roche, Applied Science). The primer combinations used are listed in Table S4. The relative quantifications of transcripts were obtained with the ΔΔCt method. Owing to the small number of samples (n=4-8), we opted for the nonparametric Kruskal–Wallis test to compare each genotype in order to determine whether their differences of distribution were significant. When appropriate, nonparametric Mann–Whitney tests were performed to compare control samples and samples of interest.
In situ hybridization and immunofluorescent staining of Drosophila larval muscles
Third-instar larvae dissections were performed in 0.9% NaCl buffer containing 25 mM EDTA (except in the fiber contraction assay when EDTA was not added). Larval muscles were then fixed for 10 min in 4% formaldehyde on a plate, transferred to an Eppendorf tube, rinsed three times for 5 min in 1× PBS, 0.5% Tween (PBT) and blocked for 20 min in 1× PBT, 20% horse serum at room temperature. Incubation with primary antibody was performed for 2 h at room temperature with mouse monoclonal anti-Lamin C 28.26 (1:600; Developmental Studies Hybridoma Bank, Iowa, USA), rabbit anti-Bru-3 (1:1000; Millegen, Toulouse, France), rat monoclonal anti-Actn (1:200; BT-GB-276P, Babraham Technologies, Cambridge, UK). Muscles were then washed three times for 10 min with 1× PBT and incubated with fluorescent secondary antibodies (1:300; Jackson ImmunoResearch) for 1 h at room temperature and/or with phalloidin-TRITC (1:1000; P1951, Sigma-Aldrich) or Alexa Fluor 647-conjugated phalloidin (A22287, Invitrogen).
For standard sarcomeric protein transcript detection, in situ hybridization on larval muscles was performed on a TSA amplification system (Perkin-Elmer) according to the manufacturer's protocol. Immunostaining was performed in parallel to Dig detection. Mlc-1 and Actn Gold collection clones RE07220 and LD37956 were used to generate Dig-labeled RNA probes. For single-molecule FISH, custom Stellaris FISH probes were designed against the Actn open reading frame by utilizing the Stellaris FISH Probe Designer (Biosearch Technologies, Petaluma, CA, USA) available online at www.biosearchtech.com/stellarisdesigner. Larval muscles were hybridized with the Actn Stellaris FISH Probe set labeled with TAMRA Dye (Biosearch Technologies), following the manufacturer's instructions available online at www.biosearchtech.com/stellarisprotocols. Briefly, dissected muscles were fixed for 20 min in 4% paraformaldehyde and then rinsed twice for 5 min in 1× PBT. Tissues were then permeabilized with 75% ethanol for 5 min, then washed for 5 min in Stallaris Wash Buffer A (Biosearch Technologies). Hybridization was performed at 37°C in the dark for 4 h with 100 µl Stellaris hybridization buffer, containing 1 µl of 12.5 µM Stellaris probes. After hybridization, samples were rinsed in the dark for 30 min with Stellaris Wash Buffer A at 37°C and then for 5 min with Stellaris Wash Buffer B (Biosearch Technologies) at room temperature.
Dissected muscles were mounted in Vectashield with 4′,6-diamidino-2-phenylindole (DAPI). Images were acquired on a Leica SP8 confocal microscope. For quantification of Bru-3 in the different contexts, immunostainings were performed using the same dilution of antibodies. Images were acquired using the same settings on the Leica SP8 microscope throughout. Quantification of the signal was performed using Fiji software (https://fiji.sc/) following similar treatment of the picture.
Western blot
Total protein was extracted from 0.1 mg of third-instar larvae using Buffer C (0.2 mM EDTA, 20 mM HEPES, 420 mM NaCl, 1.5 mM MgCl2, 25% glycerol, 0.2% Tween) supplemented with cocktail protease inhibitor (Complete Tablets Mini EDTA-free EASY Pack, Roche), with three to four samples/condition. Supernatant was collected after centrifugation (10 min, 18,300 g, 4°C) and quantified using the Bradford assay. Samples were denatured in a loading buffer (β-mercaptoethanol) at 95°C for 10 min and resolved on 4-15% SDS-polyacrylamide gel (Mini PROTEAN TGX Gel, Bio-Rad, USA). To prevent formation of disulfide bonds and dissociate protein aggregates we applied iodoacetamide (IAA) treatment according to the manufacturer’s protocol (FOCUS Protein Alkylation kit, G-Biosciences, USA), with 40 μg of protein deposited per well. Separated proteins were electrotransferred onto nitrocellulose membrane using the Trans-Blot Turbo device (RTA Transfer Kit, Bio-Rad). Nonspecific sites were blocked for 30 min with Tris-buffered saline (TBS) containing 0.1% Tween 20 and 5% nonfat dry milk (blocking solution). The membranes were then incubated for 2 h at room temperature with rat monoclonal anti-Actn (1:10,000, BT-GB-276P, Babraham Technologies), and mouse monoclonal anti-alpha tubulin clone DM1A (1:10,000, T9026, Sigma-Aldrich) antibodies diluted in blocking solution. The membranes were washed in TBS-Tween 0.1% (three times for 5 min each and once for 15 min) and then incubated with peroxidase-conjugated secondary anti-IgG antibodies (Abcam) diluted 1/5000 in blocking solution. After rewashing in TBS-Tween 0.1% (three times for 5 min each), membrane peroxidase activity was tested by enhanced chemiluminescence (Pierce ECL2, Thermo Fisher Scientific) on a lumino-imaging analyzer (Chemidoc MP System, Life Science Research, Bio-Rad, France).
Differentiation and immunofluorescent staining of C2C12 cells
C2C12 mouse myoblast cells were maintained in Dulbecco's modified Eagle's medium (DMEM) supplemented with 10% fetal bovine serum at 37°C in 5% CO2. For immunostaining, cells were grown on standard untreated coverslips. Myogenic differentiation was induced on confluent cells by switching culture medium to DMEM supplemented with 2% horse serum and insulin (5 µg/ml). Cells were held in differentiation medium for 10 days, with the medium replaced every 2 days. Differentiated or undifferentiated cells were rinsed in ice-cold PBS containing 1 mM MgCl2 and 1 mM CaCl2, then fixed for 30 min in ice-cold PBS containing 1 mM MgCl2, 1 mM CaCl2 and 4% paraformaldehyde. Cells were rinsed in PBS, permeabilized with 0.2% Triton X-100 in PBS for 15 min, re-rinsed with PBS, and blocked in PBS containing 3% bovine serum albumin (BSA). The blocked cells were incubated overnight at 4°C with primary antibodies (monoclonal anti-CELF1, clone 3B1, Santa Cruz Biotechnology) at 1 µg/ml in PBS containing 0.1% Tween and 1% BSA. Cells were rinsed three times in PBS containing 0.1% Tween and incubated for 2 h at 4°C with secondary antibodies (anti-mouse IgG coupled to Alexa Fluor 546, Invitrogen) at 1:2000 in PBS containing 0.1% Tween and 1% BSA. Cells were washed three times in PBS containing 0.1% Tween and counterstained with DAPI (0.01 µg/ml in PBS). Coverslips were mounted with ProLong Gold (Invitrogen) and observed using an Axio Imager M2 microscope (Zeiss) equipped with a 40× Plan-APOCHROMAT objective lens (Zeiss). Images were acquired on a CoolSNAP HQ2 CCD camera (Photometrics) and processed using ImageJ software (https://imagej.nih.gov/ij/).
RNA CLIP
C2C12 were grown to confluence on 15 cm dishes and differentiated for 1 week in DMEM supplemented with 2% horse serum and insulin (5 µg/ml). For UV cross-linking, cells were rinsed in PBS and irradiated three times with 4000 µJ/cm² at 254 nm in a Stratalinker (Stratagene). Extracts were prepared by scraping in 300 µl PXL [1× PXL in PBS (no Ca2+ no Mg2+), 0.1% SDS, 0.5% nonidet P-40 (NP40), 0.5% sodium deoxycholate], then stored at −80°C. Beads used for immunoprecipitation were prepared by incubating 16 µg of antibodies (anti-CELF1, clone 3B1, Santa Cruz Biotechnology) or 16 µg of control IgG (I5381, Sigma-Aldrich) with 150 µl of a protein G-coupled paramagnetic bead suspension (Dynabeads Protein G, Novex) for 15 h at 4°C in PBST (PBS containing 0.01% Triton). Beads were blocked for 1 h in PBST containing 0.1% BSA and rinsed three times in PXL before use. For immunoprecipitation, cell extracts (300 µl) were mixed with 300 µl of PXL containing protease inhibitors (1/500, P8340, Sigma-Aldrich), DTT (2 mM), RNAsin (Promega, 1200 units/ml) and TurboDNase (Ambion, 40 units/ml). Genomic DNA was digested by incubating the samples for 10 min at 37°C with 1000 rpm agitation. Samples were centrifuged at 14,000 g for 15 min at 4°C. Supernatant (600 µl) was recovered and 20 µl was kept on ice (input fraction). Supernatants were added to 25 µl of either control IgG beads or anti-CELF1 beads. Immunoprecipitations were carried out at 4°C for 2 h. Beads were washed six times with stRIPA (50 mM Tris-HCl, pH 7.4, 1 M NaCl, 0.5% NP40, 1% sodium deoxycholate, 0.5 mM EDTA, 0.1% SDS, 2 M urea). Input fractions and washed beads were mixed with 47.5 µl of elution mixture [60 units/ml proteinase K (Thermo Fisher Scientific) and 200 µg/ml transfer RNA in stRIPA] and incubated for 30 min at 37°C. RNA was extracted with TriReagent (Sigma-Aldrich) and precipitated in propanol-2. RNA pellets were resuspended in 20 µl water, and 10 µl was reverse transcribed with random primers and Superscript II reverse transcriptase (Invitrogen). Complementary DNA (0.15 µl per reaction) was analyzed by RT-qPCR with SYBR Green PCR Mastermix (Applied Biosystems, 5 µl per reaction) and primer pairs at 0.5 µM in a total volume of 10 µl. The primer pairs used are listed in Table S5. Transcript enrichments in immunoprecipitated complexes were assessed by normalizing the Ct values measured in beads to those measured in input samples [Ct(Input)–Ct(Beads)]. Measures were taken from three independent cell dishes, and the enrichments obtained on specific (3B1 antibody-coupled) beads were compared with those obtained on control (IgG-coupled) beads, using a Student's t-test.
In silico positioning of destabilizing motifs in 3′UTR sequences
3′UTR sequences were collected from UCSC (http://genome.ucsc.edu/) databases and BLASTed with either destabilizing motifs (Lee et al., 2010) (Table S3) or random motifs (Table S4) using a script purpose-developed in C++. Enrichments in the group of transcripts bound by CELF1 versus unbound transcripts group were tested for significance using Khi2 test without Yates' correction. BLAST positions for each sequence were sorted to generate hand-made diagrams in Excel.
Statistics
All statistical analyses were performed using GraphPad Prism (version 5.02) software. Normality of the samples was assessed with a Kolmogorov–Smirnov test. One-way ANOVA (Newman-Keuls multiple comparison test or Dunn's multiple comparison post-test) were used for statistical comparisons of each pathologic line against its respective driver control line and/or transgenic control line. The smallest significance of both comparisons is reported on the graph. A Mann–Whitney test was only performed to compare the DM1960 line with the DM1960,Df(bru-3) in rescue experiments, or the two bru-3 overexpressing lines where reported. Results are reported as means±s.e.m., with P<0.05 considered statistically significant.
Supplementary Material
Acknowledgements
We thank M. Simonelig and N. Charlet for their helpful comments, A. Nakamura for providing the Me31B antibodies, F. Schnorrer for providing the Arrest antibody and T. Jagla for technical assistance. We also thank the Epigenetics and Cancer team (IGDR, Rennes) for access to their microscope facilities.
Footnotes
Competing interests
The authors declare no competing or financial interests.
Author contributions
Conceptualization: L. Picchio, V.L., L. Paillard, K.J.; Methodology: L. Picchio, V.L., S.D., S.C.; Software: Y.R.; Formal analysis: L. Picchio, V.L., S.D., Y.R., S.C., L. Paillard, K.J.; Investigation: L. Picchio, V.L., K.J.; Data curation: Y.R.; Writing - original draft: L. Picchio, K.J.; Writing - review & editing: V.L., L. Paillard, K.J.; Supervision: L. Paillard, K.J.; Funding acquisition: K.J.
Funding
This work was supported by AFM-Téléthon (MyoNeurAlp Strategic Program), Agence Nationale de la Recherche (Tefor Infrastructure Grant) and Fondation pour la Recherche Médicale (Equipe FRM Award).
Data availability
Microarray data are available in the ArrayExpress database under accession numbers E-MTAB-3231 and E-MTAB-1469.
Supplementary information
Supplementary information available online at http://dmm.biologists.org/lookup/doi/10.1242/dmm.031849.supplemental
References
- Allen E. R. and Terrence C. F. (1968). Immunochemical and ultrastructural studies of myosin synthesis. Proc. Natl. Acad. Sci. USA 60, 1209-1215. 10.1073/pnas.60.4.1209 [DOI] [PMC free article] [PubMed] [Google Scholar]
- Amack J. D. and Mahadevan M. S. (2001). The myotonic dystrophy expanded CUG repeat tract is necessary but not sufficient to disrupt C2C12 myoblast differentiation. Hum. Mol. Genet. 10, 1879-1887. 10.1093/hmg/10.18.1879 [DOI] [PubMed] [Google Scholar]
- Anant S., Henderson J. O., Mukhopadhyay D., Navaratnam N., Kennedy S., Min J. and Davidson N. O. (2001). Novel role for RNA-binding protein CUGBP2 in mammalian RNA editing. CUGBP2 modulates C to U editing of apolipoprotein B mRNA by interacting with apobec-1 and ACF, the apobec-1 complementation factor. J. Biol. Chem. 276, 47338-47351. 10.1074/jbc.M104911200 [DOI] [PubMed] [Google Scholar]
- Blech-Hermoni Y., Sullivan C. B., Jenkins M. W., Wessely O. and Ladd A. N. (2016). CUG-BP, Elav-like family member 1 (CELF1) is required for normal myofibrillogenesis, morphogenesis, and contractile function in the embryonic heart. Dev. Dyn. Off. Publ. Am. Assoc. Anat. 245, 854-873. 10.1002/dvdy.24413 [DOI] [PMC free article] [PubMed] [Google Scholar]
- Brook J. D., McCurrach M. E., Harley H. G., Buckler A. J., Church D., Aburatani H., Hunter K., Stanton V. P., Thirion J. P. and Hudson T. (1992). Molecular basis of myotonic dystrophy: expansion of a trinucleotide (CTG) repeat at the 3′ end of a transcript encoding a protein kinase family member. Cell 69, 385 10.1016/0092-8674(92)90154-5 [DOI] [PubMed] [Google Scholar]
- Charlet-B N., Savkur R. S., Singh G., Philips A. V., Grice E. A. and Cooper T. A. (2002). Loss of the muscle-specific chloride channel in type 1 myotonic dystrophy due to misregulated alternative splicing. Mol. Cell 10, 45-53. 10.1016/S1097-2765(02)00572-5 [DOI] [PubMed] [Google Scholar]
- Chartier A., Benoit B. and Simonelig M. (2006). A Drosophila model of oculopharyngeal muscular dystrophy reveals intrinsic toxicity of PABPN1. EMBO J. 25, 2253-2262. 10.1038/sj.emboj.7601117 [DOI] [PMC free article] [PubMed] [Google Scholar]
- Dansithong W., Jog S. P., Paul S., Mohammadzadeh R., Tring S., Kwok Y., Fry R. C., Marjoram P., Comai L. and Reddy S. (2011). RNA steady-state defects in myotonic dystrophy are linked to nuclear exclusion of SHARP. EMBO Rep. 12, 735-742. 10.1038/embor.2011.86 [DOI] [PMC free article] [PubMed] [Google Scholar]
- Davis B. M., McCurrach M. E., Taneja K. L., Singer R. H. and Housman D. E. (1997). Expansion of a CUG trinucleotide repeat in the 3′ untranslated region of myotonic dystrophy protein kinase transcripts results in nuclear retention of transcripts. Proc. Natl. Acad. Sci. USA 94, 7388-7393. 10.1073/pnas.94.14.7388 [DOI] [PMC free article] [PubMed] [Google Scholar]
- de Haro M., Al-Ramahi I., De Gouyon B., Ukani L., Rosa A., Faustino N. A., Ashizawa T., Cooper T. A. and Botas J. (2006). MBNL1 and CUGBP1 modify expanded CUG-induced toxicity in a Drosophila model of myotonic dystrophy type 1. Hum. Mol. Genet. 15, 2138-2145. 10.1093/hmg/ddl137 [DOI] [PubMed] [Google Scholar]
- de Haro M., Al-Ramahi I., Jones K. R., Holth J. K., Timchenko L. T. and Botas J. (2013). Smaug/SAMD4A restores translational activity of CUGBP1 and suppresses CUG-induced myopathy. PLoS Genet. 9, e1003445 10.1371/journal.pgen.1003445 [DOI] [PMC free article] [PubMed] [Google Scholar]
- Delaunay J., Le Mée G., Ezzeddine N., Labesse G., Terzian C., Capri M. and Aït-Ahmed O. (2004). The Drosophila Bruno paralogue Bru-3 specifically binds the EDEN translational repression element. Nucleic Acids Res. 32, 3070-3082. 10.1093/nar/gkh627 [DOI] [PMC free article] [PubMed] [Google Scholar]
- Dhaenens C. M., Tran H., Frandemiche M.-L., Carpentier C., Schraen-Maschke S., Sistiaga A., Goicoechea M., Eddarkaoui S., Van Brussels E., Obriot H. et al. (2011). Mis-splicing of Tau exon 10 in myotonic dystrophy type 1 is reproduced by overexpression of CELF2 but not by MBNL1 silencing. Biochim. Biophys. Acta 1812, 732-742. 10.1016/j.bbadis.2011.03.010 [DOI] [PubMed] [Google Scholar]
- Ebralidze A., Wang Y., Petkova V., Ebralidse K. and Junghans R. P. (2004). RNA leaching of transcription factors disrupts transcription in myotonic dystrophy. Science 303, 383-387. 10.1126/science.1088679 [DOI] [PubMed] [Google Scholar]
- Fardaei M., Rogers M. T., Thorpe H. M., Larkin K., Hamshere M. G., Harper P. S. and Brook J. D. (2002). Three proteins, MBNL, MBLL and MBXL, co-localize in vivo with nuclear foci of expanded-repeat transcripts in DM1 and DM2 cells. Hum. Mol. Genet. 11, 805-814. 10.1093/hmg/11.7.805 [DOI] [PubMed] [Google Scholar]
- Fu Y. H., Pizzuti A., Fenwick R. G., King J., Rajnarayan S., Dunne P. W., Dubel J., Nasser G. A., Ashizawa T. and de Jong P. (1992). An unstable triplet repeat in a gene related to myotonic muscular dystrophy. Science 255, 1256-1258. 10.1126/science.1546326 [DOI] [PubMed] [Google Scholar]
- Fujimura K., Kano F. and Murata M. (2008). Dual localization of the RNA binding protein CUGBP-1 to stress granule and perinucleolar compartment. Exp. Cell Res. 314, 543-553. 10.1016/j.yexcr.2007.10.024 [DOI] [PubMed] [Google Scholar]
- Furling D., Coiffier L., Mouly V., Barbet J. P., St Guily J. L., Taneja K., Gourdon G., Junien C. and Butler-Browne G. S. (2001). Defective satellite cells in congenital myotonic dystrophy. Hum. Mol. Genet. 10, 2079-2087. 10.1093/hmg/10.19.2079 [DOI] [PubMed] [Google Scholar]
- Garcia-Lopez A., Monferrer L., Garcia-Alcover I., Vicente-Crespo M., Alvarez-Abril M. C. and Artero R. D. (2008). Genetic and Chemical Modifiers of a CUG Toxicity Model in Drosophila. PLoS ONE 3, e1595 10.1371/journal.pone.0001595 [DOI] [PMC free article] [PubMed] [Google Scholar]
- Gareau C., Fournier M.-J., Filion C., Coudert L., Martel D., Labelle Y. and Mazroui R. (2011). p21(WAF1/CIP1) upregulation through the stress granule-associated protein CUGBP1 confers resistance to bortezomib-mediated apoptosis. PLoS ONE 6, e20254 10.1371/journal.pone.0020254 [DOI] [PMC free article] [PubMed] [Google Scholar]
- Good P. J., Chen Q., Warner S. J. and Herring D. C. (2000). A family of human RNA-binding proteins related to the Drosophila Bruno translational regulator. J. Biol. Chem. 275, 28583-28592. 10.1074/jbc.M003083200 [DOI] [PubMed] [Google Scholar]
- Heywood S. M., Dowben R. M. and Rich A. (1967). The identification of polyribosomes synthesizing myosin. Proc. Natl. Acad. Sci. USA 57, 1002-1009. 10.1073/pnas.57.4.1002 [DOI] [PMC free article] [PubMed] [Google Scholar]
- Ho T. H., Savkur R. S., Poulos M. G., Mancini M. A., Swanson M. S. and Cooper T. A. (2005). Colocalization of muscleblind with RNA foci is separable from mis-regulation of alternative splicing in myotonic dystrophy. J. Cell Sci. 118, 2923-2933. 10.1242/jcs.02404 [DOI] [PubMed] [Google Scholar]
- Horb L. D. and Horb M. E. (2010). BrunoL1 regulates endoderm proliferation through translational enhancement of cyclin A2 mRNA. Dev. Biol. 345, 156-169. 10.1016/j.ydbio.2010.07.005 [DOI] [PMC free article] [PubMed] [Google Scholar]
- Huichalaf C., Sakai K., Jin B., Jones K., Wang G.-L., Schoser B., Schneider-Gold C., Sarkar P., Pereira-Smith O. M., Timchenko N. et al. (2010). Expansion of CUG RNA repeats causes stress and inhibition of translation in myotonic dystrophy 1 (DM1) cells. FASEB J. 24, 3706-3719. 10.1096/fj.09-151159 [DOI] [PMC free article] [PubMed] [Google Scholar]
- Iakova P., Wang G.-L., Timchenko L., Michalak M., Pereira-Smith O. M., Smith J. R. and Timchenko N. A. (2004). Competition of CUGBP1 and calreticulin for the regulation of p21 translation determines cell fate. EMBO J. 23, 406-417. 10.1038/sj.emboj.7600052 [DOI] [PMC free article] [PubMed] [Google Scholar]
- Kanadia R. N., Shin J., Yuan Y., Beattie S. G., Wheeler T. M., Thornton C. A. and Swanson M. S. (2006). Reversal of RNA missplicing and myotonia after muscleblind overexpression in a mouse poly(CUG) model for myotonic dystrophy. Proc. Natl. Acad. Sci. USA 103, 11748-11753. 10.1073/pnas.0604970103 [DOI] [PMC free article] [PubMed] [Google Scholar]
- Khandjian E. W., Bardoni B., Corbin F., Sittler A., Giroux S., Heitz D., Tremblay S., Pinset C., Montarras D., Rousseau F. et al. (1998). Novel isoforms of the fragile X related protein FXR1P are expressed during myogenesis. Hum. Mol. Genet. 7, 2121-2128. 10.1093/hmg/7.13.2121 [DOI] [PubMed] [Google Scholar]
- Kim Y. K., Mandal M., Yadava R. S., Paillard L. and Mahadevan M. S. (2014). Evaluating the effects of CELF1 deficiency in a mouse model of RNA toxicity. Hum. Mol. Genet. 23, 293-302. 10.1093/hmg/ddt419 [DOI] [PMC free article] [PubMed] [Google Scholar]
- Kino Y., Washizu C., Oma Y., Onishi H., Nezu Y., Sasagawa N., Nukina N. and Ishiura S. (2009). MBNL and CELF proteins regulate alternative splicing of the skeletal muscle chloride channel CLCN1. Nucleic Acids Res. 37, 6477-6490. 10.1093/nar/gkp681 [DOI] [PMC free article] [PubMed] [Google Scholar]
- Koebis M., Ohsawa N., Kino Y., Sasagawa N., Nishino I. and Ishiura S. (2011). Alternative splicing of myomesin 1 gene is aberrantly regulated in myotonic dystrophy type 1. Genes Cells Devoted Mol. Cell. Mech. 16, 961-972. 10.1111/j.1365-2443.2011.01542.x [DOI] [PubMed] [Google Scholar]
- Koshelev M., Sarma S., Price R. E., Wehrens X. H. T. and Cooper T. A. (2010). Heart-specific overexpression of CUGBP1 reproduces functional and molecular abnormalities of myotonic dystrophy type 1. Hum. Mol. Genet. 19, 1066-1075. 10.1093/hmg/ddp570 [DOI] [PMC free article] [PubMed] [Google Scholar]
- Kroksmark A.-K., Ekström A.-B., Björck E. and Tulinius M. (2005). Myotonic dystrophy: muscle involvement in relation to disease type and size of expanded CTG-repeat sequence. Dev. Med. Child Neurol. 47, 478-485. 10.1017/S0012162205000927 [DOI] [PubMed] [Google Scholar]
- Kuyumcu-Martinez N. M., Wang G.-S. and Cooper T. A. (2007). Increased steady-state levels of CUGBP1 in myotonic dystrophy 1 are due to PKC-mediated hyperphosphorylation. Mol. Cell 28, 68-78. 10.1016/j.molcel.2007.07.027 [DOI] [PMC free article] [PubMed] [Google Scholar]
- Ladd A. N., Charlet-B N. and Cooper T. A. (2001). The CELF family of RNA binding proteins is implicated in cell-specific and developmentally regulated alternative splicing. Mol. Cell. Biol. 21, 1285-1296. 10.1128/MCB.21.4.1285-1296.2001 [DOI] [PMC free article] [PubMed] [Google Scholar]
- Ladd A. N., Taffet G., Hartley C., Kearney D. L. and Cooper T. A. (2005). Cardiac tissue-specific repression of CELF activity disrupts alternative splicing and causes cardiomyopathy. Mol. Cell. Biol. 25, 6267-6278. 10.1128/MCB.25.14.6267-6278.2005 [DOI] [PMC free article] [PubMed] [Google Scholar]
- Le Tonquèze O., Gschloessl B., Namanda-Vanderbeken A., Legagneux V., Paillard L. and Audic Y. (2010). Chromosome wide analysis of CUGBP1 binding sites identifies the tetraspanin CD9 mRNA as a target for CUGBP1-mediated down-regulation. Biochem. Biophys. Res. Commun. 394, 884-889. 10.1016/j.bbrc.2010.03.020 [DOI] [PubMed] [Google Scholar]
- Lee J. E., Lee J. Y., Wilusz J., Tian B. and Wilusz C. J. (2010). Systematic analysis of cis-elements in unstable mRNAs demonstrates that CUGBP1 is a key regulator of mRNA decay in muscle cells. PLoS ONE 5, e11201 10.1371/journal.pone.0011201 [DOI] [PMC free article] [PubMed] [Google Scholar]
- Lin X., Miller J. W., Mankodi A., Kanadia R. N., Yuan Y., Moxley R. T., Swanson M. S. and Thornton C. A. (2006). Failure of MBNL1-dependent post-natal splicing transitions in myotonic dystrophy. Hum. Mol. Genet. 15, 2087-2097. 10.1093/hmg/ddl132 [DOI] [PubMed] [Google Scholar]
- Llamusi B., Bargiela A., Fernandez-Costa J. M., Garcia-Lopez A., Klima R., Feiguin F. and Artero R. (2013). Muscleblind, BSF and TBPH are mislocalized in the muscle sarcomere of a Drosophila myotonic dystrophy model. Dis. Model. Mech. 6, 184-196. 10.1242/dmm.009563 [DOI] [PMC free article] [PubMed] [Google Scholar]
- Masuda A., Andersen H. S., Doktor T. K., Okamoto T., Ito M., Andresen B. S. and Ohno K. (2012). CUGBP1 and MBNL1 preferentially bind to 3′ UTRs and facilitate mRNA decay. Sci. Rep. 2, 209 10.1038/srep00209 [DOI] [PMC free article] [PubMed] [Google Scholar]
- McCloy R. A., Rogers S., Caldon C. E., Lorca T., Castro A. and Burgess A. (2014). Partial inhibition of Cdk1 in G 2 phase overrides the SAC and decouples mitotic events. Cell Cycle 13, 1400-1412. 10.4161/cc.28401 [DOI] [PMC free article] [PubMed] [Google Scholar]
- Mientjes E. J., Willemsen R., Kirkpatrick L. L., Nieuwenhuizen I. M., Hoogeveen-Westerveld M., Verweij M., Reis S., Bardoni B., Hoogeveen A. T., Oostra B. A. et al. (2004). Fxr1 knockout mice show a striated muscle phenotype: implications for Fxr1p function in vivo. Hum. Mol. Genet. 13, 1291-1302. 10.1093/hmg/ddh150 [DOI] [PubMed] [Google Scholar]
- Mooers B. H. M., Logue J. S. and Berglund J. A. (2005). The structural basis of myotonic dystrophy from the crystal structure of CUG repeats. Proc. Natl. Acad. Sci. USA 102, 16626-16631. 10.1073/pnas.0505873102 [DOI] [PMC free article] [PubMed] [Google Scholar]
- Oas S. T., Bryantsev A. L. and Cripps R. M. (2014). Arrest is a regulator of fiber-specific alternative splicing in the indirect flight muscles of Drosophila. J. Cell Biol. 206, 895-908. 10.1083/jcb.201405058 [DOI] [PMC free article] [PubMed] [Google Scholar]
- Orengo J. P., Chambon P., Metzger D., Mosier D. R., Snipes G. J. and Cooper T. A. (2008). Expanded CTG repeats within the DMPK 3′ UTR causes severe skeletal muscle wasting in an inducible mouse model for myotonic dystrophy. Proc. Natl. Acad. Sci. USA 105, 2646-2651. 10.1073/pnas.0708519105 [DOI] [PMC free article] [PubMed] [Google Scholar]
- Paillard L., Legagneux V. and Osborne H. B. (2003). A functional deadenylation assay identifies human CUG-BP as a deadenylation factor. Biol. Cell 95, 107-113. 10.1016/S0248-4900(03)00010-8 [DOI] [PubMed] [Google Scholar]
- Pelechano V., Wei W. and Steinmetz L. M. (2015). Widespread co-translational RNA decay reveals ribosome dynamics. Cell 161, 1400-1412. 10.1016/j.cell.2015.05.008 [DOI] [PMC free article] [PubMed] [Google Scholar]
- Peng X., Shen X., Chen X., Liang R., Azares A. R. and Liu Y. (2015). Celf1 regulates cell cycle and is partially responsible for defective myoblast differentiation in myotonic dystrophy RNA toxicity. Biochim. Biophys. Acta 1852, 1490-1497. 10.1016/j.bbadis.2015.04.010 [DOI] [PubMed] [Google Scholar]
- Perbellini R., Greco S., Sarra-Ferraris G., Cardani R., Capogrossi M. C., Meola G. and Martelli F. (2011). Dysregulation and cellular mislocalization of specific miRNAs in myotonic dystrophy type 1. Neuromuscul. Disord. 21, 81-88. 10.1016/j.nmd.2010.11.012 [DOI] [PubMed] [Google Scholar]
- Philips A. V., Timchenko L. T. and Cooper T. A. (1998). Disruption of splicing regulated by a CUG-binding protein in myotonic dystrophy. Science 280, 737-741. 10.1126/science.280.5364.737 [DOI] [PubMed] [Google Scholar]
- Picchio L., Plantie E., Renaud Y., Poovthumkadavil P. and Jagla K. (2013). Novel Drosophila model of myotonic dystrophy type 1: phenotypic characterization and genome-wide view of altered gene expression. Hum. Mol. Genet. 22, 2795-2810. 10.1093/hmg/ddt127 [DOI] [PubMed] [Google Scholar]
- Rattenbacher B., Beisang D., Wiesner D. L., Jeschke J. C., von Hohenberg M., St Louis-Vlasova I. A. and Bohjanen P. R. (2010). Analysis of CUGBP1 targets identifies GU-repeat sequences that mediate rapid mRNA decay. Mol. Cell. Biol. 30, 3970-3980. 10.1128/MCB.00624-10 [DOI] [PMC free article] [PubMed] [Google Scholar]
- Rau F., Freyermuth F., Fugier C., Villemin J.-P., Fischer M.-C., Jost B., Dembele D., Gourdon G., Nicole A., Duboc D. et al. (2011). Misregulation of miR-1 processing is associated with heart defects in myotonic dystrophy. Nat. Struct. Mol. Biol. 18, 840-845. 10.1038/nsmb.2067 [DOI] [PubMed] [Google Scholar]
- Reiter L. T., Potocki L., Chien S., Gribskov M. and Bier E. (2001). A systematic analysis of human disease-associated gene sequences in Drosophila melanogaster. Genome Res. 11, 1114-1125. 10.1101/gr.169101 [DOI] [PMC free article] [PubMed] [Google Scholar]
- Rinaldi F., Terracciano C., Pisani V., Massa R., Loro E., Vergani L., Di Girolamo S., Angelini C., Gourdon G., Novelli G. et al. (2012). Aberrant splicing and expression of the non muscle myosin heavy-chain gene MYH14 in DM1 muscle tissues. Neurobiol. Dis. 45, 264-271. 10.1016/j.nbd.2011.08.010 [DOI] [PubMed] [Google Scholar]
- Rubin G. M., Yandell M. D., Wortman J. R., Gabor Miklos G. L., Nelson C. R., Hariharan I. K., Fortini M. E., Li P. W., Apweiler R., Fleischmann W. et al. (2000). Comparative genomics of the eukaryotes. Science 287, 2204-2215. 10.1126/science.287.5461.2204 [DOI] [PMC free article] [PubMed] [Google Scholar]
- Savkur R. S., Philips A. V. and Cooper T. A. (2001). Aberrant regulation of insulin receptor alternative splicing is associated with insulin resistance in myotonic dystrophy. Nat. Genet. 29, 40-47. 10.1038/ng704 [DOI] [PubMed] [Google Scholar]
- Savkur R. S., Philips A. V., Cooper T. A., Dalton J. C., Moseley M. L., Ranum L. P. W. and Day J. W. (2004). Insulin receptor splicing alteration in myotonic dystrophy type 2. Am. J. Hum. Genet. 74, 1309-1313. 10.1086/421528 [DOI] [PMC free article] [PubMed] [Google Scholar]
- Shcherbata H. R., Yatsenko A. S., Patterson L., Sood V. D., Nudel U., Yaffe D., Baker D. and Ruohola-Baker H. (2007). Dissecting muscle and neuronal disorders in a Drosophila model of muscular dystrophy. EMBO J. 26, 481-493. 10.1038/sj.emboj.7601503 [DOI] [PMC free article] [PubMed] [Google Scholar]
- Spletter M. L., Barz C., Yeroslaviz A., Schönbauer C., Ferreira I. R. S., Sarov M., Gerlach D., Stark A., Habermann B. H. and Schnorrer F. (2015). The RNA-binding protein Arrest (Bruno) regulates alternative splicing to enable myofibril maturation in Drosophila flight muscle. EMBO Rep. 16, 178-191. 10.15252/embr.201439791 [DOI] [PMC free article] [PubMed] [Google Scholar]
- Suenaga K., Lee K.-Y., Nakamori M., Tatsumi Y., Takahashi M. P., Fujimura H., Jinnai K., Yoshikawa H., Du H., Ares M. et al. (2012). Muscleblind-like 1 knockout mice reveal novel splicing defects in the myotonic dystrophy brain. PLoS ONE 7, e33218 10.1371/journal.pone.0033218 [DOI] [PMC free article] [PubMed] [Google Scholar]
- Suzuki H., Jin Y., Otani H., Yasuda K. and Inoue K. (2002). Regulation of alternative splicing of alpha-actinin transcript by Bruno-like proteins. Genes Cells Devoted Mol. Cell. Mech. 7, 133-141. 10.1046/j.1356-9597.2001.00506.x [DOI] [PubMed] [Google Scholar]
- Taneja K. L., McCurrach M., Schalling M., Housman D. and Singer R. H. (1995). Foci of trinucleotide repeat transcripts in nuclei of myotonic dystrophy cells and tissues. J. Cell Biol. 128, 995-1002. 10.1083/jcb.128.6.995 [DOI] [PMC free article] [PubMed] [Google Scholar]
- Thornell L.-E., Lindstöm M., Renault V., Klein A., Mouly V., Ansved T., Butler-Browne G. and Furling D. (2009). Satellite cell dysfunction contributes to the progressive muscle atrophy in myotonic dystrophy type 1. Neuropathol. Appl. Neurobiol. 35, 603-613. 10.1111/j.1365-2990.2009.01014.x [DOI] [PubMed] [Google Scholar]
- Timchenko N. A., Lu A. L., Welm X. and Timchenko L. T. (1999). CUG repeat binding protein (CUGBP1) interacts with the 5′ region of C/EBPbeta mRNA and regulates translation of C/EBPbeta isoforms. Nucleic Acids Res. 27, 4517-4525. 10.1093/nar/27.22.4517 [DOI] [PMC free article] [PubMed] [Google Scholar]
- Timchenko N. A., Patel R., Iakova P., Cai Z.-J., Quan L. and Timchenko L. T. (2004). Overexpression of CUG triplet repeat-binding protein, CUGBP1, in mice inhibits myogenesis. J. Biol. Chem. 279, 13129-13139. 10.1074/jbc.M312923200 [DOI] [PubMed] [Google Scholar]
- Tran H., Gourrier N., Lemercier-Neuillet C., Dhaenens C.-M., Vautrin A., Fernandez-Gomez F. J., Arandel L., Carpentier C., Obriot H., Eddarkaoui S. et al. (2011). Analysis of exonic regions involved in nuclear localization, splicing activity, and dimerization of Muscleblind-like-1 isoforms. J. Biol. Chem. 286, 16435-16446. 10.1074/jbc.M110.194928 [DOI] [PMC free article] [PubMed] [Google Scholar]
- Vihola A., Bachinski L. L., Sirito M., Olufemi S.-E., Hajibashi S., Baggerly K. A., Raheem O., Haapasalo H., Suominen T., Holmlund-Hampf J. et al. (2010). Differences in aberrant expression and splicing of sarcomeric proteins in the myotonic dystrophies DM1 and DM2. Acta Neuropathol. 119, 465-479. 10.1007/s00401-010-0637-6 [DOI] [PMC free article] [PubMed] [Google Scholar]
- Vlasova I. A. and Bohjanen P. R. (2008). Posttranscriptional regulation of gene networks by GU-rich elements and CELF proteins. RNA Biol. 5, 201-207. 10.4161/rna.7056 [DOI] [PMC free article] [PubMed] [Google Scholar]
- Vlasova-St Louis I., Dickson A. M., Bohjanen P. R. and Wilusz C. J. (2013). CELFish ways to modulate mRNA decay. Biochim. Biophys. Acta 1829, 695-707. 10.1016/j.bbagrm.2013.01.001 [DOI] [PMC free article] [PubMed] [Google Scholar]
- Wang G.-S., Kearney D. L., De Biasi M., Taffet G. and Cooper T. A. (2007). Elevation of RNA-binding protein CUGBP1 is an early event in an inducible heart-specific mouse model of myotonic dystrophy. J. Clin. Invest. 117, 2802-2811. 10.1172/JCI32308 [DOI] [PMC free article] [PubMed] [Google Scholar]
- Wang E. T., Ward A. J., Cherone J. M., Giudice J., Wang T. T., Treacy D. J., Lambert N. J., Freese P., Saxena T., Cooper T. A. et al. (2015). Antagonistic regulation of mRNA expression and splicing by CELF and MBNL proteins. Genome Res. 25, 858-871. 10.1101/gr.184390.114 [DOI] [PMC free article] [PubMed] [Google Scholar]
- Ward A. J., Rimer M., Killian J. M., Dowling J. J. and Cooper T. A. (2010). CUGBP1 overexpression in mouse skeletal muscle reproduces features of myotonic dystrophy type 1. Hum. Mol. Genet. 19, 3614-3622. 10.1093/hmg/ddq277 [DOI] [PMC free article] [PubMed] [Google Scholar]
- Whitman S. A., Cover C., Yu L., Nelson D. L., Zarnescu D. C. and Gregorio C. C. (2011). Desmoplakin and talin2 are novel mRNA targets of fragile X-related protein-1 in cardiac muscle. Circ. Res. 109, 262-271. 10.1161/CIRCRESAHA.111.244244 [DOI] [PMC free article] [PubMed] [Google Scholar]
- Yadava R. S., Frenzel-McCardell C. D., Yu Q., Srinivasan V., Tucker A. L., Puymirat J., Thornton C. A., Prall O. W., Harvey R. P. and Mahadevan M. S. (2008). RNA toxicity in myotonic muscular dystrophy induces NKX2-5 expression. Nat. Genet. 40, 61-68. 10.1038/ng.2007.28 [DOI] [PMC free article] [PubMed] [Google Scholar]
- Yamashita Y., Matsuura T., Shinmi J., Amakusa Y., Masuda A., Ito M., Kinoshita M., Furuya H., Abe K., Ibi T. et al. (2012). Four parameters increase the sensitivity and specificity of the exon array analysis and disclose 25 novel aberrantly spliced exons in myotonic dystrophy. J. Hum. Genet. 57, 368-374. 10.1038/jhg.2012.37 [DOI] [PubMed] [Google Scholar]
- Yu Z., Teng X. and Bonini N. M. (2011). Triplet repeat–derived siRNAs enhance RNA–mediated toxicity in a Drosophila model for myotonic dystrophy. PLoS Genet. 7, e1001340 10.1371/journal.pgen.1001340 [DOI] [PMC free article] [PubMed] [Google Scholar]
- Yu T.-X., Rao J. N., Zou T., Liu L., Xiao L., Ouyang M., Cao S., Gorospe M. and Wang J.-Y. (2013). Competitive binding of CUGBP1 and HuR to occludin mRNA controls its translation and modulates epithelial barrier function. Mol. Biol. Cell 24, 85-99. 10.1091/mbc.E12-07-0531 [DOI] [PMC free article] [PubMed] [Google Scholar]
- Yu T.-X., Gu B.-L., Yan J.-K., Zhu J., Yan W.-H., Chen J., Qian L.-X. and Cai W. (2016). CUGBP1 and HuR regulate E-cadherin translation by altering recruitment of E-cadherin mRNA to processing bodies and modulate epithelial barrier function. Am. J. Physiol. Cell Physiol. 310, C54-C65. 10.1152/ajpcell.00112.2015 [DOI] [PubMed] [Google Scholar]
- Zarnescu D. C. and Gregorio C. C. (2013). Fragile hearts: new insights into translational control in cardiac muscle. Trends Cardiovasc. Med. 23, 275-281. 10.1016/j.tcm.2013.03.003 [DOI] [PMC free article] [PubMed] [Google Scholar]
Associated Data
This section collects any data citations, data availability statements, or supplementary materials included in this article.