Abstract
For modern plate steels exhibiting high toughness and ductility, the conventional Charpy test is ostensibly stretched beyond its limits of applicability. Impact tests yield absorbed energy values in excess of 300–400 J, which are associated with limited material fracture and mostly derive from plastic deformation of the specimen (bending), friction, and vibrations of the swinging hammer. It would be therefore very desirable to measure the actual fracture toughness of very-high-toughness steels by means of an alternative specimen and/or methodology, entailing just a moderate increase of cost and test complexity with respect to Charpy testing. The investigation presented here was aimed at establishing a reasonable, yet cost-effective test procedure utilizing Charpy-type specimens for measuring the dynamic toughness of high-toughness steels, such as line pipe steels. Promising results have been obtained from notches cut by electrical-discharge machining (EDM) using a thin wire of 0.1 mm diameter, as compared to specimens where an actual crack was generated and propagated by fatigue at the root of the machined notch.
Introduction
Plate steels with very high Charpy absorbed energy are becoming common. For example, pipeline steels with Charpy upper-shelf energy (USE) values in the 300–400 J range are produced today in large tonnages. Empirical correlations between USE and fracture toughness (KIc, JIc, crack-resistance curves), as well as USE comparisons with lower-toughness steels, tend to ignore the fact that specimens from these very-high-toughness steels do not fracture completely during a Charpy test [1]. The specimen undergoes severe plastic deformation and relatively limited ductile fracture, and is ejected from the impact machine as soon as bending is large enough for the sample to be pushed through the anvils by the swinging hammer. In particular, when recorded absorbed energy values are larger than 400 J, hardly any fracture is observed, and the specimen is subjected to severe plastic deformation, accompanied by large amounts of anvil/specimen friction and hammer vibrations. Under such conditions, the Charpy test becomes a dynamic bend test, causing significant wear to the machine (anvils and striker). Indeed, ASTM E23-16c [2] itself recognizes that broken (fully fractured) and unbroken (partially fractured) specimens may not provide the same information. The absorbed energy value returned by the machine encoder is not meaningful, since it does not provide a measure of the energy required to fracture/break the specimen, but just to deform/bend it until it slips through the anvils. If the specimen is not actually fractured at the end of the impact test, legitimate questions can be raised about the meaning of the test result and the applicability of the test itself. In other words, for modern very-high-toughness steels, it can be rightfully contended that the conventional Charpy test is pushed beyond its applicability limits.
On the other hand, any Charpy test, regardless of the toughness level of the material being tested, always features absorbed energy contributions due to deformation, bending, friction, etc., even in steels with comparatively lower toughness. It can therefore be debated whether full or partial fracture of the specimen is the critical distinction, or whether other factors should be given equal importance.
In recent years, the National Institute of Standards and Technology (NIST) has been investigating reasonable alternatives to the Charpy test for steels that exhibit high absorbed energy and do not fully fracture when impact tested. Such alternatives should allow characterization of the impact toughness of very-high-toughness steels in a rigorous, yet cost-effective way. The increase in complexity and cost with respect to the conventional Charpy test should be kept within reasonable limits.
This paper reports progress achieved to date in investigating the measurement of dynamic and quasi-static fracture toughness of high-toughness steels by means of specimens in which the conventional machined Charpy notch (root radius ρ =0.25 mm) is replaced by much sharper notches (ρ ≤ 0.1 mm) and actual fracture mechanics parameters are calculated. The method is currently standardized (just for fatigue-precracked specimens) in Annex A17 of ASTM E1820-17 [3], and seldom leads to measuring size-insensitive material’s properties, due to the small size of the specimens. However, the values obtained can be used in research and development of materials, in quality control and service evaluation, and to establish the relative variation of properties with test temperature and loading rate.
Materials Investigated
The investigation reported in this paper used Charpy-type specimens of two high-toughness steels, T200 (18Ni) maraging steel and X65 (line pipe steel of recent generation). For both steels, conventional Charpy tests conducted at room temperature do not result in full fracture of the specimen, even though the absorbed energy levels are significantly different (around 200 J for T200, between 300 J and 400 J for X65).
The 18Ni maraging steel denoted T200 has been used by NIST for the production of super high-energy reference specimens for the indirect verification of Charpy machines in accordance with ASTM E23 [4]. It combines very good mechanical properties (high tensile strength, toughness, and ductility) with excellent workability and heat treatment characteristics [5]. The X65 steel (API2 5 L Seamless Line Pipe, X65 Grade) is used for seamless and welded steel line pipes for pipeline transportation systems in the petroleum and natural gas industries [6]. The nominal chemical compositions of the two steels are provided in Table 1.
Table 1.
Chemical composition of the steels (wt %)
| Steel | C | Mn | Si | S | P | Ni | Cr | Mo | Nb +Ti +V |
|---|---|---|---|---|---|---|---|---|---|
| T200 | ≤0.01 | ≤0.01 | ≤0.01 | ≤0.01 | ≤0.01 | 18.5 | n/a | 3.0 | n/a |
| X65 | 0.05 | 1.42 | 0.28 | 0.003 | 0.011 | 0.05 | 0.04 | 0.01 | 0.051 |
Specimen Types and Notch Configurations
In the current investigation, both standard (full-size) Charpy specimens (CVN), designated as V-notch in ASTM E23-16b (thickness and width =10 mm, length =55 mm), and miniaturized specimens of the KLST3 type, were considered. The latter specimens are covered by ISO 14556:2015, Annex 4 [7] and ASTM E2248-15 [8], and have the following nominal dimensions: thickness =3 mm, width =4 mm, length =27 mm, notch depth = 1 mm.
The standard notch configurations for full-size and miniaturized Charpy specimens are the following:
CVN specimens: angle =45 deg, root radius ρ =0.25 mm;
KLST specimens: angle =60 deg, root radius ρ =0.1 mm.
Our study investigated the following alternative notch configurations:
PCVN, PKLST: actual crack, obtained by initiating and propagating a fatigue crack at the root of the Charpy notch by means of three-point-bend cycling;
CVN-S, KLST-S: narrow slit, electrical-discharge machining (EDM) cut by means of a wire with diameter ≈ 0.1 mm; the slit was cut either from the bottom of the existing Charpy notch (T200) or from the surface of the specimen (X65);
CVN-SC: rough mechanical cut produced at the bottom of the existing Charpy notch by means of a thin saw (blade thickness ≈ 0.3 mm).
In all cases, the target value for the ratio between crack/slit size (a) and specimen width (W) was a/W ≈ 0.45–0.5, which is the standard for fracture toughness testing.
An additional parameter that was considered for full-size specimens was the presence of side grooves (total depth =20% of the original thickness). The advantage of side-grooving fracture toughness specimens, particularly when ductile behavior is expected, is twofold:
side grooves enhance stress triaxiality and crack-tip constraint, thereby facilitating plane-strain fracture [9];
side grooves also promote more uniform crack growth during testing, thereby counteracting the effects of crack tunneling4 [10], which tend to artificially increase the measured fracture toughness.
Side-grooving was only employed for full-size specimens (PCVN, CVN-S, CVN-SC). KLST-type specimens were only tested in plane-sided condition (without side grooves).
Experimental Setup and Test Procedures
All tests in this study were performed either at impact loading rates (hammer speed ≈ 1 m/s) or at quasi-static loading rates (machine actuator displacement rate =0.1 mm/s), using a three-point bending loading configuration.
For tests at impact loading rates, the provisions of ASTM E1820-17, Annex A17, and ISO 26843:2015 [11] for the measurements of dynamic fracture toughness were followed. In the case of quasi-static loading, testing and analysis were conducted in accordance with ASTM E1820-17 (basic procedure). All calculated values of the J-integral were crack growth corrected according to the provisions of ASTM E1820-17, Annex A16 [12].
Irrespective of the loading rate, the J–R (crack-resistance) curve and the critical J-integral value (JQ) were determined for every data set by means of the so-called multiple-specimen approach, wherein varying amounts of crack growth (Δa) are generated by loading each specimen up a different value of deflection. The final amount of deflection (or specimen bending angle) depends on the potential energy of the impact hammer, obtained by varying the fall angle/height of the hammer. The J–R curve is obtained by fit-ting individual (J, Δa) data points with a power-law regression curve according to Annex A8 of ASTM E1820-17. JQ was calculated from each J–R curve in accordance with the provisions of ASTM E1820-17, Annex A9.
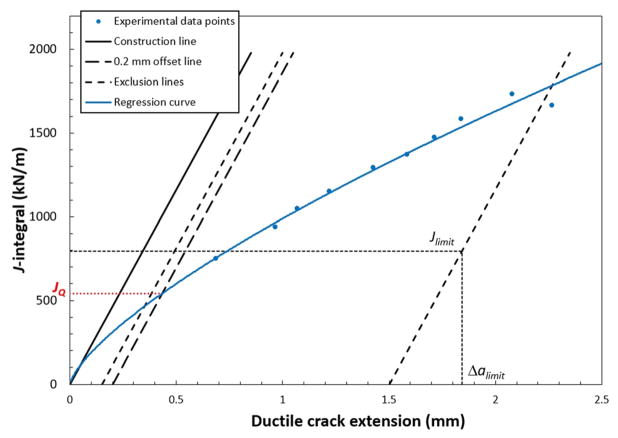
Tests at impact loading rates on PCVN, CVN-S, and CVN-SC specimens were performed on a Charpy machine with 953.6 J capacity, equipped with an instrumented striker with 8 mm radius of the striking edge. The falling angle of the hammer was adjusted for every test in order to produce the desired amount of crack extension (Δa), without completely fracturing the specimen. Actual impact speeds ranged between 0.3 m/s and 1.3 m/s, depending on material, desired Δa and plane-sided versus side-grooved specimen. The corresponding value of the J-integral was calculated from the instrumented force-deflection test record, while the amount of crack extension was measured on the fracture surface after heat tinting the specimens at 300 °C for 1 h and then breaking them open in liquid nitrogen. This experimental procedure is commonly known as low-blow testing [13]. An example of J–R curve and corresponding JQ value is shown in Fig. 1 for impact-tested and side-grooved PCVN specimens of T200.
Fig. 1.
J–R curve and JQ for impact-tested PCVN specimens of T200 (for definitions of Jlimit and Δalimit, see ASTM E1820-15a, Annex A9)
Miniaturized, KLST-type specimens were tested on a small-scale Charpy machine with capacity of 50 J, equipped with an instrumented striker with 2 mm radius of the striking edge. Experimental and analytical procedures to obtain crack-resistance curves and critical J-integral values were the same as for full-size specimens.
Testing at quasi-static loading rates was conducted only on two types of full-size specimens (PCVN and CVN-S). A servohydraulic machine, equipped with a calibrated load cell, was employed, and each test was stopped at a different specimen deflection value in order to obtain variable amounts of ductile crack propagation. Experimental procedures and calculation steps were analogous to those employed at impact loading rates.
All testing was conducted at room temperature (21±1 °C). The complete test matrix is presented in Table 2.
Table 2.
Complete test matrix for this study
| Steel | Specimen type | Side-grooved? | Loading rate | Number of tests performed | ||
|---|---|---|---|---|---|---|
|
| ||||||
| EDM slit | Fatigue precrack | Saw-cut | ||||
| T200 | CVN | Yes | Impact | 10 | 10 | 5 |
| Quasi-static | 5 | 5 | — | |||
| No | Impact | — | 4 | 4 | ||
| KLST | No | 5 | 5 | — | ||
| X65 | CVN | Yes | Impact | 10 | 10 | — |
| Quasi-static | 5 | 5 | — | |||
| KLST | No | Impact | 5 | 5 | — | |
Test Results
Critical J-Integral Values at Initiation (JQ)
JQ represents an engineering approximation of the material’s toughness at crack initiation, and is calculated at the intersection of the J–R curve (power-law fitting curve) with a construction line whose slope depends on the flow strength (average of yield and tensile strengths) of the material, see Fig. 1. Provided several validity requirements are fulfilled (see ASTM 1820-15a, Sec. 9.1 and Annex A9), JQ can be qualified as JIc, the material’s size-independent plane-strain fracture toughness. In the case of Charpy-type specimens (full-size or miniaturized), specimen dimensions are generally too small to allow measuring the fracture toughness of the steel, and critical values JQ should be considered size-dependent.
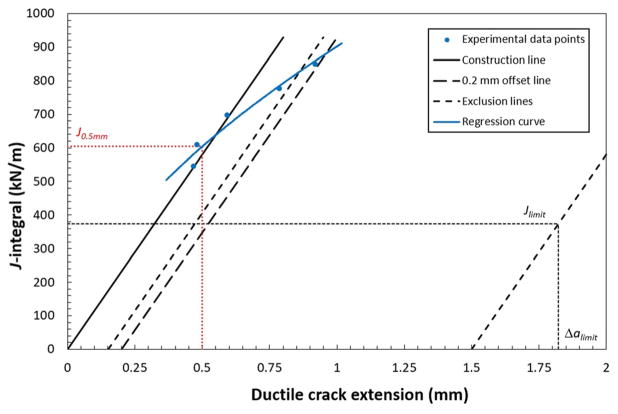
The values of JQ measured on the different data sets are listed in Table 3. The effect of notch configuration can be assessed by comparing values on the same row (horizontal direction), while the influence of other factors, such as loading rate, presence of side grooves, and specimen type/size, can be appreciated by moving down a specific column (vertical direction). Note that JQ for most X65 data sets could not be measured, because the experimental data points fell on the left side of the construction line, see an example in Fig. 2. Alternatively, and for the sake of comparison, the value of J-integral at 0.5 mm of crack extension was calculated from the J–R curve (J0.5 mm, see Fig. 2). These values are shown in parentheses in Table 3.
Table 3.
Values of critical J-integral (JQ or J0.5 mm) obtained from the different data sets (NM = not measurable; values in parentheses correspond to J0.5 mm)
| Steel | Specimen type | Side-grooved? | Loading rate | EDM slit | JQ (kN/m) | |
|---|---|---|---|---|---|---|
|
| ||||||
| Fatigue precrack | Saw-cut | |||||
| T200 | CVN | Yes | Impact | 593.5 | 540.4 | 816.2 |
| Quasi-static | 473.4 | 573.2 | — | |||
| No | Impact | — | 1032.8 | 1213.8 | ||
| KLST | No | 704.7 | 625.3 | — | ||
| X65 | CVN | Yes | Impact | 1163.9 | 1144.3 | — |
| Quasi-static | NM (496.4) | NM (604.1) | — | |||
| KLST | No | Impact | NM (711.9) | NM (691.4) | — | |
Fig. 2.
Results obtained from quasi-static tests on PCVN specimens of X65, which do not allow calculating JQ per ASTM E1820-15a. J0.5 mm is calculated instead.
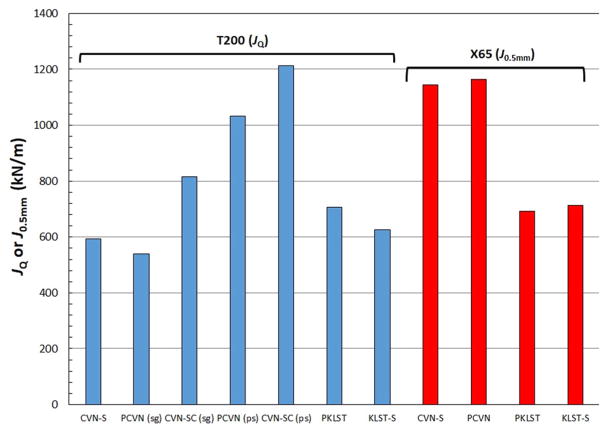
The results obtained from impact toughness tests are illustrated in Fig. 3 for different specimen types and notch configurations.
Fig. 3.
Critical fracture toughness values obtained at impact loading rates on T200 and X65. Note: sg =side-grooved; ps =plane-sided.
It can be observed that the effect of notch configuration (fatigue precrack versus EDM slit) appears relatively small for both steels. Assuming that fatigue-precracked specimens yield the “correct” dynamic fracture toughness, the difference in terms of JQ is 9.8% (CVN) or 12.7% (KLST) for T200, and just 1.7% (CVN) or 3.0% (KLST) for X65. Another effect that can be remarked from Table 3 and Fig. 3 is that plane-sided specimens exhibit much higher initiation toughness than side-grooved samples, in agreement with past investigations [9] and with the previously mentioned role of side-grooving in enhancing crack tip stress triaxiality. For T200, decreasing specimen size causes a decrease of crack tip constraint and a transition from plane-strain to plane-stress conditions, which explains the higher values of JQ measured from miniaturized specimens.
As far as quasi-static tests are concerned, data in Table 3 indicate that the effect of notch configuration is more pronounced than under impact conditions: 17.4% for T200 and 17.8% for X65. Interestingly, the expected effect of notch acuity (lower fracture toughness is expected for sharper notches [9,14]) appears reversed in this case for both steels. However, the calculated differences are on the order of 20%, which is on the order of the typical scatter band for JIc results [15]. This effect will therefore need to be clarified in further investigations.
Tearing Moduli and J–R (Crack-Resistance) Curves
Although the resistance to crack propagation is normally not expressed by a numerical parameter but by a regression curve (the J–R curve), the material’s tearing modulus Tm is sometimes used as a quantitative property related to crack propagation resistance. According to the original definition of Paris et al. [16], the tearing modulus is given by
| (1) |
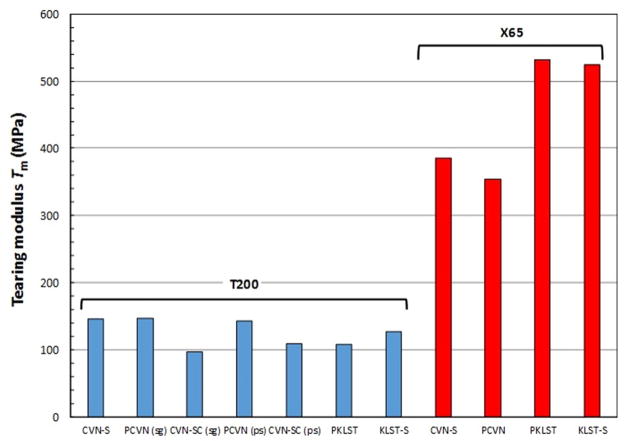
where E is Young’s modulus and σY is the flow strength. Tm is here defined as the normalized slope of the J–R curve at crack initiation (i.e., the derivative is calculated at the point corresponding to JQ), and is therefore higher as crack resistance increases. Values of tearing modulus for the different data sets investigated are presented in Table 4 (all tests) and Fig. 4 (only impact tests); Tm is calculated at Δa =0.5 mm for X65 under quasi-static conditions and for KLST-type specimens (values in parentheses in the table).
Table 4.
Values of tearing modulus (Tm) obtained from the different data sets (NM = not measurable at JQ; values in parentheses are calculated at Δa = 0.5 mm)
| Steel | Specimen type | Side-grooved? | Loading rate | Tm (MPa) | ||
|---|---|---|---|---|---|---|
|
| ||||||
| EDM slit | Fatigue precrack | Saw-cut | ||||
| T200 | CVN | Yes | Impact | 146.5 | 146.6 | 97.9 |
| Quasi-static | 129.4 | 121.4 | — | |||
| No | Impact | — | 143.4 | 109.4 | ||
| KLST | No | 127.3 | 108.4 | — | ||
| X65 | CVN | Yes | Impact | 385.8 | 354.9 | — |
| Quasi-static | NM (990.1) | NM (324.9) | — | |||
| KLST | No | Impact | NM (524.5) | NM (532.0) | — | |
Fig. 4.
Values of tearing modulus obtained at impact loading rates on T200 and X65. Note: sg =side-grooved; ps =plane-sided.
Besides the clearly larger tearing resistance of X65 with respect to T200, Fig. 4 indicates that notch configuration has limited influence on tearing modulus for the same specimen type (full-size or miniaturized). This also applies to quasi-static tests on T200 specimens, whereas the large difference for X65 (324.9 MPa for PCVN versus 990.1 MPa for CVN-S) seems to derive from the fact that no tests with crack extension larger than 1 mm are available, and therefore the J–R curve might appear much steeper than it actually is. This should be verified through additional testing.
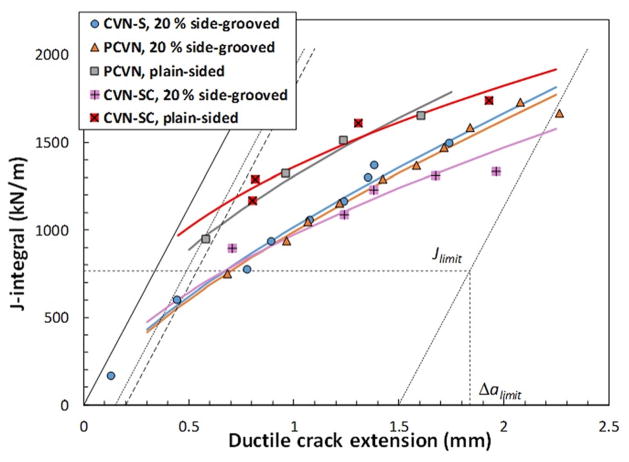
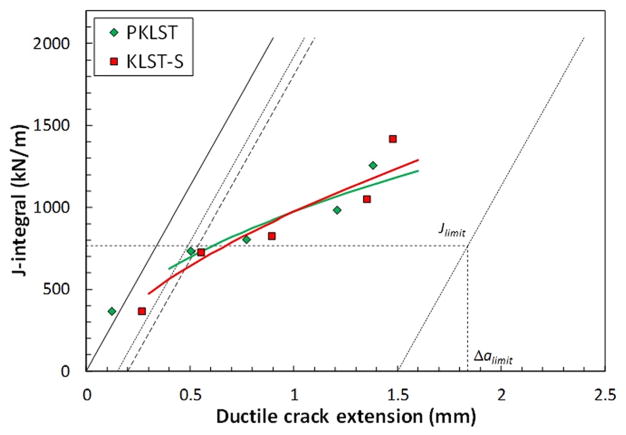
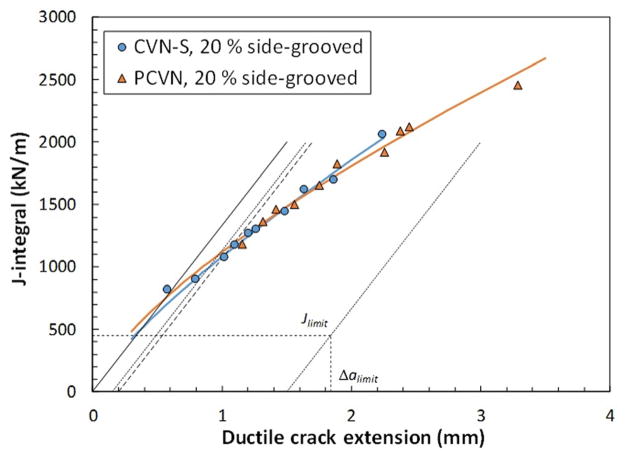
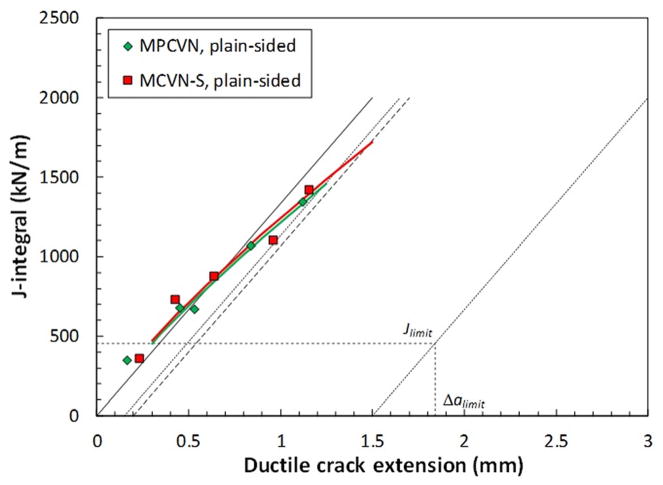
In terms of comparison of actual J–R curves, the results obtained for impact loading rates are shown in:
Figure 5: T200, plane-sided and side-grooved full-size specimens (PCVN, CVN-S, CVN-SC);
Figure 6: T200, plane-sided miniaturized specimens (PKLST, KLST-S);
Figure 7: X65, side-grooved full-size specimens (PCVN, CVN-S);
Figure 8: X65, plane-sided miniaturized specimens (PKLST, KLST-S).
Fig. 5.
Dynamic J–R curves obtained from full-size specimens of T200
Fig. 6.
Dynamic J–R curves obtained from miniaturized specimens of T200
Fig. 7.
Dynamic J–R curves obtained from full-size specimens of X65
Fig. 8.
Dynamic J–R curves obtained from miniaturized specimens of X65
The J–R curves shown in Figs. 5–8 indicate that notch configuration has only a moderate effect on the resistance to dynamic crack propagation, particularly for the much tougher line pipe steel X65. For T200, even specimens with saw-cut notches exhibit comparable properties up to 1 mm of ductile crack propagation.
A significant influence of specimen side-grooving can be observed in Fig. 5 for T200. The presence of side grooves clearly increases crack-tip constraint and facilitates both crack initiation and propagation, thus resulting in lower fracture resistance. Moreover, specimens with fatigue precracks and saw-cut notches show similar behavior.
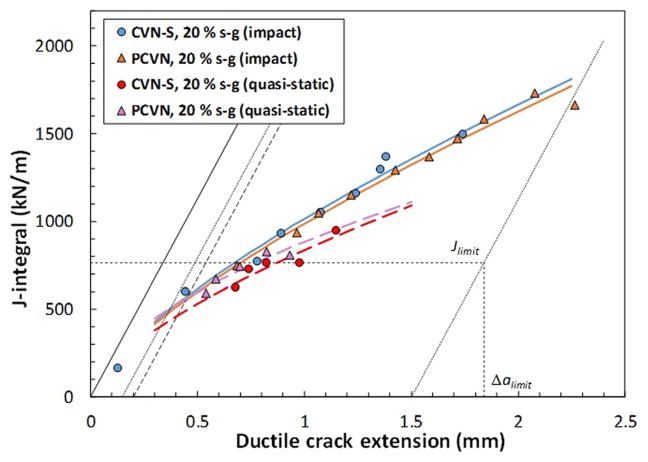
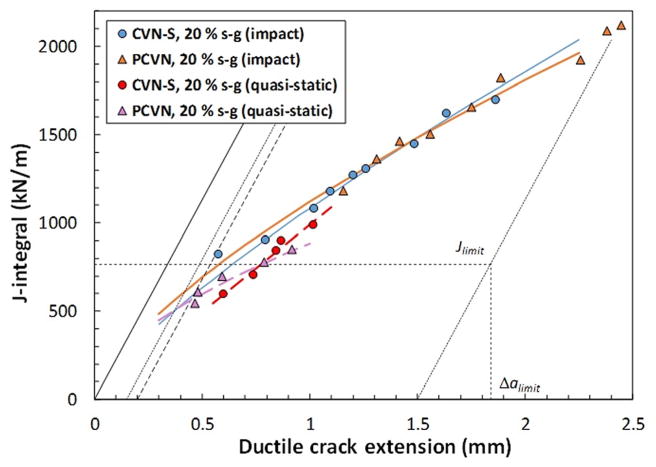
Finally, the effect of loading rate can be appreciated in Figs. 9 and 10 for T200 and X65, respectively. As published by other authors [9,17,18], increasing the loading rate induces an increase in fracture toughness. However, for both investigated steels, the increase appears moderate.
Fig. 9.
Effect of loading rate on T200 J–R curves
Fig. 10.
Effect of loading rate on X65 J–R curves
Discussion: Effect of Notch Acuity
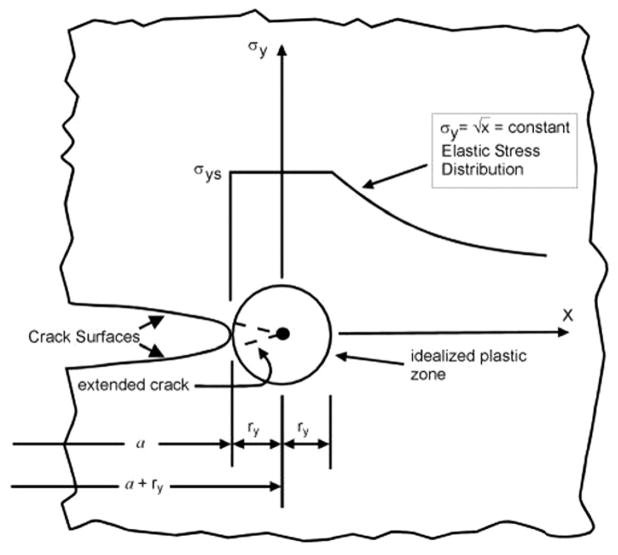
The relative insensitivity of ductile fracture toughness (initiation toughness and crack-resistance curve) to notch acuity/sharpness had already been investigated, among others, by Jolley et al. in 1973 [14]. This was confirmed by our investigation for two high-toughness steels that do not fully break when impact tested at room temperature. The most likely explanation for this effect (or lack thereof) lies in a phenomenon that occurs in the presence of a defect, just before the initiation and propagation of ductile fracture: crack-tip blunting. In a ductile material containing a crack-like defect, the first effect of the application of an external force is the rounding of the crack tip as a result of plastic deformation. The size of the plastic zone ahead of the crack tip is between ry and 2ry, where ry, the radius of the plastic zone per Irwin [19], is:
| (2) |
where K is the material’s toughness (expressed in terms of stress-intensity factor) and σys is the material’s yield strength. Figure 11 [19] shows a schematic of the plastic zone and the stresses ahead of the crack tip; the tip is blunted because of plastic deformation. According to Eq. (2), the tougher the material (i.e., the higher the ratio ), the larger the plastic zone and, as a consequence, crack tip blunting before initiation of ductile tearing becomes more pronounced.
Fig. 11.
Small-scale yield model for restricted crack-tip plastic deformation [19]
According to a simplified model used by ASTM E1820-17, the relationship between J-integral and apparent increase of crack size (Δabl) during blunting can be expressed as:
| (3) |
Equation (3) describes what is currently called “construction line,” but used to be called “blunting line” in early versions of E1820 and its predecessors (such as ASTM E813). According to Eq. (3), the total apparent crack size increase at the end of crack-tip blunting and just before initiation of ductile tearing (SZW) is:
| (4) |
where SZW stands for stretch zone width [20–22] and Ji is the J-integral at initiation. Based on the results obtained from side-grooved PCVN and CVN-S specimens, the magnitude of SZW at room temperature from dynamic tests is of the order of 0.05–0.07 mm for T200 and 0.43–0.5 mm for X65.5 From Fig. 11, the separation of the crack faces (crack-tip opening displacement) at initiation is twice SZW, and therefore about 0.12 mm for T200 and 0.9 mm for X65.
At these pre-initiation toughness levels, the influence of the actual sharpness of the original crack at the time of force application, between a fatigue crack with root radius ρ ≈ 0 or an EDM slit with ρ ≈ 0.1 mm, is not expected to be significant. In the case of more brittle materials, where the plastic zone radius ahead of the crack tip is on the order of a few micrometers (assuming for example Ji ≈ 50 kN/m), the acuity of the initial defect should play a much bigger role. This will be one of the aims of a follow-up investigation, in which additional steels with low (JQ ≤ 100 kN/m) and intermediate (JQ ≈ 200–300 kN/m) fracture toughness properties will be investigated.
Conclusions
The actual significance and reliability of Charpy testing on very-high-toughness steels, when the specimen does not fully break and in some cases very limited fracture is observed, is questionable. It can be thus contended that the Charpy test is inadequate as a means of characterizing the impact toughness of such steels, and alternative specimens and/or methodologies have to be used. The use of specimens containing actual fatigue cracks instead of machined notches allows characterizing the initiation and the propagation of stable tearing, and therefore measuring actual fracture toughness. However, fatigue precracking and testing a conventional fracture toughness specimen can easily scale up the complexity and cost of laboratory investigations, with respect to the relatively cheap and straightforward Charpy test.
The investigation conducted at NIST has shown that for two high-toughness steels (T200 and X65), the use of an EDM slit cut with a 0.1 mm diameter wire, instead of a fatigue precrack, does not significantly affect the measurement of ductile fracture toughness properties (critical J-integral at initiation and crack-resistance curve). If confirmed on additional high-toughness materials, particularly line pipe steels, this finding suggests that testing EDM-notched Charpy-type specimens can be a cost-effective way to characterize the upper shelf fracture toughness at both quasi-static (slow) and dynamic (impact) loading rates. Preliminary results seem to indicate that even notches obtained by means of a thin hand saw (blade thickness ≈ 0.3 mm) provide acceptable results. Moreover, the comparison between plane-sided and side-grooved specimens has shown that side-grooving has a much larger effect on toughness measurements than notch acuity, and the use of side grooves is recommended to avoid overestimating a material’s toughness.
The methodology used in this study is the multispecimen approach, wherein several specimens are tested up to varying amounts of crack extension to generate the J–R curve. This methodology is standardized in ASTM E1820-17, A17.7 for fatigue-precracked Charpy-type specimens; however, the use of sharp (EDM)-notched Charpy-type specimens is the novel aspect of this investigation. For quasi-static testing, the use of various single-specimen techniques (elastic compliance, electric potential drop, and normalization method) can also be envisaged, allowing a more effective use of available material.
More testing on high-toughness materials is planned in the near future, to confirm and consolidate the promising results obtained.
Nomenclature
- a
crack or slit size (length) (mm)
- E
Young’s modulus (MPa)
- Ji
value of J-integral at the physical initiation of stable crack extension (kN/m)
- JIc
plane-strain fracture toughness, corresponding to the initiation of stable fracture—see ASTM E1820-17 (kN/m)
- JQ
value of J-integral corresponding to the engineering approximation of stable crack extension—a provisional value of JIc (kN/m)
- J0.5 mm
value of J-integral corresponding to 0.5 mm of stable crack extension (kN/m)
- J–R curve
crack-resistance curve (J-integral versus crack extension)
- K
material’s fracture toughness, expressed in terms of stress-intensity factor (MPa√m)
- KIc
plane-strain fracture toughness, corresponding to the initiation of unstable fracture—see ASTM E399-12ε3 (MPa√m)
- ry
radius of the plastic zone ahead of the crack tip (mm)
- SZW
total apparent crack extension at the end of crack-tip blunting, just before initiation of ductile tearing (mm)
- Tm
tearing modulus, corresponding to the material’s resistance to crack propagation measured in JQ (MPa)
- USE
upper shelf energy (from Charpy tests) (J)
- W
specimen width (mm)
- Δa
crack extension, or increase in crack size (mm)
- ΔaBL
apparent crack extension due to crack-tip blunting (mm)
- ρ
root radius of the machined notch (mm)
- σY
flow strength, corresponding to the average of yield and tensile strengths (MPa)
- σys
yield strength (MPa)
Abbreviations
- CVN
Charpy V-notch specimen
- CVN-S
Charpy V-notch specimen with narrow slit machined by EDM
- CVN-SC
Charpy V-notch specimen with narrow slit obtained by means of a thin saw
- EDM
electro discharge machining
- KLST
miniaturized Charpy V-notch specimen
- P-KLST
miniaturized Charpy V-notch specimen with narrow slit machined by EDM
- PCVN
fatigue-precracked Charpy V-notch specimen
- PKLST
fatigue-precracked miniaturized Charpy V-notch specimen
Footnotes
API =American Petroleum Institute.
The acronym KLST corresponds to the German word “Kleinstprobe,” or “small specimen.” This was the original denomination of this specimen in the German DIN 50 115 standard (April 1991).
Crack tunneling typically occurs in plane-sided (nonside-grooved) specimens, where crack growth occurs mostly in the mid-thickness portion of the crack front, while it is significantly retarded in the proximity of the specimen’s lateral surfaces.
Note that the construction line for T200 is approximately twice as steep as for X65, because its dynamic flow strength is approximately double.
Contributed by the Pressure Vessel and Piping Division of ASME for publication in the Journal of Pressure Vessel Technology. Manuscript received August 8, 2017; final manuscript received November 22, 2017; published online January 24, 2018. Assoc. Editor: Steve J. Hensel.
The United States Government retains, and by accepting the article for publication, the publisher acknowledges that the United States Government retains, a nonexclusive, paid-up, irrevocable, worldwide license to publish or reproduce the published form of this work, or allow others to do so, for United States government purposes.
References
- 1.McCowan CN, Lucon E, Santoyo RL. Evaluation of the Energy Absorbed in Charpy Tests at 100 J Versus 300 J. International Symposium on the Recent Developments in Plate Steels; Winter Park, CO. June 19–22.2011. [Google Scholar]
- 2.ASTM. Standard Test Methods for Notched Bar Impact Testing of Metallic Materials. ASTM International; West Conshohocken, PA: 2016. Standard No. ASTM E23–16b. [Google Scholar]
- 3.ASTM. Standard Test Method for Measurement of Fracture Toughness. ASTM International; West Conshohocken, PA: 2017. Standard No. ASTM E1820–17. [Google Scholar]
- 4.McCowan CN, Siewert TA, Vigliotti DP. Materials Reliability Series. National Institute of Standards and Technology; Boulder, CO: 2003. Charpy Verifica-tion Program: Reports Covering 1989–2002. NIST Technical Note No. 1500-9. [Google Scholar]
- 5.Service Steel Aerospace. Maraging—Data Sheet. Service Steel Aerospace Corp; Seattle, WA: 2016. [accessed Jan 30, 2017]. http://www.ssa-corp.com/documents/Data%20Sheet%20Maraging.pdf. [Google Scholar]
- 6.API. API Specification 5 L, Specification for Line Pipe. 45. American Petroleum Institute; Washington, DC: 2012. [Google Scholar]
- 7.ISO. Steel—Charpy V-Notch Pendulum Impact Test—Instrumented Test Method. International Standards Organization; Geneva, Switzerland: 2015. Standard No. ISO 14556. [Google Scholar]
- 8.ASTM. Standard Test Method for Impact Testing of Miniaturized Charpy V-Notch Specimens. ASTM International; West Conshohocken, PA: 2015. Standard No. ASTM E2248–15. [Google Scholar]
- 9.Smith E, Patchett BM. Effects of Notch Acuity and Side Grooving on Fracture Toughness—Part II: Slow Bend. Weld Res Suppl. 1975:226s–233s. [Google Scholar]
- 10.Zuo J, Deng X, Sutton MA, Cheng C-S. Crack Tunneling: Effect of Stress Constraint. 2004 ASME Paper No. IMECE2004-60700. [Google Scholar]
- 11.ISO. Metallic Materials—Measurement of Fracture Toughness at Impact Loading Rates Using Precracked Charpy-Type Test Pieces. International Standards Organization; Geneva, Switzerland: 2015. Standard No. ISO 26843. [Google Scholar]
- 12.Wallin K, Laukkanen A. Improved Crack Growth Corrections for J-R Curve Testing. Eng Fract Mech. 2004;71(11):1601–1614. [Google Scholar]
- 13.Server WL, Ireland DR. Nonstandard Test Techniques Utilizing the Instrumented Charpy and Izod Tests. American Society for Testing and Materials; Philadelphia PA: 1974. Standard No. ASTM STP 563. [Google Scholar]
- 14.Jolley G, Kilpatrick IM, Main R. Effect of Notch Acuity on the Fracture Toughness of Three Low Alloy High Yield Strength Steels. Weld Res Suppl. 1973:543s–548s. [Google Scholar]
- 15.Clarke GA, Landes JD, Begley JA. Results of an ASTM Cooperative Test Program on the JIc Determination of HY130 Steel. J Test Eval. 1980;8(5):221–232. [Google Scholar]
- 16.Paris PC, Tada H, Zahoor A, Ernst H. A Treatment of the Subject of Tearing Instability. U.S. Nuclear Regulatory Commission; Washington, DC: 1977. Report No. NUREG-0311. [Google Scholar]
- 17.Li C-J. Effects of Temperature and Loading Rate on Fracture Toughness of Structural Steels. Mater Des. 1999;21(1):27–30. [Google Scholar]
- 18.Wiesner CS, MacGillivray H. Loading Rate Effects on Tensile Properties and Fracture Toughness of Steel. TAGSI Seminar on Fracture, Plastic Flow and Structural Integrity; Cambridge, UK. Apr. 29.1999. [Google Scholar]
- 19.Irwin GR. Fracturing of Metals. American Society for Metals; Cleveland, OH: 1948. Fracture Dynamics. [Google Scholar]
- 20.Miedlar PC, Berens AP, Gunderson A, Gallagher JP. USAF Damage Tolerant Design Handbook: Guidelines for the Analysis and Design of Damage Tolerant Aircraft Structures. University of Dayton Research Institute; Dayton, OH: 2002. [Google Scholar]
- 21.Nguyen-Duy P. Relationship Between Critical Stretch Zone Width, Crack-Tip Opening Displacement, and Fracture-Energy Criterion: Application to SA-516-70 Steel Plates. American Society for Testing and Materials; Philadelphia, PA: 1981. Standard No. ASTM STP 743. [Google Scholar]
- 22.Doig P, Smith RF, Flewitt PEJ. The Use of Stretch Zone Width Measurements in the Determination of Fracture Toughness of Low Strength Steels. Eng Fract Mech. 1984;19(4):653–664. [Google Scholar]


