

Abstract
Background
Minority patients are at higher risk for complications and readmissions after total hip and knee arthroplasty. They are also more likely to undergo joint replacement in lower volume centers, which is associated with poorer outcomes. It is unknown whether these disparities simply reflect disproportionate use of lower volume centers. This study evaluates the impact of hospital volume on racial differences in outcomes following joint replacement.
Methods
Patients who underwent total hip or knee arthroplasty between 2006 and 2013 in New York and Florida were identified through the Healthcare Cost and Utilization Project State Inpatient Databases. Complications, readmissions, and emergency department (ED) visits within 90 days were compared by hospital volume. Relative risks were calculated with generalized estimating equations for risk factors associated with adverse outcomes.
Results
Race/ethnicity was not associated with readmission following hip replacement. Black race was associated with readmission following knee replacement [Relative Risk (RR) 1.16]. Black race was associated with ED visits following hip replacement [RR 1.29] and knee replacement [RR 1.33]. Hispanic ethnicity was associated with ED visits following knee replacement [RR 1.15], but not hip replacement. These associations did not change after adjusting for hospital volume.
Conclusions
Adjusting for hospital volume does not alter the risk of readmissions and ED use associated with minority race/ethnicity, suggesting that hospital volume alone may be insufficient to explain racial differences in outcome.
Keywords: race, disparities, joint replacement, readmissions, volume
INTRODUCTION
Minority patients are at higher risk for complications, including infection, venous thromboembolism, and death, and readmissions after total hip and knee arthroplasty [1–9]. The reasons for this are unclear. Previous studies have demonstrated that disparities persist despite adjusting for known risk factors, including age, sex, comorbidities, socioeconomic status, and insurance status [4, 10–12]. Another major risk factor for poorer outcomes following joint replacement is hospital arthroplasty volume. Patients who receive care in hospitals where fewer arthroplasty procedures are performed have been found to have higher rates of postoperative complications, including infection, pulmonary embolism, myocardial infarction, pneumonia, and death, as well as higher readmission rates [8, 13–18]. It has been shown that minority patients are more likely to undergo joint replacement in lower volume hospitals [12, 19–23]; however, it is unknown whether the disparate outcomes observed in minority joint replacement patients simply reflect this disproportionate use of lower volume centers. The purpose of this study is to determine the impact of hospital volume on racial differences in complications, readmissions, and emergency department visits following joint replacement. We hypothesize that accounting for hospital volume will attenuate the impact of race on risk of complication, readmission and emergency department use following total hip and knee arthroplasty.
METHODS
After receiving exempt status from our Institutional Review Board, patients aged 18 years and older who had a primary total hip or total knee arthroplasty for osteoarthritis, rheumatoid arthritis, or avascular necrosis during a hospitalization with hospital discharge between January 1, 2006 and September 30, 2013 were identified in the New York (NY) and Florida (FL) State Inpatient Databases (SID) [24] utilizing hospital discharge ICD-9-CM diagnosis and procedure codes [Appendix]. These databases are supported by the Agency for Healthcare Research and Quality (AHRQ) and organized by the Healthcare Cost and Utilization Project (HCUP). They contain billing records from non-federal acute care community hospitals within a given state, regardless of payer status. We selected the NY and FL databases for this study because they contain unique patient identifiers which allow tracking of patients over time. These states also have large, diverse populations, in terms of race/ethnicity and socioeconomic status, which further enhances the study population. For patients with multiple total hip arthroplasty hospitalizations, only the first hospitalization in the period of study was included in the total hip arthroplasty analyses to avoid clustering within individual patients. Patients with multiple total knee arthroplasty hospitalizations were managed similarly. Patients with multiple arthroplasty procedures in a single hospitalization were excluded. Patients whose state of residence was different than the state in which they underwent surgery were excluded, as there was a high likelihood that readmissions in these patients could be missed if they visited hospitals closer to their homes. Discharges from non-community hospitals were identified by cross-referencing with the American Hospital Association Annual Survey of Hospitals and were excluded (American Hospital Association, Chicago, Illinois). Finally, select medical and surgical conditions were excluded from the final cohort: 1) those with open/closed reductions or revisions in the previous year (855 patients), as this may indicate that the procedure identified as a primary total hip or knee arthroplasty may actually be a revision; 2) those with a diagnosis of tumors, metastatic cancer, lymphoma and/or paralysis (10,544 patients), as those conditions may predispose patients to a higher than average complication and readmission rate; and 3) those who died during their surgical admission (519 patients), as readmission was not possible.
After records of interest were identified, all discharges for these patients were identified and records with overlapping admissions were collapsed into a single admission, as these were transfers between institutions. Demographic information was collected, including age, gender, insurance type, median household income by ZIP code, and race. Comorbidities documented for each patient during the surgical admission or any hospitalization(s) in the previous year, were identified using the Elixhauser comorbidity algorithm, which is a comprehensive set of comorbidity measures specifically designed for use with large administrative datasets [25]. The elective arthroplasty volume for each hospital was calculated as the mean number of total hip and knee replacements per year during the study period.
The outcomes of interest were 1) complications during the index admission and 2) inpatient readmissions and emergency department visits within 90 days of discharge from the index surgical hospitalization. Complications of interest included surgical site infection, non-infectious wound complications, mechanical complications (including those requiring closed reduction or revision surgery), pulmonary embolism, deep vein thrombosis, acute myocardial infection, acute respiratory failure, non-surgical site infection (sepsis/septicemia, pneumonia, Clostridium difficile infection, urinary tract infection), gastrointestinal complications (gastrointestinal bleed, paralytic ileus), and neurologic complications (altered mental status, central nervous system infarction, and intracranial hemorrhage). Complications were identified by ICD-9-CM diagnosis and procedure codes [Appendix]. Mortality within 90 days of discharge was identified. The first readmission within 90 days per person was identified from the SID and the primary readmission diagnosis was recorded. The first treat-and-release emergency department visit per person was identified from the State Emergency Department Databases (SEDD) for NY and FL, which utilize identical unique patient identifiers as the SID [26]. Primary diagnoses from these emergency department visits were identified.
All hospitals included in the study were divided into quartiles based on mean annual arthroplasty volume. Demographic characteristics, complication rates, readmission rates, and emergency department visit rates were compared for each quartile. Univariate statistics were performed utilizing Chi-square analysis. Generalized estimating equation models with a Poisson link, accounting for clustering within hospitals, were used to assess risk factors associated with inpatient readmission and emergency department visits, with calculation of relative risks. The variables included in the model are listed in the Appendix. All variables with a p < 0.05 in univariate analyses were initially included in the models, with stepwise removal of variables no longer significant, after controlling for other variables in the model. All data analyses were performed utilizing SAS Enterprise Guide 7.1 (SAS Institute, Cary, North Carolina).
RESULTS
There were 192,153 total hip replacement patients in the study, of which black and Hispanic patients represented 10.9% of the cohort. There were 340,577 total knee replacement patients, of which 15% were black and Hispanic.
Hospitals in the lowest volume quartile performed an average of 16 total hip and knee arthroplasties per year [Table 1]. These hospitals had the highest proportion of black and Hispanic patients, low socioeconomic status patients, and patients with Medicaid insurance undergoing joint replacement. Centers in the highest volume quartile performed an average of 573 total hip and knee arthroplasties per year and had the lowest proportion of black and Hispanic patients, low socioeconomic status patients, and patients with Medicaid insurance undergoing joint replacement.
Table 1.
Demographics of Patients with Total Hip Arthroplasty and Total Knee Arthroplasty in the New York and Florida State Inpatient Databases, 2006 through the third quarter, 2013.
| Variable | Overall | Hospital Hip/Knee Arthroplasty Volume Quartile | ||||
|---|---|---|---|---|---|---|
| 1 | 2 | 3 | 4 | |||
| Mean Annual TJA Volume, (range) | 15.7 (1 – 36) |
76.8 (37 – 121) |
188.7 (122 – 275) |
573.2 (282 – 3,703) |
||
| Total Hip Replacement | Total Number of Patients | 192,153 | 2,633 | 15,049 | 40,409 | 134,062 |
| Black Patients, N (%) | 12,457 (6.5%) |
469 (17.8%) |
1,196 (8.0%) |
3,572 (8.8%) |
7,220 (5.4%) |
|
| Hispanic Patients, N (%) | 8,359 (4.4%) |
255 (9.7%) |
687 (4.6%) |
1,902 (4.7%) |
5,515 (4.1%) |
|
| Mean Age (y) | 66.1 | 63.4 | 66.0 | 65.8 | 66.2 | |
| % Female | 56.0 | 54.6 | 55.9 | 55.3 | 56.3 | |
| % Low SES* | 17.5 | 28.8 | 25.1 | 17.7 | 16.4 | |
| % Medicaid | 3.2 | 15.8 | 5.8 | 4.7 | 2.2 | |
| % Obesity | 16.5 | 13.8 | 15.1 | 15.3 | 17.1 | |
| % Diabetes | 15.9 | 17.9 | 17.5 | 17.6 | 15.1 | |
| % Renal Failure | 4.7 | 5.2 | 4.7 | 5.1 | 4.6 | |
| % Congestive Heart Failure | 3.1 | 4.3 | 3.5 | 3.5 | 2.9 | |
| Total Knee Replacement | Total Number of Patients | 340,577 | 5,830 | 30,536 | 76,354 | 227,857 |
| Black Patients, N (%) | 27,206 (8.0%) |
891 (15.3%) |
2,975 (9.7%) |
8,128 (10.7%) |
15,212 (6.7%) |
|
| Hispanic Patients, N (%) | 23,589 (7.0%) |
1,002 (17.2%) |
2,493 (8.2%) |
5,654 (7.4%) |
14,440 (6.3%) |
|
| Mean Age (y) | 67.5 | 66.2 | 66.8 | 67.3 | 67.7 | |
| % Female | 63.9 | 68.0 | 64.8 | 65.0 | 63.2 | |
| % Low SES* | 20.0 | 34.0 | 25.9 | 19.5 | 19.1 | |
| % Medicaid | 2.9 | 13.6 | 5.5 | 4.1 | 1.9 | |
| % Obesity | 22.9 | 20.8 | 21.3 | 21.0 | 23.8 | |
| % Diabetes | 23.1 | 28.6 | 25.6 | 25.0 | 22.0 | |
| % Renal Failure | 4.9 | 4.6 | 5.0 | 5.2 | 4.8 | |
| % Congestive Heart Failure | 3.2 | 3.2 | 3.5 | 3.7 | 3.0 | |
Defined as residents of ZIP codes in lowest median income quartile in their respective state
The overall rate of complications diagnosed during index hospitalizations for total hip arthroplasty was 7.1%. The most common complications were urinary tract infection (3.2%), paralytic ileus (0.88%), and gastrointestinal bleeding (0.74%). The complication rate decreased as hospital volume increased, from 10.2% in the lowest volume quartile to 6.7% in the highest volume quartile. The complication rate in white patients decreased as hospital volume increased (p < 0.0001), but the complication rates in black and Hispanic patients did not significantly decrease (p = 0.12 and p = 0.12, respectively) [Figure 1].
Figure 1.
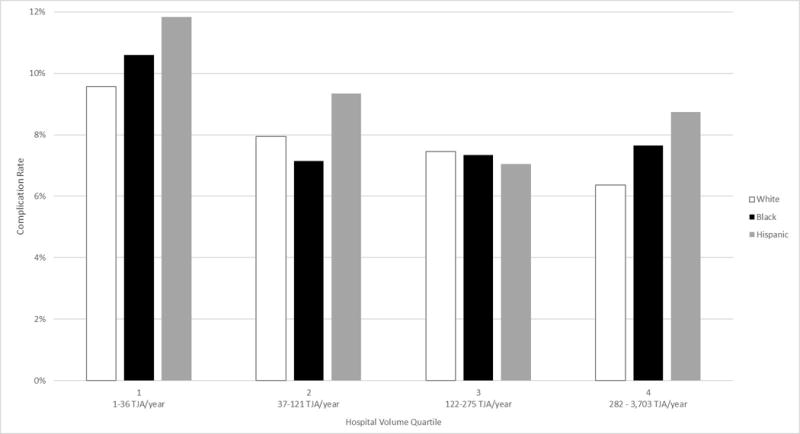
In-Hospital Total Hip Replacement Complication Rates by Race.
The index hospitalization complication rate following total knee arthroplasty was 7.1%. The most common complications were urinary tract infection (3.0%), venous thromboembolism (1.1%), and gastrointestinal bleeding (0.85%). Similar to total hip arthroplasty, complications in total knee arthroplasty patients decreased as hospital volume increased, from 9.1% in the lowest volume quartile to 6.8% in the highest volume quartile. Complication rates in whites and blacks decreased as hospital volume increased (p < 0.0001 and p = 0.013, respectively). The complication rate among Hispanic patients increased from the lowest to the highest volume quartile (p < 0.0001) [Figure 2].
Figure 2.
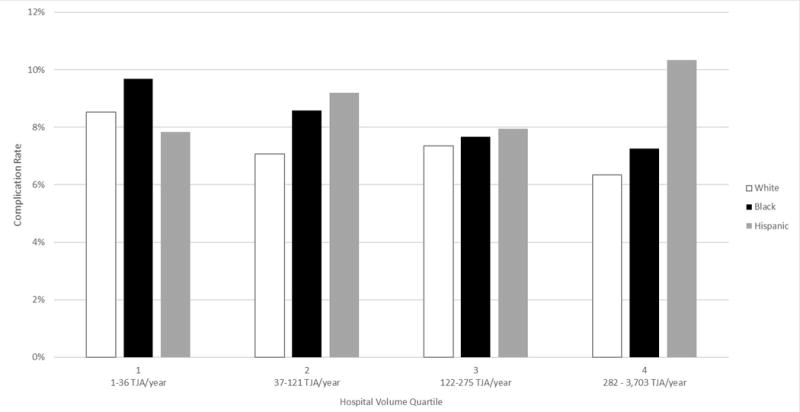
In-Hospital Total Knee Replacement Complication Rates by Race.
The 90-day mortality rates following total hip and total knee arthroplasty were 0.24% and 0.23%, respectively. Further analysis by hospital volume and race was not possible due to such low rates.
The percentage of persons readmitted to the hospital at least once within 90 days of discharge following total hip arthroplasty was 7.7%. The percentage of patients with readmissions decreased as hospital volume increased, from 10.5% in the lowest volume quartile to 7.2% in the highest volume quartile [Table 2]. The most common primary diagnoses were dislocation of prosthetic joint (6.9%), other postoperative infection (5.4%), and infection and inflammatory reaction due to internal joint prosthesis (4.0%) [Appendix]. Without adjusting for hospital volume, minority race/ethnicity was not associated with inpatient readmission after total hip replacement within either 30 or 90 days [Table 3]. Once volume was added to the model, the association between race and readmission did not change. Female sex, Medicare insurance, Medicaid insurance, surgical admissions in the lowest two hospital volume quartiles, selected comorbidities (congestive heart failure, renal failure, diabetes, and obesity), increased index hospitalization length of stay, and certain index complications (myocardial infarction, venous thromboembolism, altered mental status, gastrointestinal bleed, non-infectious wound complications, mechanical complications, and dislocation requiring closed reduction) were associated with readmission within 30 and 90 days [Appendix].
Table 2.
Readmissions within 90 days of total joint replacement.
| Hospital Volume | Total Hip Replacement | Total Knee Replacement | ||
|---|---|---|---|---|
| Total Number of Patients | Number of Persons With ≥ 1 Readmission (%) | Total Number of Patients | Number of Persons With ≥ 1 Readmission (%) | |
| Quartile 1 | 2,633 | 277 (10.5%) | 5,830 | 664 (11.4%) |
| Quartile 2 | 15,049 | 1,500 (10.0%) | 30,536 | 2,791 (9.1%) |
| Quartile 3 | 40,409 | 3,370 (8.3%) | 76,354 | 6,626 (8.7%) |
| Quartile 4 | 134,062 | 9,683 (7.2%) | 227,857 | 16,768 (7.4%) |
Table 3.
Risk Factors Associated with Inpatient Readmission Within 30 and 90 days following Total Hip Arthroplasty.
| Readmission within 30 Days | Readmission within 90 Days | |||
|---|---|---|---|---|
| Volume Excluded from the Model | Volume Included | Volume Excluded from the Model | Volume Included | |
| Variable | Relative Risk [95% Confidence Interval] |
Relative Risk [95% Confidence Interval] |
Relative Risk [95% Confidence Interval] |
Relative Risk [95% Confidence Interval] |
| Hospital Volume Quartile 1 |
1.17 [1.01 – 1.35] |
1.16 [1.02 – 1.32] |
||
| Hospital Volume Quartile 2 |
1.19 [1.09 – 1.30] |
1.15 [1.07 – 1.24] |
||
| Hospital Volume Quartile 3 | 0.99 [0.92 – 1.07] |
1.00 [0.95 – 1.06] |
||
| Hospital Volume Quartile 4 | 1.0 | 1.0 | ||
| White Race | 1.0 | 1.0 | 1.0 | 1.0 |
| Black Race | 1.07 [0.99 – 1.16] |
1.07 [0.99 – 1.16] |
1.04 [0.98 – 1.11] |
1.04 [0.98 – 1.11] |
| Hispanic Ethnicity | 1.04 [0.94 – 1.15] |
1.04 [0.94 – 1.15] |
1.00 [0.93 – 1.08] |
1.00 [0.93 – 1.08] |
Statistically significant results in bold
The percentage of persons readmitted to the hospital at least once within 90 days of discharge following total knee arthroplasty was 7.9%. This percentage decreased as hospital volume increased, from 11.4% in the lowest volume quartile to 7.4% in the highest volume quartile [Table 2]. The most common diagnoses were other postoperative infection (6.5%), infection and inflammatory reaction due to internal joint prosthesis (5.2%), and other complications due to internal joint prosthesis (2.9%) [Appendix]. Without adjusting for hospital volume, black race was associated with increased risk of inpatient readmission after total knee replacement within both 30 and 90 days, but Hispanic ethnicity was not [Table 4]. Adding hospital volume to the model did not change this association. Female sex, Medicare insurance, Medicaid insurance, surgical admissions in the lowest two hospital volume quartiles, selected comorbidities (congestive heart failure, renal failure, diabetes, and obesity), increased index hospitalization length of stay, and postoperative complications during the surgical hospitalization (myocardial infarction, gastrointestinal bleed, non-infectious wound complications, mechanical complications, paralytic ileus, Clostridium difficile infection, and urinary tract infection) were associated with readmission following total knee replacement [Appendix].
Table 4.
Risk Factors Associated with Inpatient Readmission Within 30 and 90 days following Total Knee Arthroplasty.
| Readmission within 30 Days | Readmission within 90 Days | |||
|---|---|---|---|---|
| Volume Excluded from the Model | Volume Included | Volume Excluded from the Model | Volume Included | |
| Variable | Relative Risk [95% Confidence Interval] |
Relative Risk [95% Confidence Interval] |
Relative Risk [95% Confidence Interval] |
Relative Risk [95% Confidence Interval] |
| Hospital Volume Quartile 1 |
1.34 [1.19 – 1.51] |
1.29 [1.17 – 1.41] |
||
| Hospital Volume Quartile 2 | 1.08 [1.00 – 1.17] |
1.09 [1.03 – 1.17] |
||
| Hospital Volume Quartile 3 | 1.03 [0.96 – 1.10] |
1.03 [0.98 – 1.09] |
||
| Hospital Volume Quartile 4 | 1.0 | 1.0 | ||
| White Race | 1.0 | 1.0 | 1.0 | 1.0 |
| Black Race |
1.21 [1.15 – 1.27] |
1.21 [1.15 – 1.28] |
1.16 [1.11 – 1.21] |
1.16 [1.11 – 1.21] |
| Hispanic Ethnicity | 1.05 [0.98 – 1.13] |
1.05 [0.97 – 1.12] |
1.03 [0.98 – 1.09] |
1.03 [0.97 – 1.09] |
Statistically significant results in bold
The percentage of persons with at least one treat-and-release emergency department visit within 90 days of discharge following total hip arthroplasty was 8.3%. This percentage decreased as hospital volume increased, from 11.4% in the lowest volume quartile to 8.0% in the highest volume quartile [Table 5]. The most common emergency department diagnoses were pain in joint, pelvic region and thigh (5.3%), dislocation of prosthetic joint (4.9%), and edema (4.0%) [Appendix]. When hospital volume was excluded, black race was associated with increased risk of emergency department visits after total hip replacement within both 30 and 90 days, but Hispanic ethnicity was not [Table 6]. Adjusting for hospital volume did not change this association. Female sex, Medicare insurance, Medicaid insurance, surgical admission in the second lowest hospital volume quartile, history of congestive heart failure, and postoperative altered mental status were associated with emergency department visits following total hip replacement [Appendix].
Table 5.
Emergency department visits within 90 days of total joint replacement.
| Hospital Volume | Total Hip Replacement | Total Knee Replacement | ||
|---|---|---|---|---|
| Total Number of Patients | Number of Persons With ≥ 1 Readmission (%) | Total Number of Patients | Number of Persons With ≥ 1 Readmission (%) | |
| Quartile 1 | 2,633 | 299 (11.4%) | 5,830 | 665 (11.4%) |
| Quartile 2 | 15,049 | 1,502 (10.0%) | 30,536 | 3,244 (10.6%) |
| Quartile 3 | 40,409 | 3,552 (8.8%) | 76,354 | 7,236 (9.5%) |
| Quartile 4 | 134,062 | 10,658 (8.0%) | 227,857 | 19,733 (8.7%) |
Table 6.
Risk Factors Associated with Emergency Department Visits within 30 and 90 days following Total Hip Arthroplasty.
| Emergency Department Visit within 30 Days | Emergency Department Visit within 90 Days | |||
|---|---|---|---|---|
| Volume Excluded from the Model | Volume Included | Volume Excluded from the Model | Volume Included | |
| Variable | Relative Risk [95% Confidence Interval] |
Relative Risk [95% Confidence Interval] |
Relative Risk [95% Confidence Interval] |
Relative Risk [95% Confidence Interval] |
| Hospital Volume Quartile 1 | 1.06 [0.91 – 1.24] |
1.11 [0.99 – 1.23] |
||
| Hospital Volume Quartile 2 | 1.10 [1.00 – 1.22] |
1.09 [1.00 – 1.18] |
||
| Hospital Volume Quartile 3 | 0.97 [0.89 – 1.04] |
0.99 [0.93 – 1.06] |
||
| Hospital Volume Quartile 4 | 1.0 | 1.0 | ||
| White Race | 1.0 | 1.0 | 1.0 | 1.0 |
| Black Race |
1.30 [1.21 – 1.40] |
1.30 [1.21 – 1.40] |
1.29 [1.23 – 1.36] |
1.29 [1.23 – 1.36] |
| Hispanic Ethnicity | 0.92 [0.83 – 1.03] |
0.92 [0.83 – 1.02] |
0.96 [0.88 – 1.05] |
0.96 [0.88 – 1.04] |
Statistically significant results in bold
The percentage of persons with at least one treat-and-release emergency department visit within 90 days following total knee arthroplasty was 9.1%. This percentage decreased as hospital volume increased, from 11.4% in the lowest volume quartile to 8.7% in the highest volume quartile [Table 5]. The most common diagnoses for these visits were pain in joint, lower leg (7.1%), pain in limb (4.1%), and cellulitis and abscess of leg, except foot (2.4%) [Appendix]. When hospital volume was not adjusted for, both Black race and Hispanic were associated with increased risk of emergency department visits within both 30 and 90 days after total knee replacement discharge [Table 7]. Adjusting for hospital volume did not change these associations. Female sex, Medicare insurance, Medicaid insurance, surgical admission in the second lowest hospital volume quartile, history of congestive heart failure, history of renal failure, history of diabetes, postoperative venous thromboembolism, and postoperative altered mental status during the index hospitalization were associated with emergency department use following total knee replacement [Appendix].
Table 7.
Risk Factors Associated with Emergency Department Visits within 30 and 90 Days following Total Knee Arthroplasty.
| Emergency Department Visit within 30 Days | Emergency Department Visit within 90 Days | |||
|---|---|---|---|---|
| Volume Excluded from the Model | Volume Included | Volume Excluded from the Model | Volume Included | |
| Variable | Relative Risk [95% Confidence Interval] |
Relative Risk [95% Confidence Interval] |
Relative Risk [95% Confidence Interval] |
Relative Risk [95% Confidence Interval] |
| Hospital Volume Quartile 1 | 1.01 [0.90 – 1.14] |
1.07 [0.97 – 1.18] |
||
| Hospital Volume Quartile 2 | 1.08 [0.99 – 1.18] |
1.10 [1.02 – 1.18] |
||
| Hospital Volume Quartile 3 | 1.00 [0.93 – 1.09] |
1.01 [0.95 – 1.07] |
||
| Hospital Volume Quartile 4 | 1.0 | 1.0 | ||
| White Race | 1.0 | 1.0 | 1.0 | 1.0 |
| Black Race |
1.32 [1.25 – 1.39] |
1.32 [1.25 – 1.39] |
1.34 [1.28 – 1.39] |
1.33 [1.28 – 1.39] |
| Hispanic Ethnicity |
1.11 [1.04 – 1.19] |
1.11 [1.04 – 1.19] |
1.15 [1.09 – 1.21] |
1.15 [1.09 – 1.21] |
Statistically significant results in bold
DISCUSSION
This study demonstrates that adjusting for hospital volume does not alter the risk of readmission and emergency department use associated with minority race/ethnicity. Despite adjusting for hospital arthroplasty volume, Black race was still associated with increased risk of inpatient readmission after knee replacement and both black race and Hispanic ethnicity were associated with significantly higher risk of 30- and 90-day emergency department visits following both total hip and total knee arthroplasty.
Previous studies have examined the impact of sites of care on racial disparities in outcome following joint replacement, but they focused on minority-serving hospitals. Racial differences in readmission rates have been found to be mediated, in part, by receiving care in hospitals which predominantly serve minority patients [18, 27–28]. Girotti et al estimated that 70% of racial differences in readmission following hip replacement in the Medicare population could be explained by receiving care in a minority-serving hospital [27]. However, the classification of hospitals merely by the number of minority patients served may be problematic. Although many studies, even outside of orthopaedics, have demonstrated poorer outcomes in minority-serving hospitals [15, 27–30], this classification is not necessarily an adequate descriptor of the hospital itself; only of the population it serves. It does not provide any specific characteristics of the sites of care, such as quality of surgeons, surgeon procedural volume, nursing care, or perioperative care protocols, which have also been shown to contribute to outcomes [31–34]. It is also possible that these findings reflect the effect of high concentrations of high risk, minority patients in certain centers, rather than specific problems with the site of care. This is consistent with our finding that, compared to the highest volume quartile, patients treated in the lowest volume quartile hospitals had a higher burden of comorbidities and lower socioeconomic status, which are both known to impact outcomes. We utilized hospital volume in our study because it has been associated with outcomes following joint replacement [13–17]. However, accounting for hospital surgical volume in our analysis of complications, readmissions and emergency department visits following total hip and knee arthroplasty did not reduce the risk associated with minority race/ethnicity.
An interesting finding in this study is the association between minority race, particularly African American race, and utilization of emergency departments following total hip and knee arthroplasty. The fact that adjusting for hospital volume did not change the risk associated with black race may suggest that the reasons for this racial difference may be patient- rather than hospital-related. Higher rates of all-cause emergency department utilization among African Americans have been demonstrated in national-level survey data from the Centers for Disease Control and Prevention [35–36]. It is unclear whether African Americans have more problems necessitating emergency department visits, or whether this group of patients has a predilection for seeking care through the emergency room. Some studies have demonstrated a higher likelihood for African Americans to visit the emergency room for non-urgent reasons [37–38].
This study is limited by using administrative databases, which are generally limited by accuracy of coding [39–41]. Additionally, the data was limited to two states due to the availability of important patient tracking information, so generalizability of the results may be limited. Finally, annual arthroplasty volume is not a perfect measure of hospital quality. Although it has been associated with outcomes [13–15], it does not account for surgeon volume, surgeon quality, and the quality of care protocols, which have also been shown to be important determinants of surgical outcomes [13–14, 17, 33–34].
The combination of the results of our study and previous studies on this topic suggest that both patient and hospital characteristics contribute to racial differences in outcomes and that patient and hospital risk factors may not operate independently. Hospital volume alone does not appear to be mitigate the effect of race on outcomes, suggesting that a single measure of hospital quality may not fully overcome the effect of race. Further understanding of the relationship between patient and hospital risk factors may improve our ability to elucidate the reasons behind racial disparities in joint replacement outcomes.
CONCLUSION
This study demonstrates that adjusting for hospital volume does not alter the risk of readmission and emergency department use associated with minority race/ethnicity, which suggests that hospital volume alone may be insufficient to explain racial differences in outcome. Further investigations should focus on understanding the relationship between patient and hospital risk factors for poor outcomes.
Supplementary Material
Acknowledgments
This work was supported The Center for Administrative Data Research at Washington University School of Medicine, which is supported by the Washington University Institute of Clinical and Translational Sciences grant UL1 TR000448 from the National Center for Advancing Translational Sciences (NCATS) of the National Institutes of Health (NIH), Grant Number R24 HS19455 through the Agency for Healthcare Research and Quality (AHRQ), and Grant Number KM1CA156708 through the National Cancer Institute (NCI) at the National Institutes of Health (NIH). The content is solely the responsibility of the authors and does not necessarily represent the official view of the NIH.
Contributor Information
Muyibat A. Adelani, Washington University School of Medicine, Department of Orthopaedic Surgery, 660 S. Euclid Avenue, Campus Box 8233, Saint Louis, Missouri 63110
Matthew Keller, Washington University School of Medicine, Division of Infectious Diseases, Department of Medicine, 660 S. Euclid Avenue, Campus Box 8051, Saint Louis, Missouri 63110
Robert L. Barrack, Washington University School of Medicine, Department of Orthopaedic Surgery, 660 S. Euclid Avenue, Campus Box 8233, Saint Louis, Missouri 63110
Margaret A. Olsen, Washington University School of Medicine, Division of Infectious Diseases, Department of Medicine, 660 S. Euclid Avenue, Campus Box 8051, Saint Louis, Missouri 63110; Washington University School of Medicine, Division of Public Health Sciences, Department of Surgery, 660 S. Euclid Avenue, Campus Box 8051, Saint Louis, Missouri 63110.
References
- 1.Singh JA, Lu X, Rosenthal GE, Ibrahim S, Cram P. Racial disparities in knee and hip total joint arthroplasty: an 18-year analysis of national Medicare data. Ann Rheum Dis. 2014;73(12):2107–2115. doi: 10.1136/annrheumdis-2013-203494. [DOI] [PMC free article] [PubMed] [Google Scholar]
- 2.Mahomed NN, Barrett JA, Katz JN, Phillips CB, Losina E, Lew RA, et al. Rates and outcomes of primary and revision total hip replacement in the United States medicare population. J Bone Joint Surg Am. 2003;85A(1):27–32. doi: 10.2106/00004623-200301000-00005. [DOI] [PubMed] [Google Scholar]
- 3.Mahomed NN, Barrett J, Katz JN, Baron JA, Wright J, Losina E. Epidemiology of total knee replacement in the United States Medicare population. J Bone Joint Surg Am. 2005;87(6):1222–1228. doi: 10.2106/JBJS.D.02546. [DOI] [PubMed] [Google Scholar]
- 4.Ibrahim SA, Stone RA, Han X, Cohen P, Fine MJ, Henderson WG, et al. Racial/ethnic differences in surgical outcomes in veterans following knee or hip arthroplasty. Arthritis Rheum. 2005;52(10):3143–3151. doi: 10.1002/art.21304. [DOI] [PubMed] [Google Scholar]
- 5.SooHoo NF, Farng E, Lieberman JR, Chambers L, Zingmond DS. Factors that predict short-term complication rates after total hip arthroplasty. Clin Orthop Relat Res. 2010;468(9):2363–2371. doi: 10.1007/s11999-010-1354-0. [DOI] [PMC free article] [PubMed] [Google Scholar]
- 6.SooHoo NF, Lieberman JR, Ko CY, Zingmond DS. Factors predicting complication rates following total knee replacement. J Bone Joint Surg Am. 2006;88(3):480–485. doi: 10.2106/JBJS.E.00629. [DOI] [PubMed] [Google Scholar]
- 7.Keeney JA, Nam D, Johnson SR, Nunley RM, Clohisy JC, Barrack RL. Socioeconomically Disadvantaged CMS Beneficiaries Do Not Benefit from the Readmission Reduction Initiatives. J Arthroplasty. 2015 doi: 10.1016/j.arth.2015.06.031. e pub. [DOI] [PubMed] [Google Scholar]
- 8.Paxton EW, Inacio MC, Singh JA, Love R, Bini SA, Namba RS. Are There Modifiable Risk Factors for Hospital Readmission after Total Hip Arthroplasty in a US Healthcare System? Clin Orthop Relat Res. 2015;473(11):3446–3455. doi: 10.1007/s11999-015-4278-x. [DOI] [PMC free article] [PubMed] [Google Scholar]
- 9.Zmistowski B, Restrepo C, Hess J, Adibi D, Cangoz S, Parvizi J. Unplanned readmission after total joint arthroplasty: rates, reasons, and risk factors. J Bone Joint Surg Am. 2013;95(20):1869–1876. doi: 10.2106/JBJS.L.00679. [DOI] [PubMed] [Google Scholar]
- 10.Adelani MA, Archer KR, Song Y, Holt GE. Immediate complications following hip and knee arthroplasty: does race matter? J Arthroplasty. 2013;28(5):732–735. doi: 10.1016/j.arth.2012.09.015. [DOI] [PubMed] [Google Scholar]
- 11.Goodman SM, Mandl LA, Parks ML, Zhang M, McHugh KR, Lee YY, et al. Disparities in TKA Outcomes: Census Tract Data Show Interactions between Race and Poverty. Clin Orthop Relat Res. 2016;474(9):1986–1995. doi: 10.1007/s11999-016-4919-8. [DOI] [PMC free article] [PubMed] [Google Scholar]
- 12.Zhang W, Lyman S, Boutin-Foster C, Parks ML, Pan TJ, Lan A, et al. Racial and Ethnic Disparities in Utilization Rate, Hospital Volume, and Perioperative Outcomes after Total Knee Arthroplasty. J Bone Joint Surg Am. 2016;98(15):1243–1252. doi: 10.2106/JBJS.15.01009. [DOI] [PubMed] [Google Scholar]
- 13.Katz JN, Losina E, Barrett J, Phillips CB, Mahomed NN, Lew RA, et al. Association between hospital and surgeon procedure volume and outcomes of total hip replacement in the United States medicare population. J Bone Joint Surg Am. 2001;83A(11):1622–1629. doi: 10.2106/00004623-200111000-00002. [DOI] [PubMed] [Google Scholar]
- 14.Katz JN, Barrett J, Mahomed NN, Baron JA, Wright RJ, Losina E. Association between hospital and surgeon procedure volume and the outcomes of total knee replacement. J Bone Joint Surg Am. 2004;86A(9):1909–1916. doi: 10.2106/00004623-200409000-00008. [DOI] [PubMed] [Google Scholar]
- 15.Badawy M, Espehaug B, Indrekvam K, Engesæter LB, Havelin LI, Furnes O. Influence of hospital volume on revision rate after total knee arthroplasty with cement. J Bone Joint Surg Am. 2013;95(18):e131. doi: 10.2106/JBJS.L.00943. [DOI] [PubMed] [Google Scholar]
- 16.Laucis NC, Chowdhury M, Dasgupta A, Bhattacharyya T. Trend Toward High-Volume Hospitals and the Influence on Complications in Knee and Hip Arthroplasty. J Bone Joint Surg Am. 2016;98(9):707–712. doi: 10.2106/JBJS.15.00399. [DOI] [PMC free article] [PubMed] [Google Scholar]
- 17.Wilson S, Marx RG, Pan TJ, Lyman S. Meaningful Thresholds for the Volume-Outcome Relationship in Total Knee Arthroplasty. J Bone Joint Surg Am. 2016;98(20):1683–1690. doi: 10.2106/JBJS.15.01365. [DOI] [PubMed] [Google Scholar]
- 18.Chen JC, Shaw JD, Ma Y, Rhoads KF. The role of the hospital and health care system characteristics in readmissions after major surgery in California. Surgery. 2016;159(2):381–388. doi: 10.1016/j.surg.2015.06.016. [DOI] [PubMed] [Google Scholar]
- 19.Liu JH, Zingmond DS, McGory ML, SooHoo NF, Ettner SL, Brook RH, et al. Disparities in the utilization of high-volume hospitals for complex surgery. JAMA. 2006;296(16):1973–1980. doi: 10.1001/jama.296.16.1973. [DOI] [PubMed] [Google Scholar]
- 20.SooHoo NF, Zingmond DS, Ko CY. Disparities in the utilization of high-volume hospitals for total knee replacement. J Natl Med Assoc. 2008;100(5):559–564. doi: 10.1016/s0027-9684(15)31303-1. [DOI] [PubMed] [Google Scholar]
- 21.SooHoo NF, Farng E, Zingmond DS. Disparities in the utilization of high-volume hospitals for total hip replacement. J Natl Med Assoc. 2011;103(1):31–35. doi: 10.1016/s0027-9684(15)30240-6. [DOI] [PubMed] [Google Scholar]
- 22.Epstein AJ, Gray BJ, Schlesinger M. Racial and ethnic differences in the use of high-volume hospitals and surgeons. Arch Surg. 2010;145(2):179–186. doi: 10.1001/archsurg.2009.268. [DOI] [PubMed] [Google Scholar]
- 23.Losina E, Wright EA, Kessler CL, Barrett JA, Fossell AH, Creel AH, Mahomed NN, Baron JA, Katz JN. Neighborhoods matter: use of hospitals with worse outcomes following total knee replacement by patients from vulnerable populations. Arch Intern Med. 2007;167(2):182–187. doi: 10.1001/archinte.167.2.182. [DOI] [PubMed] [Google Scholar]
- 24.HCUP State Inpatient Databases (SID) Healthcare Cost and Utilization Project (HCUP) Agency for Healthcare Research and Quality; Rockville, MD: 2005-2009. www.hcup-us.ahrq.gov/sidoverview.jsp. [PubMed] [Google Scholar]
- 25.Elixhauser A, Steiner C, Harris DR, Coffey RM. Comorbidity measures for use with administrative data. Med Care. 1998;36:8–27. doi: 10.1097/00005650-199801000-00004. [DOI] [PubMed] [Google Scholar]
- 26.HCUP State Emergency Department Databases (SEDD) Healthcare Cost and Utilization Project (HCUP) Agency for Healthcare Research and Quality; Rockville, MD: 2009. www.hcup-us.ahrq.gov/seddoverview.jsp. [Google Scholar]
- 27.Girotti ME, Shih T, Revels S, Dimick JB. Racial Disparities in Readmissions and Site of Care for Major Surgery. J Am Coll Surg. 2014;218:423–430. doi: 10.1016/j.jamcollsurg.2013.12.004. [DOI] [PubMed] [Google Scholar]
- 28.Tsai TC, Orav EJ, Joynt KE. Disparities in surgical 30-day readmission rates for Medicare beneficiaries by race and site of care. Ann Surg. 2014;259(6):1086–1090. doi: 10.1097/SLA.0000000000000326. [DOI] [PMC free article] [PubMed] [Google Scholar]
- 29.Joynt KE, Orav EJ, Jha AK. Thirty-day readmission rates for Medicare beneficiaries by race and site of care. JAMA. 2011;305(7):675–681. doi: 10.1001/jama.2011.123. [DOI] [PMC free article] [PubMed] [Google Scholar]
- 30.López L, Jha AK. Outcomes for whites and blacks at hospitals that disproportionately care for black Medicare beneficiaries. Health Serv Res. 2013;48(1):114–128. doi: 10.1111/j.1475-6773.2012.01445.x. [DOI] [PMC free article] [PubMed] [Google Scholar]
- 31.Lasater KB, McHugh MD. Nurse staffing and the work environment linked to readmissions among older adults following elective total hip and knee replacement. Int J Qual Health Care. 2016;28(2):253–258. doi: 10.1093/intqhc/mzw007. [DOI] [PMC free article] [PubMed] [Google Scholar]
- 32.Lasater KB, McHugh MD. Reducing Hospital Readmission Disparities of Older Black and White Adults after Elective Joint Replacement: The Role of Nurse Staffing. J Am Geriatr Soc. 2016;64(12):2593–2598. doi: 10.1111/jgs.14367. [DOI] [PMC free article] [PubMed] [Google Scholar]
- 33.Bozic KJ, Maselli J, Pekow PS, Lindenauer PK, Vail TP, Auerbach AD. The Influence of Procedure Volumes and Standardization of Care on Quality and Efficiency in Total Joint Replacement Surgery. J Bone Joint Surg Am. 2010;92(16):2643–2652. doi: 10.2106/JBJS.I.01477. [DOI] [PubMed] [Google Scholar]
- 34.Hervey SL, Purves HR, Guller U, Toth AP, Vail TP, Pietrobon R. Provider Volume of Total Knee Arthroplasties and Patient Outcomes in the HCUP-Nationwide Inpatient Sample. J Bone Joint Surg Am. 2003;85A(9):1775–1783. doi: 10.2106/00004623-200309000-00017. [DOI] [PubMed] [Google Scholar]
- 35.McCaig LF, Nawar EW. National Hospital Ambulatory Medical Care Survey: 2004 emergency department summary. Adv Data. 2006;372:1–29. [PubMed] [Google Scholar]
- 36.National Center for Health Statistics. National Hospital Ambulatory Medical Survey. 2013 Accessed online March 2, 2017: https://www.cdc.gov/nchs/data/ahcd/nhamcs_emergency/2013_ed_web_tables.pdf.
- 37.Chen BK, Cheng X, Bennett K, Hibbert J. Travel distances, socioeconomic characteristics, and health disparities in nonurgent and frequent use of Hospital Emergency Departments in South Carolina: a population-based observational study. BMC Health Serv Res. 2015;15:203. doi: 10.1186/s12913-015-0864-6. [DOI] [PMC free article] [PubMed] [Google Scholar]
- 38.Chen BK, Hibbert J, Cheng X, Bennett K. Travel distance and sociodemographic correlates of potentially avoidable emergency department visits in California, 2006-2010: an observational study. Int J Equity Health. 2015;14:30. doi: 10.1186/s12939-015-0158-y. [DOI] [PMC free article] [PubMed] [Google Scholar]
- 39.Keeney JA, Adelani MA, Nunley RM, Clohisy JC, Barrack RL. Assessing readmission databases: how reliable is the information? J Arthroplasty. 2012;27(8 Suppl):72–76. doi: 10.1016/j.arth.2012.03.032. [DOI] [PubMed] [Google Scholar]
- 40.Mont MA, Mears SC, Jones LC, Rajadhyaksha AD, Krackow AM, Bawa M, et al. Is coding of diagnoses, comorbidities, and complications in total knee arthroplasty accurate? J Arthroplasty. 2002;17:767. doi: 10.1054/arth.2002.33549. [DOI] [PubMed] [Google Scholar]
- 41.Mears SC, Bawa M, Pietryak P, Jones LC, Rajadhyaksha AD, Hungerford DS, et al. Coding of diagnoses, comorbidities, and complications of total hip arthroplasty. Clin Orthop Relat Res. 2002;402:164. doi: 10.1097/00003086-200209000-00014. [DOI] [PubMed] [Google Scholar]
Associated Data
This section collects any data citations, data availability statements, or supplementary materials included in this article.