Abstract
Sulcal depth is an important marker of brain anatomy in neuroscience/neurological function. Previously, sulcal depth has been explored at the region-of-interest (ROI) level to increase statistical sensitivity to group differences. In this paper, we present a fully automated method that enables inferences of ROI properties from a sulcal region-focused perspective consisting of two main components: 1) sulcal depth computation and 2) sulcal curve-based refined ROIs. In conventional statistical analysis, the average sulcal depth measurements are employed in several ROIs of the cortical surface. However, taking the average sulcal depth over the full ROI blurs overall sulcal depth measurements which may result in reduced sensitivity to detect sulcal depth changes in neurological and psychiatric disorders. To overcome such a blurring effect, we focus on sulcal fundic regions in each ROI by filtering out other gyral regions. Consequently, the proposed method results in more sensitive to group differences than a traditional ROI approach. In the experiment, we focused on a cortical morphological analysis to sulcal depth reduction in schizophrenia with a comparison to the normal healthy control group. We show that the proposed method is more sensitivity to abnormalities of sulcal depth in schizophrenia; sulcal depth is significantly smaller in most cortical lobes in schizophrenia compared to healthy controls (p < 0.05).
1. INTRODUCTION
Cortical gyrification is a dynamic, complicated process that spans the entire life. It is well-known that several cortical regions are significantly involved with brain development and degeneration or brain diseases. Thus, to analyze cortical gyrification, a fundamental step is to design proper quantification of the cortical folding pattern. Due to a highly convoluted shape nature, however, the actual mechanism of cortical gyrification has been still questionable, which hampers accurate cortical gyrification analyses. Despite a lack of knowledge on the cortical gyrification, a quantification process as approximation of the gyrification can be typically folded into two main steps: 1) how (metric) and 2) where (localization) to measure for each given location of the cortex.
Several quantitative measures have been proposed using either pure geometry or anatomical shape. In pure geometry, local principal curvature-based shape descriptors have been widely employed such as shape index.1 They are useful to represent local cortical folding in terms of shape itself (e.g., shape complexity2) whereas it could be difficult to capture how deep or wide a sulcus/gyrus is since its computation is defined in the tangent plane. On the other hand, the anatomical shape-based quantification such as sulcal depth3 or local gyrification index4,5 has an ability to provide depth/wideness of the cortical folding.
Once a quantitative measure is determined, ROIs need to be specified for a regional analysis. The most common way is to incorporate a cortical parcellation.6–8 Several studies have also shown sulcal region-based parcellation such sulcal curve extraction9–11 or sulcal curve labeling.12,13 In,5 locally adaptive ROIs are defined along the cortical folding rather than predefined labels on the surface. In any of these ways, the quantitative measures can be evaluated within a particular ROI. Importantly, a regional analysis can vary depending on which ROIs are selected for such an analysis; thus, they need to be carefully chosen according to specific aims.
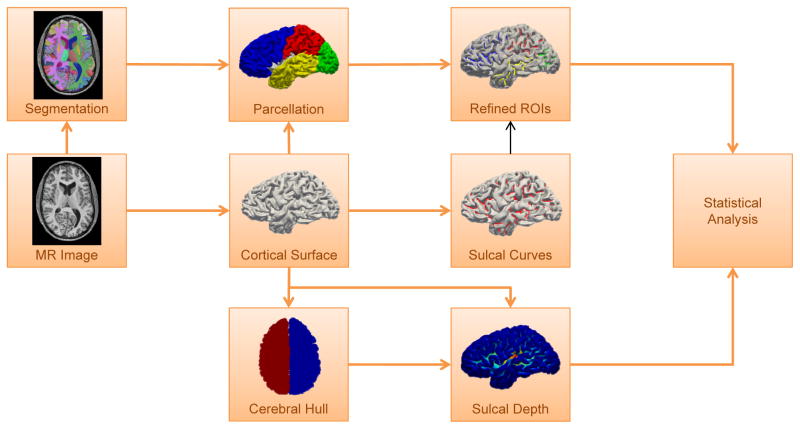
In this paper, we present a surface-based shape analysis refined by sulcal region-based ROIs to provide more statistical gains than the conventional ROI-based analysis. In particular, our interest is to figure out cortical folding difference between normal healthy control and schizophrenia groups. For this study, we measure sulcal depth as cortical shape quantification and employ sulcal curves11 to define sulcal regions within ROIs. In this way, we can reveal a sulcal depth difference with a statistical significance by filtering out sulcal depth measurements in the gyral regions that could reduce a sensitivity. This framework is similar to,14 but in addition to our novel ROI definition, we used a different curve extraction method and sulcal depth definition for this study. Figure 1 illustrates an overview of the proposed pipeline.
Figure 1.
A schematic overview of the proposed pipeline. The cortical surface of the left and right hemispheres is reconstructed from an MR image. The surface parcellation is done by transferring the volumetric labels onto the cortical surface. The sulcal depth is computed from distance between the cortical surface and its cerebral hull. Sulcal curves are computed over the reconstructed cortical surface to refine each surface ROI. The statistical analysis is performed on the each sulcal region-based ROI.
2. METHOD
2.1 Data Acquisition
A T1-weighted MP-RAGE (FoV of 256 mm × 256 mm, 1 mm × 1 mm × 1 mm, TE=2 ms, TR=8.95 ms, and TI=643 ms) acquired on a 3T scanner (Achieva, Philips Medical Sys-tems, Best, The Netherlands) with a 32-channel head coil was collected on 67 subjects: 38 healthy controls and 29 individuals with schizophrenia. T1-weighted image was segmented and the while whole cortical surfaces were reconstructed via using the MaCRUISE pipeline.15
For cortical region segmentation, each target image was first registered to the MNI 305 atlas with an affine transformation, and then N4 bias correction was applied. The Advanced Normalization Tools (ANTs)16 software package was applied to the atlas and target images. Deformation of image and label volumes for the atlas to the target space was performed with bi-cubic and nearest-neighbor interpolation respectively. The registered label volumes were then combined together with non-local spatial STAPLE,17 and AdaBoost correction was applied. Each voxel in the brain was then assigned to one of the 133 labels (including background) using the BrainCOLOR protocol *. T1-weighted image labels were down-sampled using the multi-label interpolation technique in ANTs and the segmented image was brought back to the original target space by computing the ANTs inverse transformation. Finally, we merged multiple labels into 4 full ROIs: prefrontal (PFC), parietal (PAR), occipital (OCC), and temporal (TMP) lobes.
2.2 Sulcal Depth
The sulcal depth computation consists of two main steps: 1) cerebral hull creation of the cortical surface and 2) geodesic distance computation between two surface interfaces.
2.2.1 Theoretical Background
We briefly review wavefront propagation as previously summarized in.18 Given a medium Ω and its boundary ∂Ω in ℝ3, the minimum travel-time from one (or multiple) source ∈ ∂Ω to a point x ∈ Ω in the medium, T(x), follows the propagation equation for some propagation speed function F:
| (1) |
Such a formulation of the wavefront propagation is the so-called Hamilton-Jacobi partial differential equation (H-J PDE). A special case of the H-J PDE is as known as the eikonal equation that solves the wavefront propagation with a constant speed function α(x) along every direction. Therefore, the speed function F becomes
| (2) |
For M = I, this simplifies the H-J PDE (1) to
| (3) |
The solution provides a travel-time map T (or geodesic distance) from ∂Ω within Ω.
2.2.2 Cerebral Hull
For the cerebral hull creation, we used the same approach described in.5 Given a cortical surface M, we create its cerebral hull that tightly envelops M by closing sulci. As proposed in,19 we first voxelize M to make a binary mask in the volumetric space, and then a 3D morphological closing operation is applied on M to close sulci. Since the left and right hemispheres are located quite close together, we consider them independently here to avoid overlapping their voxelized contours. This can be done by finding the largest connected component and cutting the mask along the sagittal plane that intersects the center of the mask. Once we have two separated hemispheres, we create an cerebral hull of each. We empirically use the structural element of the morphological operation as a sphere of 25 mm diameter. Although the diameter is larger than that of,19 we found that this diameter is sufficient enough to cover any sulci. This results in an cerebral hull H in the volumetric space.
2.2.3 Geodesic Distance
We compute geodesic distance from H to M. This can be achieved by solving a special eikonal equation with a constant speed (3). We again voxelize M and H to define a medium between them for the wavefront propagation. Let Mout and Hin be the exterior voxels of ∂M and the interior voxels of ∂H. The medium is then given by
| (4) |
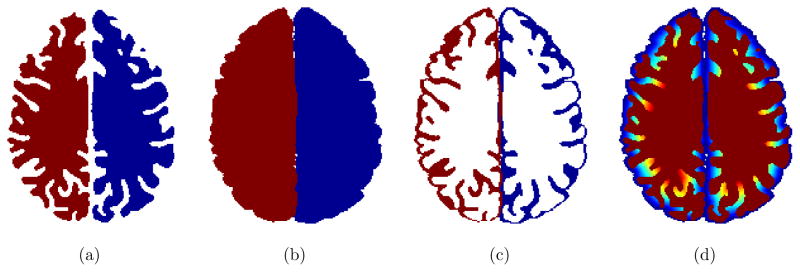
By setting T(∂H) = 0 as sources of the wavefront propagation, sulcal depth is therefore measured at T(∂M) after the propagation. We use the ordered upwind method having O(NlogN) complexity akin to Dijkstra’s shortest path finding, where N is the number of discrete points over Ω.18 Figure 3 shows an overall procedure of the sulcal depth computation for an example slice.
Figure 3.
Sulcal depth computation. (a) Interiors of the cortical surface are filled in the volumetric space. (b) The cerebral hull is obtained by closing sulci via a 3D spherical morphological closing operation. (c) The volumetric Boolean operation defines the intersection between the exterior of the cortical surface and the interior of the cerebral hull, which is severed as a medium between those two interfaces. (d) The geodesic distance is computed within the medium by solving an eikonal equation. Note that the illustration shows a single slice in the volumetric space. The actual sulcal depth computation (wavefront propagation) is performed across multiple slices of the volume.
2.3 Sulcal Fundic Region Segmentation
We use the curve extraction method proposed by.11 Briefly, the idea of the curve extraction as follows. Given a triangulated mesh M with a set of vertices V, the objective is to find a subset U ⊆ V that consists of sulcal points located at the sulcal fundic region so as to represent sulcal curves. A set of candidate points are initially selected by a simple threshold of the maximal negative principal curvature. At each candidate point v ∈ V, the closed loop that contains v with the maximal negative curvature is obtained by finding the intersection between M and the principal plane. A candidate point is added to U if it is preserved after line simplification. Sulcal curves are then delineated along the selected points ∈ U, regularized by a curve smoothing term. The final curves are of a piece-wise point set constrained by curvature smoothness. These extracted curves give spatial information of the sulcal fundic regions. Note that the sulcal fundic regions cover only 2.49% of the entire cortical surface.
3. RESULTS
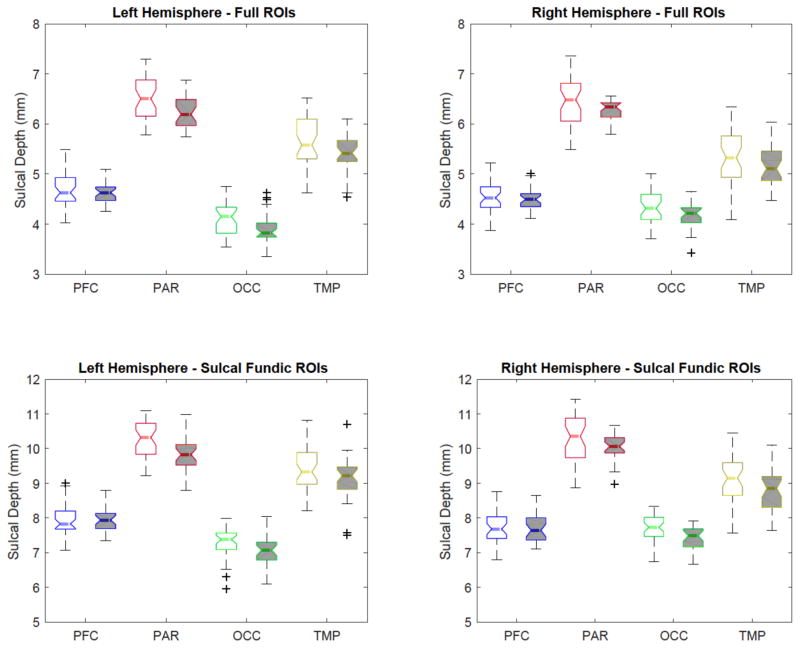
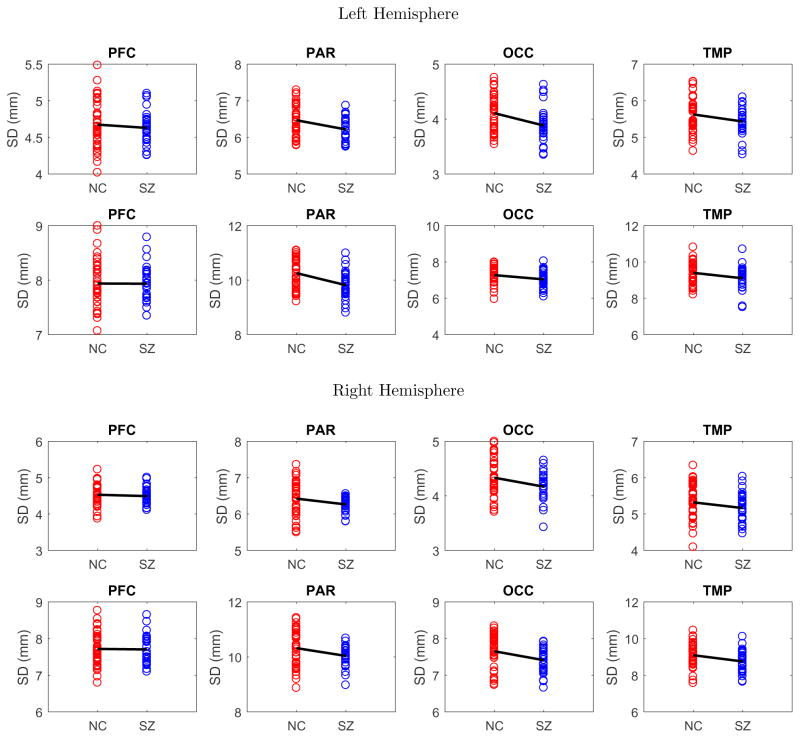
For each ROI, we measured the average sulcal depth in the entire region and along the sulcal curves. In Fig. 4, a percentile statistics of the sulcal depth is shown for both normal healthy control and schizophrenia groups. As expected, the sulcal depth is measured deeper in the sulcal fundic ROIs than in the full ROIs since the sulcal depth is only measured along the extracted sulcal curves. We applied a two-sample t-test to find sulcal depth difference between normal healthy control and schizophrenia groups. We then corrected p-values for multi-comparisons using a standard false-positive discovery rate (FDR).20 Overall, in both full ROIs- and sulcal fundic ROIs-based analyses, the schizophrenia group has shallower sulcal depth as summarized in Table 1. In particular, we found that statistically significant difference in the parietal, occipital, and temporal lobes between the two groups while controlling FDR at 0.1 (the threshold is chosen according to21). It is noteworthy that the temporal and right parietal lobes were not detectable with statistical significance in full ROIs. Also, these revealed regions are agreed with several existing studies that found statistically significant difference in those regions.22–24 As discussed in,22, 25 one of the possible reasons for the sulcal depth difference could be due to the morphological degeneration of the schizophrenia group during loss of gray matter volume.
Figure 4.
A percentile distribution of normal healthy control and schizophrenia groups. The healthy and schizophrenia groups are represented by blank and gray boxes, respectively.
Table 1.
Statistics of sulcal depth difference between normal healthy control and schizophrenia groups. p-values are corrected after multiple-comparison corrections using FDR at 0.1. A statistically significant difference is revealed in the parietal, occipital, and temporal lobes after the correction.
| Full ROIs | ||||||||
|---|---|---|---|---|---|---|---|---|
|
| ||||||||
| PFC | PAR | OCC | TMP | |||||
|
| ||||||||
| lh | rh | lh | rh | lh | rh | lh | rh | |
| mean (mm) | 0.04 | 0.04 | 0.25 | 0.16 | 0.22 | 0.16 | 0.19 | 0.16 |
| p-value | 0.51 | 0.57 | 0.01 | 0.07 | 0.01 | 0.03 | 0.07 | 0.15 |
| Sulcal Fundic ROIs | ||||||||
|---|---|---|---|---|---|---|---|---|
|
| ||||||||
| PFC | PAR | OCC | TMP | |||||
|
| ||||||||
| lh | rh | lh | rh | lh | rh | lh | rh | |
| mean (mm) | 0.00 | 0.01 | 0.44 | 0.28 | 0.23 | 0.24 | 0.30 | 0.34 |
| p-value | 0.97 | 0.89 | 0.00 | 0.03 | 0.04 | 0.02 | 0.05 | 0.03 |
4. CONCLUSION
We presented a surface-based analysis refined by sulcal region-based ROIs with cortical folding degeneration in schizophrenia. Rather than focusing on full ROIs, we refined those ROIs into sulcal fundic regions along automatically extracted sulcal curves by filtering out other cortical regions. In the experiment, we observed that the average sulcal depth of the schizophrenia group is shallower than in the normal healthy control group over all the ROIs. Moreover, the proposed analysis revealed statically significant difference in the parietal, occipital, and temporal lobes between the healthy normal and schizophrenia groups, which is not fully captured by a conventional analysis that uses full ROIs. Since this work only considers sulcal depth for a group difference analysis, interacting with several fixed effects like demographic information or any other morphometry (e.g., cortical thickness) would make a future analysis more powerful. It could be also interesting to extend this idea to the labeled major sulcal curves and to perform a sulcal region-based analysis.
Figure 2.
A randomly chosen subject with (a) surface parcellation, (b) sulcal curves labeled by ROIs, and (c) sulcal depth. The surface parcellation is obtained by volumetric segmentation to define several cortical ROIs corresponding to the major lobes of the brain. The sulcal curves are then labeled by each ROI. The statistics of sulcal depth is finally performed within each sulcal fundic ROI.
Figure 5.
Sulcal depth difference between normal healthy control (red) and schizophrenia (blue) groups: (1st row) left hemisphere with full ROIs, (2nd row) left hemisphere with sulcal fundic ROIs, (3rd row) right hemisphere with full ROIs, and (4th row) right hemisphere with sulcal fundic ROIs.
Acknowledgments
This research was supported by NSF CAREER 1452485, NIH R01EB017230 (Landman), R01MH102266 (Woodward), and VICTR/VISE. This study was in part using the resources of the Advanced Computing Center for Research and Education (ACCRE) at Vanderbilt University, Nashville, TN. This project was supported in part by ViSE/VICTR VR3029 and the National Center for Research Resources, Grant UL1 RR024975-01, and is now at the National Center for Advancing Translational Sciences, Grant 2 UL1 TR000445-06.
Footnotes
References
- 1.Koenderink JJ, van Doorn AJ. Surface shape and curvature scales. Image and vision computing. 1992;10(8):557–564. [Google Scholar]
- 2.Kim SH, Lyu I, Fonov VS, Vachet C, Hazlett HC, Smith RG, Piven J, Dager SR, Mckinstry RC, Pruett JR, et al. Development of cortical shape in the human brain from 6 to 24months of age via a novel measure of shape complexity. NeuroImage. 2016;135:163–176. doi: 10.1016/j.neuroimage.2016.04.053. [DOI] [PMC free article] [PubMed] [Google Scholar]
- 3.Yun HJ, Im K, Yang JJ, Yoon U, Lee JM. Automated sulcal depth measurement on cortical surface reflecting geometrical properties of sulci. PloS one. 2013;8(2):e55977. doi: 10.1371/journal.pone.0055977. [DOI] [PMC free article] [PubMed] [Google Scholar]
- 4.Schaer M, Cuadra MB, Tamarit L, Lazeyras F, Eliez S, Thiran J. A surface-based approach to quantify local cortical gyrification. Medical Imaging, IEEE Transactions on. 2008;27(2):161–170. doi: 10.1109/TMI.2007.903576. [DOI] [PubMed] [Google Scholar]
- 5.Lyu I, Kim SH, Bullins J, Gilmore JH, Styner MA. Novel local shape-adaptive gyrification index with application to brain development. International Conference on Medical Image Computing and Computer-Assisted Intervention; Berlin Heidelberg: Springer; 2017. accepted. [Google Scholar]
- 6.Fischl B, Van Der Kouwe A, Destrieux C, Halgren E, Ségonne F, Salat DH, Busa E, Seidman LJ, Goldstein J, Kennedy D, et al. Automatically parcellating the human cerebral cortex. Cerebral cortex. 2004;14(1):11–22. doi: 10.1093/cercor/bhg087. [DOI] [PubMed] [Google Scholar]
- 7.Desikan RS, Ségonne F, Fischl B, Quinn BT, Dickerson BC, Blacker D, Buckner RL, Dale AM, Maguire RP, Hyman BT, et al. An automated labeling system for subdividing the human cerebral cortex on mri scans into gyral based regions of interest. Neuroimage. 2006;31(3):968–980. doi: 10.1016/j.neuroimage.2006.01.021. [DOI] [PubMed] [Google Scholar]
- 8.Destrieux C, Fischl B, Dale A, Halgren E. Automatic parcellation of human cortical gyri and sulci using standard anatomical nomenclature. Neuroimage. 2010;53(1):1–15. doi: 10.1016/j.neuroimage.2010.06.010. [DOI] [PMC free article] [PubMed] [Google Scholar]
- 9.Kent J, Mardia K, West J. Ridge curves and shape analysis. The British Machine Vision Conference. 1996;1996:43–52. [Google Scholar]
- 10.Shi Y, Thompson PM, Dinov I, Toga AW. Hamilton–jacobi skeleton on cortical surfaces. Medical Imaging, IEEE Transactions on. 2008;27(5):664–673. doi: 10.1109/TMI.2007.913279. [DOI] [PMC free article] [PubMed] [Google Scholar]
- 11.Lyu I, Kim M, Styner S. Medical Imaging 2015: Image Processing. Vol. 9413. SPIE; 2015. Automatic sulcal curve extraction on the human cortical surface; pp. 941324–1–941324–7. [DOI] [PMC free article] [PubMed] [Google Scholar]
- 12.Shi Y, Tu Z, Reiss AL, Dutton RA, Lee AD, Galaburda AM, Dinov I, Thompson PM, Toga AW. Joint sulcal detection on cortical surfaces with graphical models and boosted priors. IEEE transactions on medical imaging. 2009;28(3):361–373. doi: 10.1109/TMI.2008.2004402. [DOI] [PMC free article] [PubMed] [Google Scholar]
- 13.Lyu I, Seong JK, Shin SY, Im K, Roh JH, Kim MJ, Kim GH, Kim JH, Evans AC, Na DL, et al. Spectral-based automatic labeling and refining of human cortical sulcal curves using expert-provided examples. Neuroimage. 2010;52(1):142–157. doi: 10.1016/j.neuroimage.2010.03.076. [DOI] [PubMed] [Google Scholar]
- 14.Seong J, Im K, Yoo S, Seo S, Na D, Lee J. Automatic extraction of sulcal lines on cortical surfaces based on anisotropic geodesic distance. NeuroImage. 2010;49(1):293–302. doi: 10.1016/j.neuroimage.2009.08.013. [DOI] [PubMed] [Google Scholar]
- 15.Huo Y, Plassard AJ, Carass A, Resnick SM, Pham DL, Prince JL, Landman BA. Consistent cortical reconstruction and multi-atlas brain segmentation. NeuroImage. 2016;138:197–210. doi: 10.1016/j.neuroimage.2016.05.030. [DOI] [PMC free article] [PubMed] [Google Scholar]
- 16.Avants BB, Tustison NJ, Song G, Cook PA, Klein A, Gee JC. A reproducible evaluation of ants similarity metric performance in brain image registration. Neuroimage. 2011;54(3):2033–2044. doi: 10.1016/j.neuroimage.2010.09.025. [DOI] [PMC free article] [PubMed] [Google Scholar]
- 17.Asman AJ, Landman BA. Non-local staple: An intensity-driven multi-atlas rater model. International Conference on Medical Image Computing and Computer-Assisted Intervention; Springer; 2012. pp. 426–434. [DOI] [PMC free article] [PubMed] [Google Scholar]
- 18.Sethian JA, Vladimirsky A. Ordered upwind methods for static hamilton–jacobi equations: Theory and algorithms. SIAM Journal on Numerical Analysis. 2003;41(1):325–363. [Google Scholar]
- 19.Kao CY, Hofer M, Sapiro G, Stern J, Rehm K, Rottenberg DA. A geometric method for automatic extraction of sulcal fundi. IEEE transactions on medical imaging. 2007;26(4):530–540. doi: 10.1109/TMI.2006.886810. [DOI] [PubMed] [Google Scholar]
- 20.Benjamini Y, Hochberg Y. Controlling the false discovery rate: a practical and powerful approach to multiple testing. Journal of the royal statistical society. Series B (Methodological) 1995:289–300. [Google Scholar]
- 21.Genovese CR, Lazar NA, Nichols T. Thresholding of statistical maps in functional neuroimaging using the false discovery rate. Neuroimage. 2002;15(4):870–878. doi: 10.1006/nimg.2001.1037. [DOI] [PubMed] [Google Scholar]
- 22.Thompson PM, Vidal C, Giedd JN, Gochman P, Blumenthal J, Nicolson R, Toga AW, Rapoport JL. Mapping adolescent brain change reveals dynamic wave of accelerated gray matter loss in very early-onset schizophrenia. Proceedings of the National Academy of Sciences. 2001;98(20):11650–11655. doi: 10.1073/pnas.201243998. [DOI] [PMC free article] [PubMed] [Google Scholar]
- 23.Csernansky JG, Gillespie SK, Dierker DL, Anticevic A, Wang L, Barch DM, Van Essen DC. Symmetric abnormalities in sulcal patterning in schizophrenia. Neuroimage. 2008;43(3):440–446. doi: 10.1016/j.neuroimage.2008.07.034. [DOI] [PMC free article] [PubMed] [Google Scholar]
- 24.Tohid H, Faizan M, Faizan U. Alterations of the occipital lobe in schizophrenia. Neurosciences. 2015;20(3):213. doi: 10.17712/nsj.2015.3.20140757. [DOI] [PMC free article] [PubMed] [Google Scholar]
- 25.Vita A, De Peri L, Deste G, Sacchetti E. Progressive loss of cortical gray matter in schizophrenia: a meta-analysis and meta-regression of longitudinal mri studies. Translational psychiatry. 2012;2(11):e190. doi: 10.1038/tp.2012.116. [DOI] [PMC free article] [PubMed] [Google Scholar]


