

Abstract
Background:
Tremor is one of the most common symptoms of Parkinson's disease (PD), which is widely being used in the diagnosis procedure. Accurate estimation of PD tremor based on Unified PD Rating Scale (UPDRS) provides aid for physicians in prescription and home monitoring. This article presents a robust design of a classification system to estimate PD patient's hand tremors and the results of the proposed system as compared to the UPDRS.
Methods:
A smartphone accelerometer sensor is used for accurate and noninvasive data acquisition. We applied short-time Fourier transform to time series data of 52 PD patients. Features were extracted based on the severity of PD patients' hand tremor. The wrapper method was employed to determine the most discriminative subset of the extracted features. Four different classifiers were implemented for achieving best possible accuracy in the estimation of PD hand tremor based on UPDRS. Of the four tested classifiers, the Naive Bayesian approach proved to be the most accurate one.
Results:
The classification result for the assessment of PD tremor achieved close to 100% accuracy by selecting an optimum combination of extracted features of the acceleration signal acquired. For home health-care monitoring, the proposed algorithm was also implemented on a cost-effective embedded system equipped with a microcontroller, and the implemented classification algorithm achieved 93.8% average accuracy.
Conclusions:
The accuracy result of both implemented systems on MATLAB and microcontroller is acceptable in comparison with the previous works.
Keywords: Classification, home monitoring, Parkinson's tremor, smartphone, supervised learning, Unified Parkinson's Disease Rating Scale
Introduction
Parkinson's disease (PD), the most widespread neurodegenerative illness after Alzheimer's disease, is a chronic disorder causing progressive loss of dopamine-producing brain cells.[1,2] The loss of dopamine in the midbrain induces the following movement disorders in PD patients: rigidity (increase of muscle tone that causes resistance to passive movement throughout the whole range of motion), tremor (involuntary rhythmic oscillations of one or more body parts), bradykinesia (slowness of motion), and hypokinesia (decreased amplitude of motion).[3]
The predominant method for the diagnosis of PD symptoms, such as tremor, is Unified PD Rating Scale (UPDRS).[2] PD motor examinations are being done under a subscale of UPDRS that is briefly described in Table 1. Using this scale, neurologists are able to assess a given PD patient's hand tremor from 0 (absence of tremor) up to 4 (marked; interferes with most activities) [Table 2].
Table 1.
Unified Parkinson's Disease Rating Scale motor items
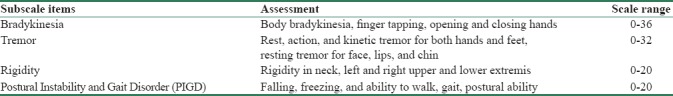
Table 2.
Tremor in Unified Parkinson's Disease Rating Scale
There are three forms of tremulous movements in PD; the resting tremor (RT) and the action tremor which is split into kinetic tremor (KT) and postural tremor (PT). RT can be distinguished from other forms of tremor on the basis of its appearance. The difference is recognizable when the tremoring body part is completely sustained against gravity without volitional muscle contraction, while action tremor appears with volitional muscle contraction. PT occurs while maintaining a posture against gravity and KT occurs during active movement. KT includes task-specific tremor and tremor that is specific to aim-directed movements.[4] The characteristic tremor of PD is indisputably the RT; however, it is extremely important to analyze the possible presence of other sorts of tremor such as the PT or KT.[5]
Although the UPDRS method is a sound clinical tool, it can be error-prone depending on the physician employing it. In addition, the effectiveness of different types of PD hand tremor treatment methods is predominantly evaluated by remotely tracing the frequency and severity of the tremor. This is accomplished by asking patients to fill out questionnaires detailing the type and severity of tremor experienced and requiring them to keep regular journals. However, this self-reporting regularly does not correlate well with expert annotations in a clinical environment.[6] Thus, designing a system or a device to estimate PD hand tremor severity accurately helps neurologists to home-monitor their patients and diagnose them more precisely.
In numerous studies, convenience of acceleration signals in the identification of tremors has been investigated.[5,7,8] Classification systems have been designed to identify different types of tremors such as PD, essential tremor, or physiological tremor.[7,9,10] Historically, investigators[11,12] utilized electromyographic (EMG) signals instead of acceleration signals to identify a given tremor. Recently, some researchers are focusing on the absence or presence and severity of PD tremors and are not utilizing the UPDRS method.[6] In the study by Kotsavasiloglou et al.,[13] a machine learning model was developed to differentiate healthy subjects and PD patients using trajectory of horizontal lines that they draw by an electronic pen on a tablet.[14] used Magnetoencephalography (MEG) to quantify tremor changes after deep brain stimulation (DBS) correlated with clinical score using machine learning models. In the study.[15] the data acquired by wearable device were utilized to design a classification system which differentiates essential tremor from Parkinson's tremor.[16] A classification system was designed for diagnosis between essential tremor and Parkinson's tremor using a smartphone accelerometer.
Previous works were limited to the identification of the types of tremor using either acceleration or EMG signals. A few of them focused on the severity of the tremor in a way that is not interpretable for neurologists. In our work, we have provided a pattern recognition-based system to assess PD hand tremors based on the UPDRS method. Through this instrumental assessment, neurologists would be able to prescribe according to the output of the system. Recording the acceleration signal via a smartphone and implementing the designed classification system on hardware show that our system provides home-monitoring advantage.
Methodology
To implement the classification algorithm, a supervised learning pattern recognition structure is proposed shown in Figure 1. Five steps are included in the algorithm for PD hand tremor assessment. In the first step, the time series acceleration signal is filtered and then passed into the processing block. We have chosen a short-time Fourier transform (STFT) block to transform time domain signal into frequency domain signal as a processing block. Features are extracted relative to PD hand tremor symptoms. To select the most discriminative features, we have implemented a wrapper method as a feature selection block in the fourth step. Finally, the classifier block estimates PD hand tremor using disentangled selected features.
Figure 1.

Classification system block diagram
Data acquisition
We used a Sony Xperia SP Android smartphone, which has a tri-axial accelerometer and gyroscope sensor with 100 Hz sampling frequency for data acquisition. Acquired data can also be transferred via Wi-Fi and Bluetooth to a PC as well as through the Internet network. The data can be stored on an SD card or on a remote cloud service. In this study, recorded signals were transferred to PC through SD card for algorithm design and for use in the evaluation board for feasibility of hardware implementation.
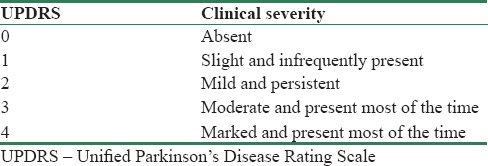
As it was advised by neurologists to make the smartphone wearable, the device was inserted into a bracelet fitted with a strap that allows convenient use.[3] The bracelet is made from elastic material which makes it flexible for applications in different patients. In addition, it has the ability to remain perfectly in contact with the limb and avoids unwanted vibrations and artifacts. A patient posture is shown in Figure 2.
Figure 2.
A subject under test for rest tremor (right) and postural tremor (left)[3]
To evaluate RT, PT, and KT, three different tests were conducted on participants. For RT evaluation, participants sat on a chair maintaining their arms without any contraction on their thighs and the smartphone started to record the acceleration values for 1 min. For PT evaluation, participants were asked to straighten their arm horizontally, parallel to their thighs when they were seated on the chair. In this scenario, the smartphone recorded the acceleration values for 1 min. For KT measurements, the participants sat on a chair while carrying out the index-nose test, stretching the arms forward, and then performing forward and backward hand movements, bringing the index finger to the nose, and touching its tip. All three tests were done on both hands. Expert neurologists of Hazrat Rasoul Akram Hospital of Tehran determined the UPDRS score for each patient.
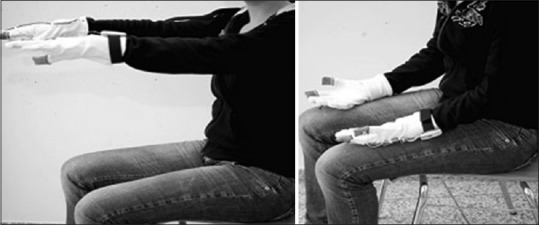
Acceleration signal of two groups of Parkinson patients was acquired as our database. The first group, consisting of 36 patients, was considered as a training set, and the second group, consisting of 16 patients, was the testing set. Both groups covered all UPDRS scores, ranging from 0 to 4, which are detailed in Table 3. All of the participants agreed by voluntary written consent, in compliance with institutional review board procedures.
Table 3.
Characteristics of the database
Signal filtering block
The hand tremor signals were recorded via a tri-axis accelerometer. To avoid signal processing in three dimensions, we calculated root mean square (RMS) of the acquired signal to make it as a one-dimensional signal. Tremor fluctuations disappeared over time. To identify nontremor windows as outliers, acceleration signal was divided into 4 s windows with 50% overlap, compatible with STFT block described in the next session. The standard deviation of each window was calculated; half of the maximum was considered as the upper threshold. Double of the minimum was considered as the lower threshold. Those windows whose standard deviation was not between the lower and upper threshold were removed as outliers. To eliminate noises and other undesired frequency bands, as suggested by earlier works[12,17] on Parkinson's tremors, we applied three bandpass FIR Equiripple filters on the RMS, in three frequency bands, 3−6 Hz for RT, 6−9 Hz in case of PT, and 9−12 Hz for KT.
Processing block
Time series of hand tremor acceleration generates a nonstationary signal with periodic oscillations,[5] but its randomness is not completely arbitrary. This kind of signal contains numerous transitory or nonstationary features such as drift, trends, and abrupt changes.[16] These features contain nonuniform changes in time, such as magnitude and period. They could disappear sharply and appear again. To get more stable information of the signals on the shorter observation periods,[5,8] STFT with 4 s window and 50% overlap using Hamming window were chosen. Since hand tremor signal changes abruptly and PD subjects usually show higher tremor amplitude during stressful conditions,[18] the STFT processing block provides the feasibility of separating tremor and nontremor in 4 s epochs. By this spectral analysis, fundamental frequency components and their relative features can be extracted efficiently.
Feature extraction block
Periodicity and intensity are two major characteristics that neurologists consider in clinical tremor diagnosis.[15,16] The extracted features render these two characteristics numerically in RT, PT, and KT frequency bands. The first extracted feature is fundamental frequency, F0, in each band. F0 is the frequency at which spectra reach maximum value.
To quantify the intensity of hand tremor, maximum and mean value of power spectrum density (PSD) in each frequency band was extracted as second and third features. PSD mean (weighted average) was calculated in each frequency band based on the following equation:
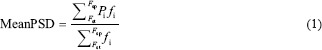
In the Eq. 1, Fst is the start frequency of each band, for instance, if the start frequency of RT band is 3 Hz, then Fst equals 3. Similarly, Fsp is stop frequency, and for RT patients, it is 6 Hz. Pi represents power of the signal at the frequency which is determined by fi. fi is frequency index of the desired tremor band. i is an index which starts from F1st to Fsp by 100 Hz sampling frequency steps.
Different subjects have different PSDs with different spreads. In some cases, the PSD is narrow, and in other cases, it is wide [Figure 3]. To numerically measure this spread, we extracted SF50 and F50 as fourth and fifth features.
Figure 3.

Figure showing the power spectrum density spectrum where the horizontal axis shows the Frequency in Hz and the vertical axis shows the amplitude of power spectrum density, (a) belongs to patient with UPDRS0, (b) to UPDRS2, (c) to UPDRS4, (d-f) are raw signals of Parkinson patients in which (d) belongs to UPDRS0, (e) belongs to UPDRS2, and (f) to UPDRS4. UPDRS – Unified Parkinson's Disease Rating Scale
F50 is the frequency which divides PSD into two parts equally; half of the area under PSD is on the right side of the F50 while the other 50% is on the left side. This provides an indication of the power distribution into the considered band. SF50 represents the frequency range which contains 68% of the PSD that is centered on F50[5] as shown in Figure 4. In some of the patients, the value of F0, fundamental frequency, and F50 was not same; hence, we calculated the difference between these two values as the sixth feature.
Figure 4.

This figure represents how SF50 and F50 vary in different patients. (a) RT at UPDRS Level = 0. (b) RT at UPDRS Level = 2. (c) RT at UPDRS Level = 4. (d) PT at UPDRS Level = 4. UPDRS – Unified Parkinson's Disease Rating Scale; RT – Resting tremor; PT – Postural tremor
Feature selection block
To select the optimum combination of features that are rich in discriminative power, we applied both scalar and vector feature selection approaches. Fisher's discriminant ratio (FDR) was applied as the scalar approach. It was employed to initialize the sequential forward selection (SFS) method as a vector approach. Thus, overfitting was eliminated by reducing the number of the features.[17]
FDR approach ranks the features according to the difference between their mean over their variances[19] [Table 4]. Based on FDR results, we took the PSD weighted average, MeanPSD, as the main feature of the SFS. According to SFS search technique, all possible combinations can be formed, and for each combination, its class separability can be computed.[20] Using this technique increases the accuracy of the classifier but also increases computational cost due to the mutual feedback link between this block and the classifier block. Main purpose of implementation of the feature selection block is dimension reduction; hence, computational cost is negligible. Optimum combination of features for each classifier is mentioned in Table 5 in the Results section.
Table 4.
Fisher's discriminant ratio test result
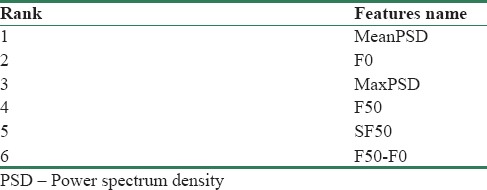
Table 5.
The test accuracy of each classifier with optimum set of features
Classification block
To achieve optimum accuracy, four different classifiers were implemented by considering the combination of extracted features according to the feature selection section. Naive Bayesian, K-nearest neighbor, support vector machine (SVM), and artificial neural network (ANN) were employed in this study. Classifiers such as naive Bayesian are developed around the optimal Bayesian classifier, based on the probability calculation of each class using statistical features of the training data. Classifiers such as SVM draw decision boundaries that separate the classes from the training dataset.[21] Thus, both techniques were utilized. In Bayesian theory, x is assigned to the class ωi if

or

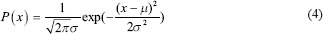
In this paper, we used Gaussian PDF in our naive Bayesian classifier which is defined.[21] In Eq. 4, μ is the mean of a specific feature in one of the classes and σ2 is the variance of the feature.
SVM is a strong classifier which was originally developed for binary problems at Bell Laboratories by Vladimir and Burges and Christopher;[22,23] however, in multiclass applications, its discriminatory power may declines.[24] SVM can be carried out by its different kernels such as linear, polynomial, radial, and bipolar sigmoid bases to achieve the most favorable accuracy.
ANNs' accuracy varies by the number of input features and neurons in hidden layer as well as output layer function.[25] Backpropagation algorithm has been utilized to determine appropriate weights minimizing the error function of our ANN structure.
Results
To form a robust training dataset, 36 PD patients' hand tremor acceleration signals were gathered. To make an independent test dataset, 16 other PD patients' hand tremor signals were acquired. These were distinct from the training set. Both groups' UPDRS was labeled by a team of neurologists. Table 6 shows the accuracy of each classifier before feature selection. All classifiers' inputs were all six extracted features.
Table 6.
The test accuracy of each classifier before feature selection
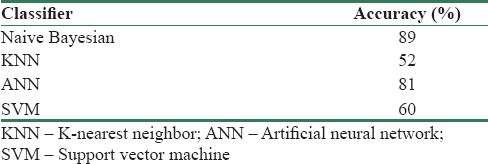
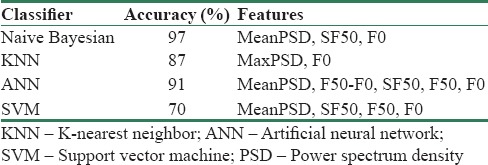
Table 5 represents improved accuracy results after selecting optimum combination of features. In Table 5, the first column indicates different types of classifiers which are used to obtain the best accuracy, the second column numbers are accuracies of each classifier, and the third column indicates the combination of features which give the best results.
Table 5 results of the different classifiers are not evaluated in patients. Those results were derived from using all of the features' values per number of windows in each group of participants. Our test dataset included 16 participants was divided into five groups, 0–4. For each participant's hand tremor, acceleration values were recorded for 1 min on average and separated into 4 s windows. Total number of windows for all of 16 participants in the test data set was 201. The relative accuracies of Table 5 were calculated based on these 201 windows. Table 7 represents results of the different classifiers evaluated in 16 participants of the test subset. For instance, the second row of Table 7 shows that the UPDRS score of all of the 16 participants' tremor has been assessed correctly. For each patient, extracted features in Table 5 in all of the tremor windows fed into classifiers. Average of driven UPDRS scores shows UPDRS score of each patient's hand tremor. As it is shown in Figure 5, A comparison between windowwise accuracy, Table 5, and subject-wise accuracy, Table 7, assessing the UPDRS score of each patient's tremor by taking average of UPDRS scores that is derived from a classifier leads to the best possible result.
Table 7.
The test accuracy of the different classifiers evaluated in patients
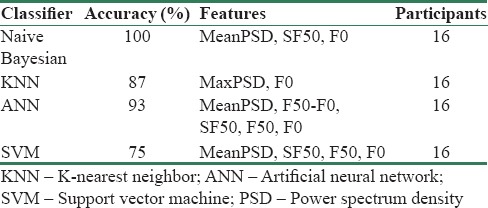
Figure 5.
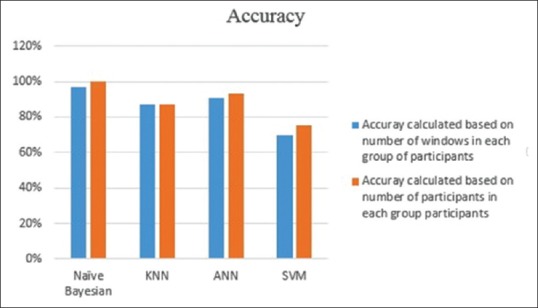
Simple comparison between two different results
Hardware implementation feasibility
Main aim of designing this classification system is taking the place of clinical method of Parkinson patient's tremor assessment, as a portable embedded system. Therefore, after designing a superior algorithm using MATLAB, it is implemented on a microcontroller with Cortex-M4 core Figure 6.
Figure 6.
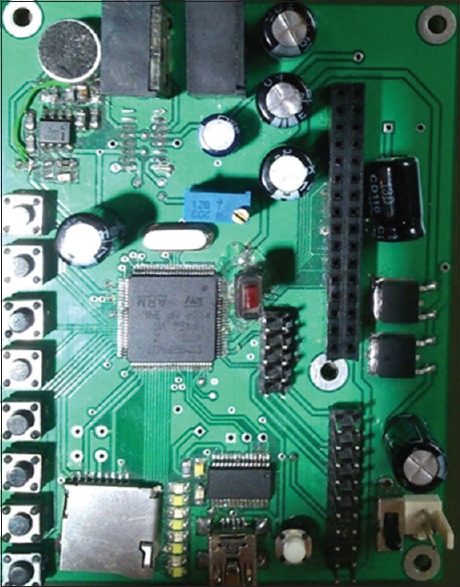
ARM-based microcontroller evaluation board
Due to flexibility of STM32F407VG in floating point computation, also its Cortex-M4 core which encompasses a full set of DSP functions and instructions as well as a memory protection unit, it has been chosen as a processor of evaluation board. Similar to the way the algorithm was designed, this evaluation board could read data which are acquired by a smartphone, and then, it does the designed process and assesses the tremor of a PD patient. Based on numerical result of naive classifier mentioned in Table 5, the pattern recognition structure of Figure 7 has been implemented on a microcontroller with Cortex-M4 core. Numerical result of Table 5 reveals that MeanPSD, SF50, and F0 are the most discriminative features. Therefore, implementation of the feature selection block is not needed. The same training dataset, 36 participants, and testing dataset, 16 participants, were used to develop the designed classification system on the evaluation board. Acquisitions were made at the same time with evaluation board and smartphone. Designed classification system was implemented on microcontroller with Cortex-M4 core by efficient use of memory. The accuracy result of algorithm implementation on the CortexM4-based microcontroller is 94%.
Figure 7.

Block diagram of implemented structure on STM32F407VG
Discussion and Conclusion
In this paper, we proposed a classification system to assess hand tremors of PD patients based on UPDRS. We recruited 1-min recorded acceleration values of 36 different patients as input of the training set of our algorithm. The input signal in the first step was interpolated and filtered through three frequency bands in the case of RT, PT, and KT. An STFT block was applied to the filtered signal to separate extracted features on equal windows. PD patients' hand tremor severity (UPDRS level) varies with time. It was determined that a 4 s window of STFT block is ideal for averaging UPDRS level windows to achieve absolute UPDRS of each patient [Tables 5 and 7]. To achieve optimal accuracy, a feature selection block is applied to select features with higher order of discriminative capability for each classifier [Tables 4 and 6].
To evaluate hardware implementation feasibility of the proposed classification system, it was implemented on STM32F407VG ARM microcontroller. PD tremor estimation by STM32F407VG is about 6% less accurate than the one with MATLAB. This difference is inevitable due to memory limitation of STM32F407VG. MATLAB utilizes 4-16 GB RAM of a PC, whereas the RAM capacity of STM32F407VG is only 192 KB which limits the user to memory-consuming applications. By optimizing the C code of the designed algorithm, 94% accuracy achieved.
Our work is based on a set of algorithms for obtaining an objective classification of tremor according to UPDRS. Our system can replace clinical Parkinson patients' tremor assessment via the UPDRS method with impressive accuracy, which is novel in comparison with previous works in the field. As mentioned in the introduction, most of them are able to detect absence or presence of different types of tremors such as essential tremor, Parkinson's tremor, and cerebellar tremor. There are a few number of presented systems for assessment of Parkinson's tremor-like;[6] however, in their systems, they have utilized a limited training dataset. For instance, Cole et al.[6] used 11 patients in their training database with both accelerometer and EMG signals. In this paper, we presented an economical portable system with impressive accuracy which only utilizes accelerometer data. We have utilized 52 participants' hand tremor acceleration signal to train and test our system. This is the strongest database for developing such a system in comparison with previous works.
The developed system is very appropriate for using in assessment, diagnosis and remote control of a Parkinson patient's ambulatory and home monitoring. It can be connected to the hospital network, via a wireless module of the ARM processor embedded on the board, to give day-to-day details of the patient.
Acquiring data by smartphone make the proposed home monitoring system user-friendly. However, recorded acceleration values of the PT state of specifically elder Parkinson patients by smartphone could have minor inaccuracies. For these patients, keeping their hands straight for 1 min is a source of fatigue, so they have to be asked to do the PT task for only 30 s rather than a longer time period.
A precise assessment of Parkinson's tremors is extremely important, especially during treatment of the disease where it must be determined whether to prescribe certain drugs or tune the electrodes. The electrodes stimulate the brain of patients who have had DBS surgery to diminish their hand tremor. Furthermore, the high correlation with UPDRS allows physicians to have an objective and universal report for the evaluation of patients with PD.
Ninety-four percent accuracy of ARM-based microcontroller shows that a convenient portable system can be used by both Parkinson patients and neurologists as a monitoring tool. The designed classification system can be implemented on smartwatches or smartphones for the same purpose. The proposed home monitoring system was limited by just reporting the UPDRS level of PD patients' hand tremor. To make the system more versatile, working on compilation of other UPDRS factors by including other symptoms of Parkinson's such as rigidity or dyskinesia could be done for multiple-symptom management of these patients. The designed system will make home monitoring possible for Parkinson patients where a cloud-based service is able to gather reports from many patients and deliver these to the neurologist remotely. In addition, this allows neurologists to calibrate and regulate drug therapy based on long-term observations rather than simple outpatient visits.
Financial support and sponsorship
None.
Conflicts of interest
There are no conflicts of interest.
BIOGRAPHIES

Omid Bazgir received the master's degree in electrical engineering from university of Tabriz, and currently pursuing Ph.D. degree of electrical and computer engineering at Texas Tech university. He is currently research assistant at BIDS lab, and his focus of research is on biomedical signal/image processing along with machine learning.
Email: omid.bazgir@ttu.edu

Seyed Amir Hassan Habibi Received Movement disorder fellowship from università cattolica del sacro cuore instituto carlo besta milan italy 2014 And also neurology board certification from Iran university of medical science 2006 He is currently an associate professor with the university of IRAN medical science Tehran Iran His current research interests include Neurological disorder specially movements disorders and DBS.
Email: habibi.sah@iums.ac.ir

Lorenzo Palma received the master's degree (cum laude) in Electronic Engineering in 2012 and the Ph.D. degree in Information Engineering in 2017 from the Polytechnic University of Marche, Italy. In 2017 he had a research grant from Consortium GARR to develop a new system for seismic and structural monitoring based on IPv6 sensors able to provide data for the creation of an Earthquake Early Warning system. He is currently a research fellow at Polytechnic University of Marche. His research interests are IoT, Wireless Sensors Networks, IMU sensors, embedded systems, communication network.
Email: l.palma@univpm.it

Paola Pierleoni received the master's degree in Electronic Engineering in 1991 and the Ph.D. degree in Electrical Engineering in 1995 from the Polytechnic University of Marche. Since 1991 she joined the Department of Information Engineering of the same university where she is currently Assistant Professor in Telecommunications. Her main research topics include network protocols, wireless sensor networks, Internet of Things, signal processing and embedded devices development in Telecommunications. Her main research topics include network protocols, wireless sensor networks, Internet of Things, signal processing and embedded devices development.
Email: p.pierleoni@univpm.it

Saba Nafees is a PhD candidate studying mathematical biology at Texas Tech University, in Lubbock, TX. She graduated from Texas Tech in May of 2014 with a Bachelor's in Mathematics with Highest Honors. Her work focuses on utilizing orthogonal polynomials to characterize genetic data with the goal of discovering how different parts of biological sequences interact with each other and quantifying this interaction.
Email: saba.nafees@ttu.edu
References
- 1.Dorsey ER, Constantinescu R, Thompson JP, Biglan KM, Holloway RG, Kieburtz K, et al. Projected number of people with Parkinson disease in the most populous nations, 2005 through 2030. Neurology. 2007;68:384–6. doi: 10.1212/01.wnl.0000247740.47667.03. [DOI] [PubMed] [Google Scholar]
- 2.Schwarz J, Odin P, Buhmann C, Csoti I, Jost W, Wüllner U, et al. Depression in Parkinson's disease. J Neurol. 2011;258:S336–8. doi: 10.1007/s00415-011-6048-3. [DOI] [PubMed] [Google Scholar]
- 3.Niazmand K, Tonn K, Kalaras A, Fietzek UM, Mehrkens JH, Lueth TC. Quantitative evaluation of Parkinson's disease using sensor based smart glove. In: Computer-Based Medical Systems (CBMS), 2011 24th International Symposium. IEEE. 2011:1–8. [Google Scholar]
- 4.Hess CW, Pullman SL. Tremor: Clinical phenomenology and assessment techniques. Tremor Other Hyperkinet Mov (N Y) 2012;2 doi: 10.7916/D8WM1C41. pii: tre-02-65-365-1. [DOI] [PMC free article] [PubMed] [Google Scholar]
- 5.Pierleoni P, Palma L, Belli A, Pernini L. IEEE. 2014. A real-time system to aid clinical classification and quantification of tremor in Parkinson's disease. In: Biomedical and Health Informatics (BHI), 2014 IEEE-EMBS International Conference; pp. 113–6. [Google Scholar]
- 6.Cole BT, Roy SH, De Luca CJ, Nawab SH. Dynamical learning and tracking of tremor and dyskinesia from wearable sensors. IEEE Trans Neural Syst Rehabil Eng. 2014;22:982–91. doi: 10.1109/TNSRE.2014.2310904. [DOI] [PubMed] [Google Scholar]
- 7.Woods M, Nowostawski M, Franz EA, Purvis M. Parkinson's disease and essential tremor classification on mobile device. Pervasive Mob Comput. 2014;13:1–12. [Google Scholar]
- 8.Jakubowski J, Kwiatos K, Chwaleba A, Osowski S. Higher order statistics and neural network for tremor recognition. IEEE Trans Biomed Eng. 2002;49:152–9. doi: 10.1109/10.979354. [DOI] [PubMed] [Google Scholar]
- 9.Khezri M, Jahed M. Real-time intelligent pattern recognition algorithm for surface EMG signals. Biomed Eng Online. 2007;6:45. doi: 10.1186/1475-925X-6-45. [DOI] [PMC free article] [PubMed] [Google Scholar]
- 10.Ai L, Wang J, Yao R. Classification of Parkinsonian and essential tremor using empirical mode decomposition and support vector machine. Digit Signal Proc. 2011;21:543–50. [Google Scholar]
- 11.Palmes P, Ang WT, Widjaja F, Tan LC, Au WL. Pattern mining of multichannel sEMG for tremor classification. IEEE Trans Biomed Eng. 2010;57:2795–805. doi: 10.1109/TBME.2010.2076810. [DOI] [PubMed] [Google Scholar]
- 12.Palmerini L, Rocchi L, Mellone S, Valzania F, Chiari L. Feature selection for accelerometer-based posture analysis in Parkinson's disease. IEEE Trans Inf Technol Biomed. 2011;15:481–90. doi: 10.1109/TITB.2011.2107916. [DOI] [PubMed] [Google Scholar]
- 13.Kotsavasiloglou C, Kostikis N, Hristu-Varsakelis D, Arnaoutoglou M. Machine learning-based classification of simple drawing movements in Parkinson's disease. Biomed Signal Proc Control. 2017;31:174–80. [Google Scholar]
- 14.Niazmand K, Kalaras A, Dai H, Lueth TC. Comparison of methods for tremor frequency analysis for patients with Parkinson's disease. In: Biomedical Engineering and Informatics (BMEI), 2011 4th International Conference. IEEE. 2011;2:693–7. [Google Scholar]
- 15.Lyons KE, Pahwa R. Handbook of Essential Tremor and Other Tremor Disorders. CRC Press. 2005 [Google Scholar]
- 16.Deuschl G, Raethjen J, Lindemann M, Krack P. The pathophysiology of tremor. Muscle Nerve. 2001;24:716–35. doi: 10.1002/mus.1063. [DOI] [PubMed] [Google Scholar]
- 17.Elble RJ, Pullman SL, Matsumoto JY, Raethjen J, Deuschl G, Tintner R, et al. Tremor amplitude is logarithmically related to 4- and 5-point tremor rating scales. Brain. 2006;129:2660–6. doi: 10.1093/brain/awl190. [DOI] [PubMed] [Google Scholar]
- 18.Elble RJ, Sinha R, Higgins C. Quantification of tremor with a digitizing tablet. J Neurosci Methods. 1990;32:193–8. doi: 10.1016/0165-0270(90)90140-b. [DOI] [PubMed] [Google Scholar]
- 19.Simon R, Radmacher MD, Dobbin K, McShane LM. Pitfalls in the use of DNA microarray data for diagnostic and prognostic classification. J Natl Cancer Inst. 2003;95:14–8. doi: 10.1093/jnci/95.1.14. [DOI] [PubMed] [Google Scholar]
- 20.Mohammad Reza D. Chi-square distance kernel of the gaits for the diagnosis of Parkinson's disease. Biomed Signal Proc Control. 2013;8:66–70. [Google Scholar]
- 21.Theodoridis S, Pikrakis A, Koutroumbas K, Cavouras D. Introduction to Pattern Recognition: A Matlab Approach. Academic Press. 2010 [Google Scholar]
- 22.Bazgir O, Frounchi J, Habibi SA, Palma L, Pierleoni P. A neural network system for diagnosis and assessment of tremor in Parkinson disease patients. 22nd Iranian Conference on Biomedical Engineering (ICBME) 2015 [Google Scholar]
- 23.Vladimir V. The Nature of Statistical Learning Theory. Springer Science & Business Media. 2013 [Google Scholar]
- 24.Burges, Christopher JC. Vol. 2. Springer; 1998. A tutorial on support vector machines for pattern recognition. Data Mining and Knowledge Discovery; pp. 121–167. [Google Scholar]
- 25.Patel S, Lorincz K, Hughes R, Huggins N, Growdon J, Standaert D, et al. Monitoring motor fluctuations in patients with Parkinson's disease using wearable sensors. IEEE Trans Inf Technol Biomed. 2009;13:864–73. doi: 10.1109/TITB.2009.2033471. [DOI] [PMC free article] [PubMed] [Google Scholar]