Abstract
The choice of surface template plays an important role in cross-sectional subject analyses involving cortical brain surfaces because there is a tendency toward registration bias given variations in inter-individual and inter-group sulcal and gyral patterns. In order to account for the bias and spatial smoothing, we propose a feature-based unbiased average template surface. In contrast to prior approaches, we factor in the sample population covariance and assign weights based on feature information to minimize the influence of covariance in the sampled population. The mean surface is computed by applying the weights obtained from an inverse covariance matrix, which guarantees that multiple representations from similar groups (e.g., involving imaging, demographic, diagnosis information) are down-weighted to yield an unbiased mean in feature space. Results are validated by applying this approach in two different applications. For evaluation, the proposed unbiased weighted surface mean is compared with un-weighted means both qualitatively and quantitatively (mean squared error and absolute relative distance of both the means with baseline). In first application, we validated the stability of the proposed optimal mean on a scan-rescan reproducibility dataset by incrementally adding duplicate subjects. In the second application, we used clinical research data to evaluate the difference between the weighted and unweighted mean when different number of subjects were included in control versus schizophrenia groups. In both cases, the proposed method achieved greater stability that indicated reduced impacts of sampling bias. The weighted mean is built based on covariance information in feature space as opposed to spatial location, thus making this a generic approach to be applicable to any feature of interest.
Keywords: Gray matter cortical surface, unbiased template, cortical surface feature space
1. INTRODUCTION
The cerebral cortex is the outermost layer of neural gray matter critical for many brain functions including memory, attention, cognition, language and consciousness[1]. Features that characterize the cortex (including sulcal curves, gyral curves, sulcal depth, curvature and cortical thickness) are important in neuroimaging studies involving these regions [2–4]. Cortical surfaces are widely used for such analysis as they preserve topology [3–9]. In order to study group differences in these regions between control and clinical samples, it is common to align all the cortical surfaces to a common space [10–13]. In this context, representative template space-based approaches have been proposed to studying local individual differences in cortical morphometric measurement due to their ability to represent data involving cortical patterns and other model-based voxel wise parameters mapped onto a common surface in both normal and clinical populations [14, 15]. Prior work has addressed the importance of template surface selection from the perspective of pairwise registration [6, 7, 16]. In a template based registration approach, each surface is mapped to a common template surface in coordinate space by regularizing based on feature information. However, surface-based analyses employing a predefined template might yield undesirable results if the selected template surface is substantially different from the population or if it is biased towards a particular set of surfaces [17]. Template-based registration is dependent on the a priori template specification thus constraining the underlying data to be biased to the selected template. Methods have addressed the issue of dissimilarity between template surface and surfaces of population under consideration by organizing the population of cortical surfaces into pairs with high shape similarity to achieve a higher accuracy by only corresponding such similar pairs [16], while others factored in the pattern of folding across the entire cortical surface in considering the inter-subject average [11].
However, these approaches are still prone to bias towards the majority representation of the underlying population that could pose a problem in cross subject analysis. We propose to address the above limitations using an a priori covariance matrix approach that de-weights subjects with similar features instead of treating all observations as independent instances. This approach uses inverse covariance weighting under the assumption that there is one latent feature of interest from the representative group. An optimal weighted mean is then reconstructed on the basis of that assumption. Features considered in this approach are mean curvature and sulcal depth. Mean curvature captures the mean amount of change with respect to surface normal [8]. Sulcal depth measures the closest distance between a cortical surface and its cerebral hull [13]. In this paper we present an approach for constructing an unbiased mean of cortical surfaces in feature space that is representative of the underlying population while not being biased to multiple representations of the same feature from multiple surfaces by using a priori based covariance information. To simplify the analysis, we use the correlation matrix between scans as an approximation of the true covariance.
This framework is flexible and scalable for selecting the target template space, involving cross-sectional subject analysis, or performing template-based registration. The proposed technique can be factored into group-wise registration [2] to include deweighting based on population information.
2. METHODS
2.1 Data Acquisition
We considered the Kirby dataset [18] that was acquired with scan-rescan imaging sessions on 21 control volunteers. The acquisition protocol includes T1 MPRAGE employing a gradient echo read out with a short TE value (TR/TE/TI=6.7/3.1/842ms) with 240 X 204 X 256 mm FOV and 1 X 1 X 1.2 mm3 resolution acquired in sagittal plane. No fat saturation was employed and the total scan time was 5 min and 56 s. We also included a second dataset with 10 control subjects and 10 individuals with schizophrenia for analysis. The scan protocol for this project included T1 MPRAGE (256 X 256 mm FOV, 1 X 1 X 1 mm, TE=2ms, TR=8.95 ms and TI=643 ms) acquired on a 3T scanner (Achieva, Philips Medical Systems, Best, The Netherlands) with a 32-channel head coil.
2.2 Preprocessing
T1 images are bias corrected using N4 bias correction [19] to account for spatial inhomogeneity. Individual T1 images are then segmented using multi-atlas segmentation [20] that segments the images into 133 BrainColor labels with 132 brain regions and a background[21]. After segmentation, the GM surfaces are derived using multi-atlas segmentation to surface method proposed as Multi-atlas Cortical Reconstruction Using Implicit Surface Evolution (MaCRUISE) [22] where inner, central and outer cortical surfaces are reconstructed by using the topology-preserving geometric deformable surface model. These central surfaces are used in further cortical surface based analysis.
2.3 Feature based template space selection approach
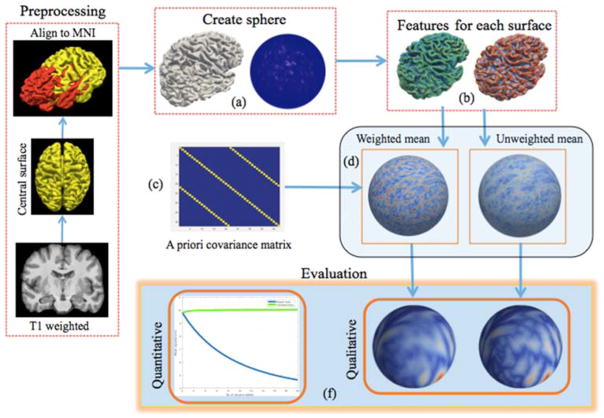
Cortical surfaces are initially aligned to MNI space (http://www.mni.mcgill.ca/) using affine transformation acquired from T1 image using trilinear interpolation. For each T1, gray matter (GM) central surface is reconstructed via an MaCRUISE pipeline and then mapped onto a unit sphere of a standard icosahedron subdivision with 163,842 vertices [12]. Features are generated on central surface after applying 3 smoothing iterations to reduce local noise influences. We compute weighted and un-weighted mean from these features. The weights are represented as the approximated covariance matrix as shown in Figure 1.
Figure 1.
After preprocessing: a) A spherical representation is generated based on central surface. b) Features are computed and resampled along with central surface into 163,842 vertices via icosahedron subdivision. c) The covariance matrix is constructed. d) The weighted mean of features is computed based on weights from covariance matrix. e) The unweighted mean is computed f) Qualitative and quantitative analysis are performed based on weighted and un-weighted mean information.
Again our goal is to build an unbiased mean of surface in feature space. So the idea is to deweight multiple representations of similar data while capturing maximum variance in the population. From this perspective, an a priori covariance matrix is built based on the population information (e.g., demographics, patient status, cortical shapes). For example, in reproducibility analysis scan and rescan entries are provided with the same correspondence in the off diagonal elements. Similarly for psychosis population, subjects belonging to same group are assigned to have correspondence based on setting the off diagonal elements to have the same weighting as the diagonal elements for that group in building the approximated covariance matrix. By taking inverse covariance weighting approach, elements belonging to same group are de-weighted to make it a single representation for underlying population. We compute the mean feature based template using the weights obtained in the previous step. This weighted mean of the surfaces in feature space is then compared with to un-weighted mean based on a vertex wise relative distance metric with respect to baseline for evaluation.
The idea behind the bias compensation is illustrated in a toy example in Figure 2. Here we have six points in 2-D space where three of them belong to one group. If we do not consider this information then the un-weighted average (red *) is biased towards the single group containing three points.
Figure 2.
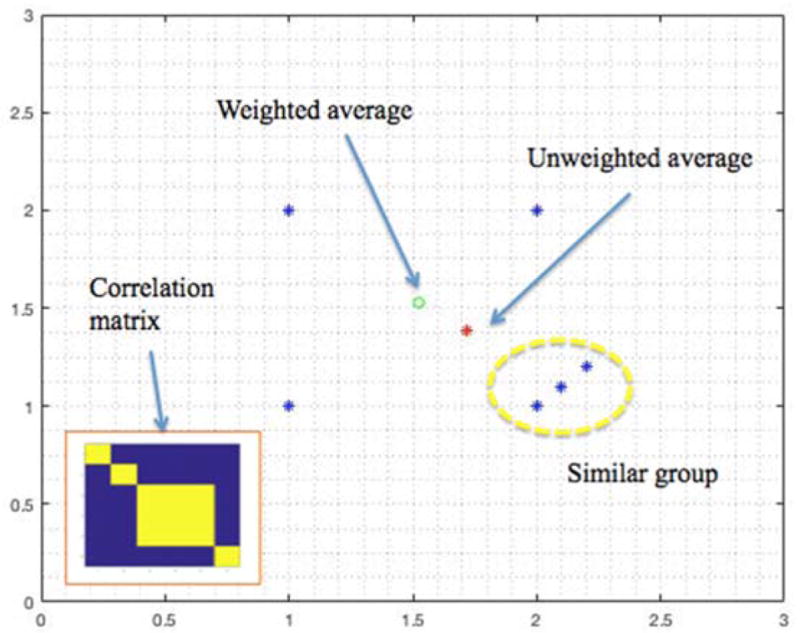
This figure shows a comparison between un-weighted average versus a weighted average for a toy example on the 2D plane. The equal weighting is given to off diagonal elements belonging to similar group (yellow dashed oval) as illustatrated in the correlation matrix presented in lower left hand corner.
By factoring in the information about underlying data in a similarity matrix Σ(X) as indicated below, we can compute a weighted average, by down-weighting three points in the same group to be a single representation thus yielding unbiased mean (green o).
By taking the pseudo inverse also called the Moore-Penrose inverse of above a similarity matrix Σ(X) and taking the sum of the elements we can compute weights associated with each point which are then used in computing vertex wise weighted average as below,
| (1) |
A similar approach can be adapted when computing the average in feature space for template space selection in pairwise registration or group wise registration. Thus, one can address explicit bias towards multiple representations of similar data in the underlying population.
2.4 Quantitative Analysis
The results are validated on a reproducibility dataset using scan-rescan protocols. In order to quantitatively evaluate the proposed unbiased template, we used cortical surface features (mean curvature and sulcal depth) that are commonly used in surface registration approaches. We used two different distance metrics for this quantitative evaluation: 1) Mean square error (MSE) (L2 norm) of the weighted and un-weighted average with respect to baseline data as described for each scenario as described in eq (2) below where Xi is the baseline data and Yi is the corresponding average at each vertex i. 2) Relative distance of weighted average WMDi and relative distance of un-weighted average as MDi in ith iteration from the group averages HCmean and SZmean with equal number of subjects in each group. Vertex-wise differences of the feature measurements are captured based on the relative distance measure with respect to baseline for evaluation.
| (2) |
| (3) |
| (4) |
3. RESULTS
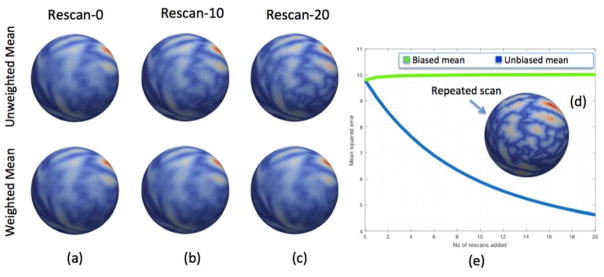
In the Kirby dataset, rescan data is given the same weighting as corresponding scan data in the off-diagonal elements. Inverse covariance weighting from this approximated matrix is taken which is used to compute the weighted average. In order to test the reproducibility of the approach, we have taken 21 subjects with scan data as baseline and computed both weighted and un-weighted mean. As seen in Figure 3(a) the means of the sulcal depth feature obtained with both these approaches are the same when no rescan data is added and 21 subjects are considered to be independent of each other. Then, we added rescan data of one subject giving it equal weighting as its scan data in the approximated covariance matrix. We repeated the addition iteratively for 20 times and captured the weighted and un-weighted means at each iteration. Figure 3(b) and (c) present the qualitative results at 10 and 20 iterations. Figure 3(d) shows the sulcal depth feature information on the sphere for the rescan subject that was used in these iterations. With each iteration of adding rescan data, un-weighted mean comes closer to the vertex wise feature information of the corresponding subject making it biased towards that subject. However, the weighted mean remains unchanged irrespective of the number of items as it de-weights additional duplicate scans based on approximated covariance information. Quantitative values of mean squared error distance of each of the mean to the rescanned subject feature information are presented in Figure 3(e).
Figure 3.
Iterative rescan data example of sulcal depth feature from Kirby dataset. Row 1 is un-weighted mean and row 2 is weighted mean from (a) to (c) with each scenario containing (a) 21 subjects with no rescan data, (b) 21 subjects with 10 repeats of rescan from one of the subject, and (c) 21 subjects with 20 repeats of rescan from one of the subjects. The inlay (d) shows the sulcal depth of subject whose rescan is added iteratively. Plot (e) presents the mean squared distance to rescan subject from un-weighted mean (blue) and weighted mean (green).
In the second application, we used two groups with a control and schizophrenia population. The diagnosis is considered as the prior information in this dataset. For this analysis mean curvature is employed as an evaluation metric and approximated covariance matrix is built based on the diagnosis information. Weights are calculated based on the inverse covariance weighting and corresponding covariance based mean is computed.
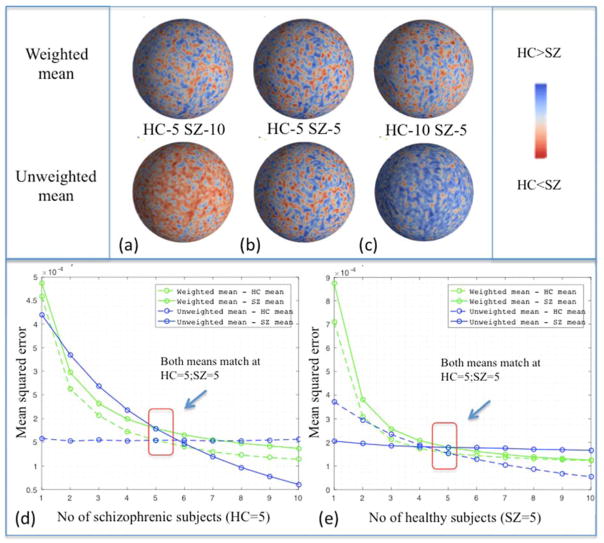
Weighted and unweighted means of mean curvature feature for different number of subjects in each group are shown in the qualitative plot (Figure 4). For the same number of subjects in each group, it can be seen that weighted and unweighted means are equal. The weighted mean shows less variance compared to the unweighted mean while increasing/decreasing the number of subjects in each group
Figure 4.
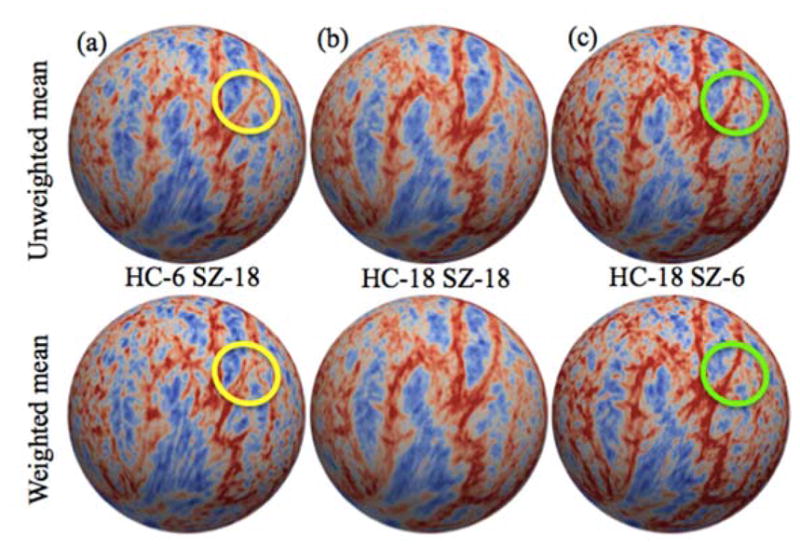
Mean curvature qualitative plot of un-weighted mean and weighted mean with different number of subjects in control and schizophrenia populations. Feature data in each scenario included (a) 6 controls and 18 schizophrenic patients, (b) 18 controls and 18 schizophrenic patients, and (c) 18 controls and 6 schizophrenic patients. Both un-weighted and weighted mean are similar with equal number of subjects in each group. However, the un-weighted mean had higher variance across the sampling strategies. The ovals emphasize qualitative areas of difference.
To compare the effect of varying number of subjects in each group and evaluate bias information, 10 subjects from each group are considered. Mean curvature feature based mean for 10 control subjects HCmean and similarly mean for 10 schizophrenic subjects SZmean are calculated. As we increase the number of subjects in each group, the un-weighted mean becomes biased towards the group with higher number of subjects compared to other as shown in Figure 4. The plot shows the difference in vertex-wise absolute distance of un-weighted and weighted mean with respect to HCmean and SZmean. By adding more control subjects, the un-weighted mean becomes closer to HCmean as opposed to SZmean and vice versa. For the equal number of subjects from each group (HC=5 and SZ=5) the relative distance to both the means from corresponding group averages HCmean and SZmean are equal as highlighted in red box. However, as the number of subjects in one group increases compared to other un-weighted mean is biased towards that group which is also reflected with lower mean square error in Figure 5(d) and (e). Green lines in the plot indicate L2 norm distance of weighted mean from HCmean and SZmean. Blue lines show L2 norm of un-weighted mean from the mean of each group.
Figure 5.
Mean curvature quantitative plot with relative absolute distance of un-weighted mean and weighted mean between control and schizophrenic means. Data are normalized between −1 and 1 between patients with schizophrenia and controls. Feature data in each scenario from qualitative plot included (a) 5 controls and 10 patients with schizophrenia (b) 5 controls and 5 patients with schizophrenia, and (c) 10 controls and 5 patients with schizophrenia. The color bar on the side indicates how close the relative distance is with respect to control mean (blue) and schizophrenia mean (red). The top row is from weighted mean while the lower row is from the un-weighted mean. Mean square error of mean curvature values with respect to control and schizophrenic means with varying number of subjects in each group is shown below. In (d), the number of controls was fixed at 5 and the number of patients with schizophrenia varied from 1 to 10. In (e), the number of patients with schizophrenia was fixed at 5 and the number of control subjects varied from 1 to 10. When the number of subjects in each group is equal, then both the un-weighted and weighted means are equal as highlighted in red box.
4. DISCUSSION
In both the applications, the effect of bias towards the underlying dataset is shown when considering the un-weighted mean, while the weighted mean is stable when capturing the details of the representative features. While we have presented the effect of incorporating covariance in computing the feature based unbiased average for template based pairwise registration, this approach is also adaptable to group wise registration methods [6] where no prior template is needed. In these methods group-wise cortical correspondence is achieved by making use of various cortical features while preserving the topology. As the result still has the possibility of having bias towards the representation of majority of the population, incorporating covariance information at the stage of feature averaging could aid in reducing such bias.
5. CONCLUSION
We have presented feature based unbiased average template surface approach using an a priori covariance matrix. The proposed approach is compared with a typical un-weighted mean by applying to two different applications one with scan/rescan data and another with clinical data with two groups. In both the cases, weighted average is shown to be more stable and less biased when measured in terms of relative distance from group mean or mean squared error. Incorporating covariance based approach at template selection level or when considering the mean of features in group registration methods could potentially minimize the bias. Much work remains to effectively estimate appropriate covariance structures either from study designs or in a data-driven manner.
Acknowledgments
This project was supported in part by the National Institutes of Health under award numbers R01EB017230 & R01MH102266 & National Center for Research Resources, Grant UL1 RR024975-01, and is now at the National Center for Advancing Translational Sciences, RR024975-01 & Grant 2 UL1 TR000445-06. The content is solely the responsibility of the authors and does not necessarily represent the official views of the NIH.
References
- 1.Kandel ER, Schwartz JH, Jessell TM, Siegelbaum SA, Hudspeth AJ. Principles of neural science. McGraw-hill; New York: 2000. [Google Scholar]
- 2.Lyu I, Kim SH, Seong JK, Yoo SW, Evans AC, Shi Y, Sanchez M, Niethammer M, Styner MA. Group-wise cortical correspondence via sulcal curve-constrained entropy minimization. Inf Process Med Imaging. 2013;23:364–375. doi: 10.1007/978-3-642-38868-2_31. [DOI] [PMC free article] [PubMed] [Google Scholar]
- 3.Shi Y, Tu Z, Reiss AL, Dutton RA, Lee AD, Galaburda AM, Dinov I, Thompson PM, Toga AW. Joint sulcal detection on cortical surfaces with graphical models and boosted priors. IEEE Trans Med Imaging. 2009;28(3):361–373. doi: 10.1109/TMI.2008.2004402. [DOI] [PMC free article] [PubMed] [Google Scholar]
- 4.Yun HJ, Im K, Jin-Ju Y, Yoon U, Lee JM. Automated sulcal depth measurement on cortical surface reflecting geometrical properties of sulci. PLoS One. 2013;8(2):e55977. doi: 10.1371/journal.pone.0055977. [DOI] [PMC free article] [PubMed] [Google Scholar]
- 5.Lyu I, Seong J-K, Shin SY, Im K, Roh JH, Kim M-J, Kim GH, Kim JH, Evans AC, Na DL. Spectral-based automatic labeling and refining of human cortical sulcal curves using expert-provided examples. Neuroimage. 2010;52(1):142–157. doi: 10.1016/j.neuroimage.2010.03.076. [DOI] [PubMed] [Google Scholar]
- 6.Thompson PM, Hayashi KM, Sowell ER, Gogtay N, Giedd JN, Rapoport JL, de Zubicaray GI, Janke AL, Rose SE, Semple J, Doddrell DM, Wang Y, van Erp TG, Cannon TD, Toga AW. Mapping cortical change in Alzheimer’s disease, brain development, and schizophrenia. Neuroimage. 2004;23(Suppl 1):S2–18. doi: 10.1016/j.neuroimage.2004.07.071. [DOI] [PubMed] [Google Scholar]
- 7.Mangin JF, Riviere D, Cachia A, Duchesnay E, Cointepas Y, Papadopoulos-Orfanos D, Scifo P, Ochiai T, Brunelle F, Regis J. A framework to study the cortical folding patterns. Neuroimage. 2004;23(Suppl 1):S129–138. doi: 10.1016/j.neuroimage.2004.07.019. [DOI] [PubMed] [Google Scholar]
- 8.Luders E, Thompson PM, Narr KL, Toga AW, Jancke L, Gaser C. A curvature-based approach to estimate local gyrification on the cortical surface. Neuroimage. 2006;29(4):1224–1230. doi: 10.1016/j.neuroimage.2005.08.049. [DOI] [PubMed] [Google Scholar]
- 9.Kim JS, Singh V, Lee JK, Lerch J, Ad-Dab’bagh Y, MacDonald D, Lee JM, Kim SI, Evans AC. Automated 3-D extraction and evaluation of the inner and outer cortical surfaces using a Laplacian map and partial volume effect classification. Neuroimage. 2005;27(1):210–221. doi: 10.1016/j.neuroimage.2005.03.036. [DOI] [PubMed] [Google Scholar]
- 10.Goebel R, Esposito F, Formisano E. Analysis of functional image analysis contest (FIAC) data with brainvoyager QX: From single-subject to cortically aligned group general linear model analysis and self-organizing group independent component analysis. Hum Brain Mapp. 2006;27(5):392–401. doi: 10.1002/hbm.20249. [DOI] [PMC free article] [PubMed] [Google Scholar]
- 11.Fischl B, Sereno MI, Tootell RB, Dale AM. High-resolution intersubject averaging and a coordinate system for the cortical surface. Hum Brain Mapp. 1999;8(4):272–284. doi: 10.1002/(SICI)1097-0193(1999)8:4<272::AID-HBM10>3.0.CO;2-4. [DOI] [PMC free article] [PubMed] [Google Scholar]
- 12.Reuter M, Schmansky NJ, Rosas HD, Fischl B. Within-subject template estimation for unbiased longitudinal image analysis. Neuroimage. 2012;61(4):1402–1418. doi: 10.1016/j.neuroimage.2012.02.084. [DOI] [PMC free article] [PubMed] [Google Scholar]
- 13.Van Essen DC. Surface-based approaches to spatial localization and registration in primate cerebral cortex. Neuroimage. 2004;23(Suppl 1):S97–107. doi: 10.1016/j.neuroimage.2004.07.024. [DOI] [PubMed] [Google Scholar]
- 14.Fischl B, Sereno MI, Dale AM. Cortical surface-based analysis. II: Inflation, flattening, and a surface-based coordinate system. Neuroimage. 1999;9(2):195–207. doi: 10.1006/nimg.1998.0396. [DOI] [PubMed] [Google Scholar]
- 15.Saad ZS, Reynolds RC. Suma. Neuroimage. 2012;62(2):768–773. doi: 10.1016/j.neuroimage.2011.09.016. [DOI] [PMC free article] [PubMed] [Google Scholar]
- 16.Dalal P, Shi F, Shen D, Wang S. Multiple cortical surface correspondence using pairwise shape similarity. Med Image Comput Comput Assist Interv. 2010;13(Pt 1):349–356. doi: 10.1007/978-3-642-15705-9_43. [DOI] [PMC free article] [PubMed] [Google Scholar]
- 17.Lyu I, Kim SH, Seong JK, Yoo SW, Evans A, Shi Y, Sanchez M, Niethammer M, Styner MA. Robust estimation of group-wise cortical correspondence with an application to macaque and human neuroimaging studies. Front Neurosci. 2015;9:210. doi: 10.3389/fnins.2015.00210. [DOI] [PMC free article] [PubMed] [Google Scholar]
- 18.Landman BA, Huang AJ, Gifford A, Vikram DS, Lim IA, Farrell JA, Bogovic JA, Hua J, Chen M, Jarso S, Smith SA, Joel S, Mori S, Pekar JJ, Barker PB, Prince JL, van Zijl PC. Multi-parametric neuroimaging reproducibility: a 3-T resource study. Neuroimage. 2011;54(4):2854–2866. doi: 10.1016/j.neuroimage.2010.11.047. [DOI] [PMC free article] [PubMed] [Google Scholar]
- 19.Tustison NJ, Avants BB, Cook PA, Zheng Y, Egan A, Yushkevich PA, Gee JC. N4ITK: improved N3 bias correction. IEEE Trans Med Imaging. 2010;29(6):1310–1320. doi: 10.1109/TMI.2010.2046908. [DOI] [PMC free article] [PubMed] [Google Scholar]
- 20.Asman AJ, Landman BA. Non-local statistical label fusion for multi-atlas segmentation. Med Image Anal. 2013;17(2):194–208. doi: 10.1016/j.media.2012.10.002. [DOI] [PMC free article] [PubMed] [Google Scholar]
- 21.Klein A, Canton T, Ghosh S, Landman B, Lee J, Worth A. Open labels: online feedback for a public resource of manually labeled brain images. 16th Annu’, Meet. Organ. Hum. Brain Mapp; 2010. [Google Scholar]
- 22.Huo Y, Carass A, Resnick SM, Pham DL, Prince JL, Landman BA. Combining Multi-atlas Segmentation with Brain Surface Estimation. Proc SPIE Int Soc Opt Eng. 2016:9784. doi: 10.1117/12.2216604. [DOI] [PMC free article] [PubMed] [Google Scholar]


