Abstract
Diving mammals use blubber for a variety of structural and physiological functions, including buoyancy, streamlining, thermoregulation, and energy storage. Estimating blubber stores provides proxies for body condition, nutritional status, and health. Blubber stores may vary topographically within individuals, across seasons, and with age, sex, and reproductive status; therefore, a single full-depth blubber biopsy does not provide an accurate measure of blubber depth, and additional biopsies are limited because they result in open wounds. We examined high-resolution ultrasound as a noninvasive method for assessing blubber stores by sampling blubber depth at 11 locations on beluga whales in Alaska. Blubber mass was estimated as a proportion of body mass (40% from the literature) and compared to a function of volume calculated using ultrasound blubber depth measurements in a truncated cone. Blubber volume was converted to total and mass-specific blubber mass estimates based on the density of beluga blubber. There was no significant difference in mean total blubber mass between the 2 estimates (R2 = 0.88); however, body mass alone predicted only 68% of the variation in mass-specific blubber stores in juveniles, 7% for adults in the fall, and 33% for adults in the spring. Mass-specific blubber stores calculated from ultrasound measurements were highly variable. Adults had significantly greater blubber stores in the fall (0.48±0.02kg/kgMB) than in the spring (0.33±0.02kg/kgMB). There was no seasonal effect in juveniles. High-resolution ultrasound is a more powerful, noninvasive method for assessing blubber stores in wild belugas, allowing for precise measurements at multiple locations.
Keywords: beluga whale, blubber stores, body composition, Delphinapterus leucas, ultrasound
Diving mammals use blubber for a wide variety of structural and physiological functions, including buoyancy and streamlining, thermoregulation, and energy storage (Parry 1949; Ryg et al. 1993; Koopman 2006). Blubber stores vary across the body in many species (Doidge 1990; Koopman et al. 2002; Noren and Wells 2009), depending on the degree of reliance as a seasonal energy store, and with age, sex, and reproductive status (Dunkin et al. 2005). Depleted blubber stores from nutritional or environmental stress can decrease an animal’s buoyancy, insulation, and survivorship (Koopman 2006; Miller et al. 2011). Body composition (as a proxy for food availability) has also been correlated with reproductive health (Moore et al. 2001; Miller et al. 2011). In at-risk or declining populations, understanding body composition may provide insights into their nutritional and health status relative to healthy populations (Miller et al. 2011).
The traditional method for directly measuring blubber depth and distribution in free-ranging marine mammals is the full-core biopsy. This is an invasive technique that leaves the animal with an open wound (Geraci and Bruce-Allen 1987). While there are no data suggesting that this method results in long-term adverse health effects, a less invasive, equally accurate method is desirable, especially for depleted or otherwise at-risk populations. Additionally, rarely are more than 1 or 2 locations biopsied on a single individual, which may result in inaccurate calculations of total body blubber stores in species with highly variable blubber distribution (Pitcher 1986; Koopman 1998; Doidge 1990). Skinfold thickness has been used for otariid pups (Jonker and Trites 2000) but has low precision and is not practicable in cetaceans. Body composition can also be obtained from bioelectrical impedance and deuterium dilution (Costa 1987; Oftedal and Iverson 1987; Slip et al. 1992; Arnould et al. 1996); however, this process involves lengthy handling times, multiple needle insertions for injections, and serial blood sampling and is thus prohibitive for free-ranging whales.
High-resolution ultrasound is a noninvasive alternative to biopsy—one that allows for multiple measurements on a single individual in a relatively short time period (< 5min). The use of amplitude modulation (A-mode) echography has been demonstrated as a reliable method to determine blubber and fat thickness of juvenile gray whales (Eschrichtius robustus) when compared to necropsy results (Curran and Asher 1974), particularly as the latter may yield inaccurate measurements due to leaching of oil soon after death before sampling can take place (Krahn et al. 2001). Moore et al. (2001) used high-resolution ultrasound on right whales (Eubalaena glacialis) and found that junctures between different tissue types (e.g., fat and muscle) strongly reflect ultrasonic waves, yielding clear, easily interpreted images. Mellish et al. (2004) reported 99.8% correspondence between ultrasound images and measured blubber depth in Steller sea lions (Eumetopias jubatus) and harbor seals (Phoca vitulina).
The beluga whale (Delphinapterus leucas) is a sub-Arctic and Arctic species that may rely on blubber as a metabolically active energy store to varying degrees depending on the foraging ecology and habitat of different stocks. For example, in the resident populations of the estuarine environments of Bristol Bay and Cook Inlet, Alaska, belugas may rely on blubber as an overwintering energy store, when availability of primary prey (e.g., seasonal anadromous fish spawning runs) is limited (Lensink 1961; Quakenbush et al. 2015). The Cook Inlet population was listed as endangered in 2008 under the United States Endangered Species Act, and reduced prey availability is a leading hypothesis for their failure to recover (National Marine Fisheries Service 2008). Inadequate blubber stores may impact body condition and thermoregulation, as well as reduce the availability of seasonal endogenous energy stores.
Beluga wound healing rates are approximately 5 times longer than those in other Odontocetes, due in part to their thick epidermis and cold, low-salinity habitats (Geraci and Bruce-Allen 1987), which may increase infection risk from biopsy sampling. Also, because beluga whale blubber includes significant fractions of unsaturated fatty acids (Krahn et al. 2004) and high levels of isovaleric acid (Koopman et al. 2003), which have low melting points, beluga blubber is highly fluid; therefore, biopsies are subject to compression and leakage, which compromise accurate measurement of blubber depth and subsequent calculations of total blubber stores and energy content (L. A. Cornick, pers. obs.). Therefore, validating the efficacy of high-resolution ultrasound as an alternative tool is highly valuable for understanding the importance of blubber stores to beluga body condition and health, particularly for the Cook Inlet population.
The objectives of this study were to determine the efficacy of high-resolution ultrasound as a noninvasive method of measuring blubber depth and distribution in beluga whales; improve measurement accuracy in ultrasound images by direct comparison to in situ measurements of intact hunted animals; and model total body blubber stores using ultrasound measurements.
Materials and Methods
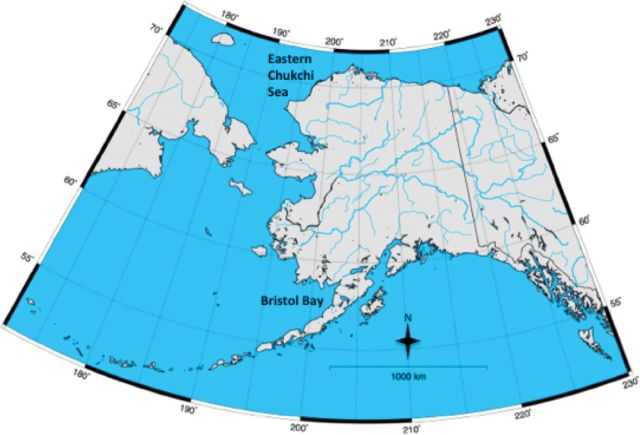
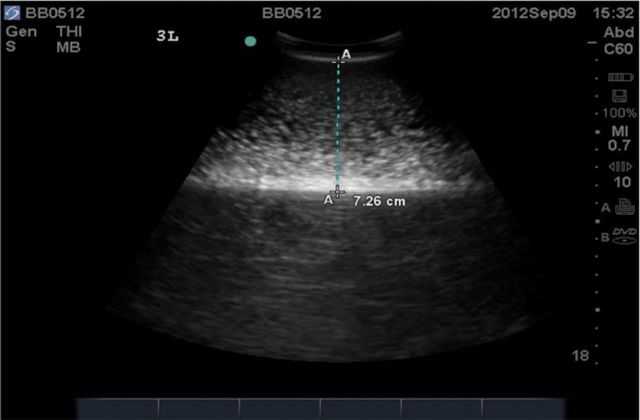
Beluga whales from the Eastern Chukchi Sea (Pt. Lay) and Bristol Bay stocks in Alaska were sampled for this study (Fig. 1). All live-animal research was conducted in accordance with Alaska Department of Fish and Game Animal Care and Use Committee (ACUC) Protocol Numbers 06-16 and 2012-020 and under the National Marine Mammal Laboratory of the Alaska Fisheries Science Center Institutional ACUC Protocol Number AFSC-NWFSC2012-1. For both locations, ultrasound measurements were taken using a portable ultrasound machine (SonoSite Vet180plus; SonoSite Inc., Bothell, Washington) with a C60/5-2 MHz broadband, 60-mm head-width transducer. Blubber depth was measured directly on each ultrasound image using the caliper function, measuring from the bottom of the epidermal layer to the 1st bright white line, which was assumed to be the blubber–muscle interface (Fig. 2; Moore et al. 2001). Marginal images were measured using best judgment based on the totality of images for that animal, as well as the combined set of images.
Fig. 1.
Map of Alaska showing the locations of the Eastern Chukchi Sea (Pt. Lay animals) and Bristol Bay stocks.
Fig. 2.
Example ultrasound image illustrating blubber thickness (dotted line) and blubber–muscle interface (at lower “A”).
Sampling: Pt. Lay
Samples were collected in cooperation with a subsistence hunt conducted from Pt. Lay, Alaska in 2009 (n = 13) and 2010 (n = 8). Sex, color, standard length (cm), and tail fluke width (cm) were recorded for each whale in 2010; only color and blubber measurements were taken in 2009 due to logistical constraints. Blubber depth was measured using B-mode ultrasound at a sample site along the posterior dorsal ridge, and then a 10×10cm section of full dermal and blubber layers was collected at that site from each whale. Excised samples were then measured directly with a ruler. Ruler measurements and ultrasound measurements were performed by different individuals in order to prevent measurement bias. Image measurements were then evaluated against photos of excised samples in order to improve estimations of the blubber–muscle interface for images of free-ranging animals (Fig. 3).
Fig. 3.
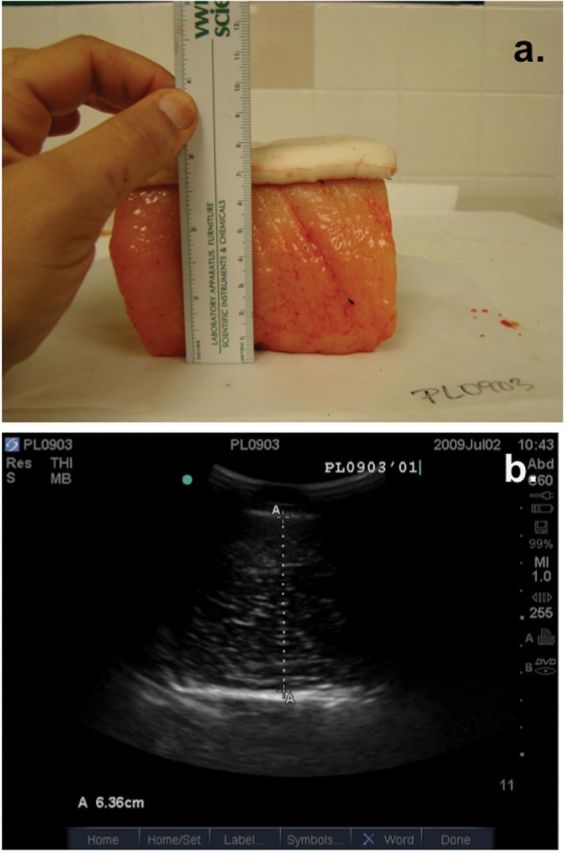
Matched pair of a) excised 10×10cm skin and blubber sample and b) ultrasound image of skin, blubber layer, and blubber–muscle interface from a harvested Pt. Lay beluga whale.
Sampling: Bristol Bay
Twenty-one beluga whales (n = 6 males, 14 females, 1 unknown) were live-captured with nets and passively restrained in belly bands during the spring of 2008 (n = 9 whales) and the fall of 2008 (n = 5 whales) and 2012 (n = 7 whales) as part of a comprehensive health assessment study (Norman et al. 2012). B-mode ultrasound measurements were taken at 11 locations across 1 side of the body starting at the neck and proceeding in equidistant sections to the end of the torso—5 dorsal, 5 lateral, and 1 at the axillary girth just behind the front flipper (Fig. 4). Blubber depth measurements were made directly on the images in the field when practicable and then corrected in postprocessing in order to maximize measurement precision.
Fig. 4.
Ultrasound sampling locations for Bristol Bay whales. AX = axillary; D = dorsal; L = lateral.
Morphological measurements (standard length, axillary girth, postdorsal ridge girth, fluke width) were taken using a standard measuring tape. Because we could not weigh the free-ranging whales, morphological measurements, including body mass, were obtained from captive facilities housing beluga whales (n = 4 males, 2 females). We assumed that body mass in captive animals would be comparable to body mass in free-ranging whales because the Bristol Bay population is healthy and growing, so there should not be an appreciable difference in body condition between the 2 groups. All of the study animals appeared healthy and robust and none were emaciated. We performed a multiple regression analysis of the captive data to determine the best predictor of body mass for free-ranging whales, which resulted in a single model of axillary girth as the best predictor (R2 = 0.94). We then used that model result to calculate estimated body mass (kg) from axillary girth (cm) in the free-ranging whales. Age class was determined by a combination of morphometrics (axillary girth and estimated body mass) and field observations.
Calibration analysis: Pt. Lay
A simple linear regression was used to determine the accuracy of high-resolution ultrasound in predicting blubber depth of full core samples excised from harvested belugas and measured directly with the ruler. Residuals were examined in order to quantify the bias in ultrasound versus direct ruler measurements.
Blubber store analysis: Bristol Bay
Blubber stores were estimated using 2 methods: as a percentage of estimated body mass, where blubber mass was calculated as 40% of estimated body mass (Sergeant and Brodie 1969), and using a truncated cone method derived from Gales and Burton (1987).
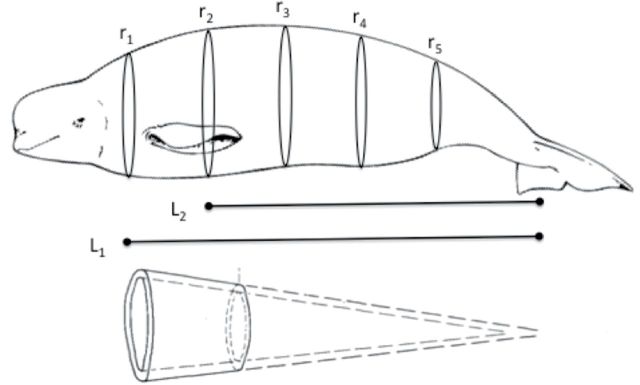
For Method 2, morphometrics were used to estimate total blubber mass as follows. Due to time constraints of handling free-ranging whales in Bristol Bay, only total body length (m) and axillary girth (m) measurements were obtained. Remaining girths were extrapolated based on a combined model of axillary and postdorsal ridge girth measurements from the whales in the present study, and complete girth data from captive whales and 10 additional animals measured in Bristol Bay in September 2013 (Supplementary Data). Mean head and fluke length were calculated as a percentage of total body length (9.9% and 5.5%, respectively) and subtracted from total body length. The remaining trunk length was then subdivided equally into the 5 sections associated with ultrasound measurements, and each section was treated as a truncated cone for subsequent calculations (Fig. 5; Gales and Burton 1987; Noren et al. 2015).
Fig. 5.
Schematic of truncated cone method for calculation of blubber volume. ri = radius; Li = length. The inner cone (total body volume minus blubber depth from ultrasound measurements) is subtracted from the outer cone (total body volume) to obtain the total blubber volume.
The inner radius was calculated by subtracting the ultrasound blubber depth from the outer radius for each section. Radii were used to calculate the volume of the outer cone (blubber and viscera) and inner cone (viscera only) for each section. The blubber volume for each section was then calculated by subtracting the inner cone volume from the outer cone volume. Section volumes were summed to determine total blubber volume. Minimum, mean, and maximum blubber mass were calculated by multiplying the volume estimates by beluga blubber density (0.92±9g/cm3—Doidge 1990). Mean blubber mass was divided by body mass to obtain mass-specific blubber store estimates (kg blubber/kg body mass).
Statistical analyses were performed using StatPlus for Mac (AnalystSoft Inc. 2015) and R (R Development Core Team 2012). One-way analysis of variance was used to examine differences in blubber depth across the 11 ultrasound sampling locations between sex, age class, and season. Minimum, mean, and maximum blubber depths for each of the sampling locations were also calculated for each age class and season in order to examine individual variation. Normality of blubber depth measurements was assessed by visual examination of histograms. Equal variance was examined using Levene’s test. A paired-samples t-test was used to compare total blubber mass estimates between Methods 1 and 2. Mann–Whitney U-tests were used to compare mass-specific blubber stores between seasons and age classes. Simple linear regression was used to examine the predictive power of body mass for assessing blubber stores. Alpha level was set at P < 0.05. All results are reported as means ± 1 SE unless otherwise indicated.
Results
Pt. Lay
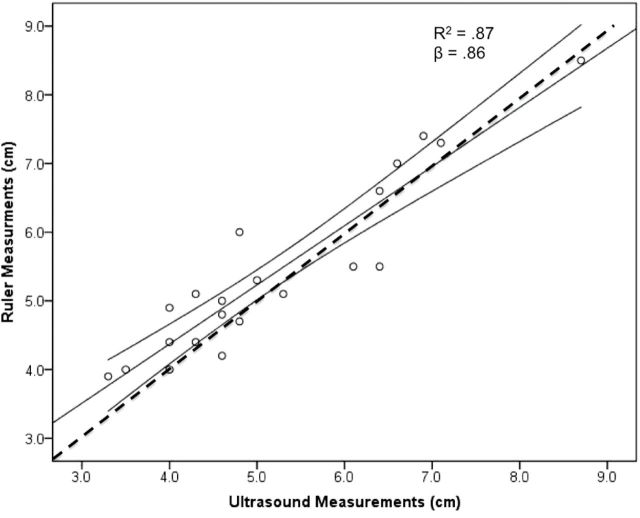
Ultrasound measurements were a significant predictor (F1,19 = 12.65; P < 0.01) of direct ruler measurements of blubber depth, with 87% of the variance explained (Fig. 6). Mean blubber depth measured by ultrasound was 5.21±0.30cm, and mean blubber depth measured by ruler was 5.41±0.28cm, resulting in mean measurement bias of 0.20cm.
Fig. 6.
Simple linear regression of ultrasound measurements versus ruler measurements for Pt. Lay beluga whales. Ultrasound measurements were 87% accurate at predicting in situ blubber depth. Mean measurement bias was 0.20cm calculated from residuals. Dashed line is the 1:1 line.
Bristol Bay
Blubber depth
Mean, minimum, and maximum blubber depths by ultrasound sampling site are summarized in Table 1. Assumptions of normality and equal variance were met. There were no significant differences in blubber depth between sexes, so data were pooled for age class and seasonal comparisons. There were significant differences between adults and juveniles at all body locations, except for D5 and AX. Mean blubber depths for adults in fall were greater than those for spring (Fig. 7) and were significantly different at all but D2, L3, and AX locations. There were no significant differences between seasons at any of the locations in juveniles.
Table 1.
Summary of blubber depth measurements from beluga whales (Delphinapterus leucas) in Bristol Bay. AX = axillary; D = dorsal; L = lateral. NS = nonsignificant.
| Season | Age class | N | Location | Minimum depth (cm) | Mean depth (cm) | SE (cm) | Maximum depth (cm) | Age class | Season |
|---|---|---|---|---|---|---|---|---|---|
| Fall | Adult | 10 | 1D | 4.32 | 5.80 | 0.30 | 6.85 | * | * |
| Fall | Adult | 10 | 2D | 6.25 | 7.74 | 0.31 | 9.37 | * | NS |
| Fall | Adult | 10 | 3D | 7.15 | 8.96 | 0.42 | 10.80 | * | * |
| Fall | Adult | 10 | 4D | 6.69 | 8.87 | 0.50 | 11.23 | * | * |
| Fall | Adult | 10 | 5D | 5.22 | 7.93 | 0.54 | 10.80 | NS | * |
| Fall | Adult | 10 | 1L | 5.13 | 6.69 | 0.36 | 8.68 | * | * |
| Fall | Adult | 10 | 2L | 5.83 | 6.97 | 0.27 | 8.26 | * | * |
| Fall | Adult | 10 | 3L | 5.77 | 7.18 | 0.26 | 8.44 | * | NS |
| Fall | Adult | 10 | 4L | 5.14 | 6.64 | 0.38 | 9.17 | * | * |
| Fall | Adult | 9 | 5L | 4.76 | 5.92 | 0.33 | 7.61 | * | * |
| Fall | Adult | 10 | AX | 4.81 | 7.88 | 0.89 | 15.12 | NS | * |
| Fall | Juvenile | 2 | 1D | 4.00 | 4.42 | 0.42 | 4.84 | * | NS |
| Fall | Juvenile | 2 | 2D | 3.95 | 4.86 | 0.91 | 5.77 | * | NS |
| Fall | Juvenile | 2 | 3D | 4.23 | 5.20 | 0.96 | 6.16 | * | NS |
| Fall | Juvenile | 2 | 4D | 3.75 | 4.74 | 0.99 | 5.73 | * | NS |
| Fall | Juvenile | 2 | 5D | 5.31 | 5.39 | 0.08 | 5.46 | NS | NS |
| Fall | Juvenile | 2 | 1L | 4.63 | 4.99 | 0.36 | 5.34 | * | NS |
| Fall | Juvenile | 2 | 2L | 4.64 | 5.99 | 1.35 | 7.34 | * | NS |
| Fall | Juvenile | 2 | 3L | 4.74 | 4.83 | 0.09 | 4.92 | * | NS |
| Fall | Juvenile | 2 | 4L | 4.52 | 4.87 | 0.35 | 5.21 | * | NS |
| Fall | Juvenile | 2 | 5L | 3.31 | 3.81 | 0.50 | 4.31 | * | NS |
| Fall | Juvenile | 2 | AX | 4.04 | 4.22 | 0.18 | 4.39 | NS | NS |
| Spring | Adult | 4 | 1D | 3.90 | 4.44 | 0.34 | 5.35 | * | * |
| Spring | Adult | 4 | 2D | 6.25 | 6.94 | 0.33 | 7.65 | * | NS |
| Spring | Adult | 4 | 3D | 6.65 | 7.43 | 0.28 | 8.01 | * | * |
| Spring | Adult | 4 | 4D | 5.85 | 6.56 | 0.34 | 7.34 | * | * |
| Spring | Adult | 4 | 5D | 4.34 | 5.43 | 0.71 | 7.44 | NS | * |
| Spring | Adult | 3 | 1L | 4.00 | 5.01 | 0.52 | 6.06 | * | * |
| Spring | Adult | 4 | 2L | 5.46 | 5.87 | 0.17 | 6.14 | * | * |
| Spring | Adult | 4 | 3L | 5.34 | 6.29 | 0.92 | 9.05 | * | NS |
| Spring | Adult | 4 | 4L | 4.52 | 4.80 | 0.20 | 5.39 | * | * |
| Spring | Adult | 4 | 5L | 4.32 | 4.88 | 0.27 | 5.60 | * | * |
| Spring | Adult | 4 | AX | 6.02 | 6.24 | 0.16 | 6.70 | NS | * |
| Spring | Juvenile | 5 | 1D | 3.28 | 3.67 | 0.20 | 4.26 | * | NS |
| Spring | Juvenile | 5 | 2D | 4.79 | 5.50 | 0.24 | 6.13 | * | NS |
| Spring | Juvenile | 5 | 3D | 5.17 | 6.37 | 0.45 | 7.98 | * | NS |
| Spring | Juvenile | 5 | 4D | 4.89 | 5.73 | 0.30 | 6.73 | * | NS |
| Spring | Juvenile | 5 | 5D | 4.48 | 6.07 | 0.58 | 7.86 | NS | NS |
| Spring | Juvenile | 5 | 1L | 4.03 | 4.57 | 0.20 | 5.10 | * | NS |
| Spring | Juvenile | 5 | 2L | 4.42 | 5.26 | 0.29 | 5.78 | * | NS |
| Spring | Juvenile | 5 | 3L | 4.10 | 4.86 | 0.27 | 5.57 | * | NS |
| Spring | Juvenile | 5 | 4L | 3.87 | 4.23 | 0.23 | 5.11 | * | NS |
| Spring | Juvenile | 5 | 5L | 4.00 | 4.28 | 0.17 | 4.92 | * | NS |
| Spring | Juvenile | 5 | AX | 4.79 | 5.34 | 0.26 | 6.23 | NS | NS |
* Statistical significance at P < 0.05.
Fig. 7.
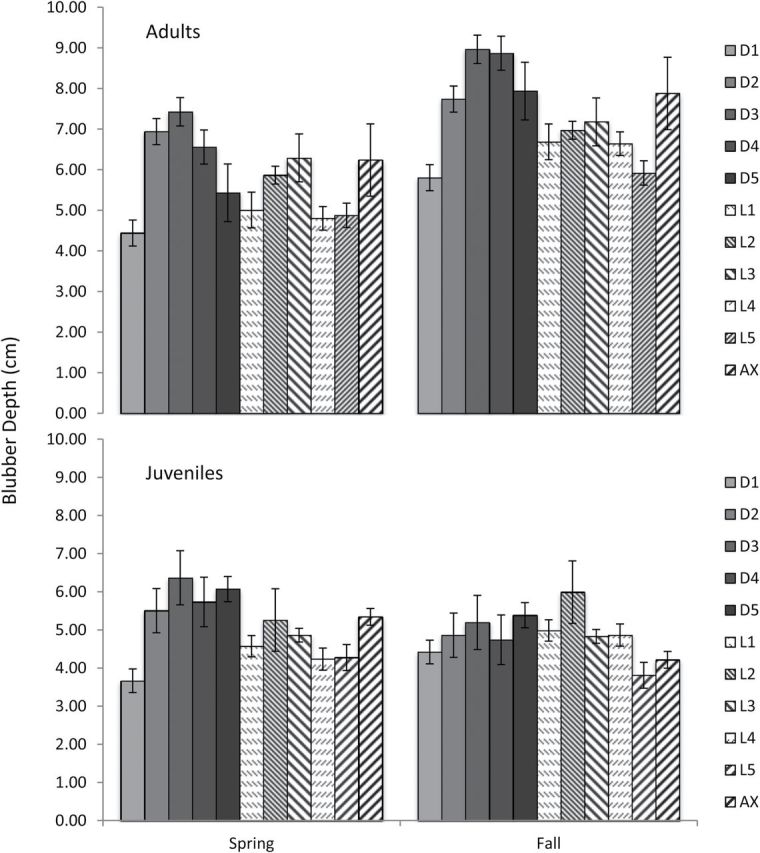
Mean blubber depth of each ultrasound location for Bristol Bay beluga whales by season and age class. Ultrasound measurements are summarized in Table 1.
Blubber mass
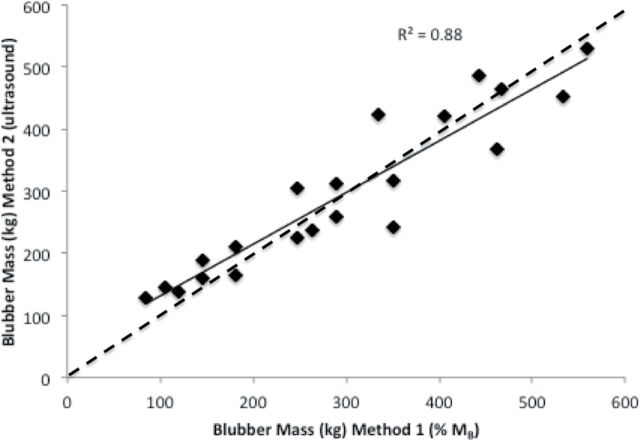
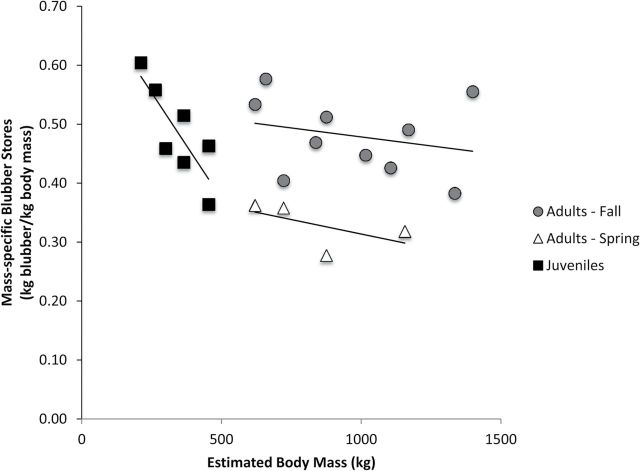
Body mass, blubber volume, and total and mass-specific blubber mass estimates for Methods 1 and 2 are summarized in Table 2. Adults had almost 3 times higher mean body mass than juveniles (936±70.1 and 345±34.9kg, respectively). There was no significant difference in total blubber mass estimates between Method 1 and Method 2 (t20 = 1.72, P = 0.45), and proportion of total body mass (Method 1) explained 88% of the variance in mean total body blubber stores measured using ultrasound (Method 2; Fig. 8). However, mass-specific blubber stores calculated from ultrasound measurements were highly variable; body mass alone predicted only 68% of the variation in mass-specific blubber stores in juveniles, only 7% for adults in the fall and 33% for adults in the spring (Fig. 9).
Table 2.
Summary of morphometrics and blubber volume and mass estimates for beluga whales (Delphinapterus leucas) from Bristol Bay. Mass-specific blubber mass was calculated by dividing the mean blubber mass estimate from Method 2 by the body mass (MB) estimate.
| Season | Age class | Est. mass (kg) | Total length (m) | Blubber volume (m3) | Blubber mass Method 1 (kg) | Min. blubber mass Method 2 (kg) | Mean blubber mass Method 2 (kg) | Max. blubber mass Method 2 (kg) | Mass-specific blubber mass (kg blubber/kg MB) |
|---|---|---|---|---|---|---|---|---|---|
| Fall | Adult | 1335 | 3.96 | 0.49 | 534 | 449 | 453 | 457 | 0.34 |
| Fall | Adult | 722 | 3.42 | 0.34 | 289 | 308 | 312 | 315 | 0.43 |
| Fall | Adult | 1105 | 3.96 | 0.53 | 442 | 483 | 487 | 492 | 0.44 |
| Fall | Adult | 1016 | 3.84 | 0.46 | 406 | 417 | 421 | 425 | 0.41 |
| Fall | Adult | 837 | 3.40 | 0.46 | 335 | 420 | 424 | 428 | 0.51 |
| Fall | Adult | 1169 | 4.14 | 0.50 | 467 | 460 | 464 | 469 | 0.40 |
| Fall | Adult | 875 | 3.56 | 0.35 | 350 | 314 | 317 | 321 | 0.36 |
| Fall | Adult | 1398 | 3.31 | 0.58 | 559 | 526 | 531 | 536 | 0.38 |
| Fall | Adult | 658 | 3.15 | 0.26 | 263 | 234 | 236 | 239 | 0.36 |
| Fall | Adult | 620 | 3.05 | 0.33 | 248 | 301 | 304 | 307 | 0.49 |
| Fall | Juvenile | 211 | 2.72 | 0.14 | 85 | 126 | 128 | 129 | 0.60 |
| Fall | Juvenile | 365 | 2.77 | 0.17 | 146 | 157 | 159 | 160 | 0.44 |
| Spring | Adult | 875 | 3.05 | 0.26 | 350 | 240 | 243 | 245 | 0.28 |
| Spring | Adult | 722 | 3.35 | 0.28 | 289 | 256 | 259 | 261 | 0.36 |
| Spring | Adult | 1156 | 4.12 | 0.40 | 462 | 364 | 368 | 372 | 0.32 |
| Spring | Adult | 620 | 3.20 | 0.24 | 248 | 223 | 225 | 227 | 0.36 |
| Spring | Juvenile | 454 | 3.07 | 0.23 | 182 | 208 | 210 | 212 | 0.46 |
| Spring | Juvenile | 301 | 2.54 | 0.15 | 120 | 137 | 138 | 139 | 0.46 |
| Spring | Juvenile | 365 | 3.12 | 0.20 | 146 | 186 | 188 | 190 | 0.51 |
| Spring | Juvenile | 454 | 2.95 | 0.18 | 182 | 164 | 165 | 167 | 0.36 |
| Spring | Juvenile | 262 | 2.79 | 0.16 | 105 | 145 | 146 | 148 | 0.56 |
Fig. 8.
Simple linear regression of total body blubber stores from Method 1 versus Method 2. There was no significant difference in mean total body blubber mass between methods, with 88% of the variation in Method 2 estimates explained by proportion of body mass (Method 1). Dashed line is the 1:1 line.
Fig. 9.
Allometric regression of mass-specific blubber stores as a function of body mass for juveniles (R2 = 0.68), spring adults (R2 = 0.33), and fall adults (R2 = 0.07). Dashed line represents 40% body mass (Method 1—Doidge 1990).
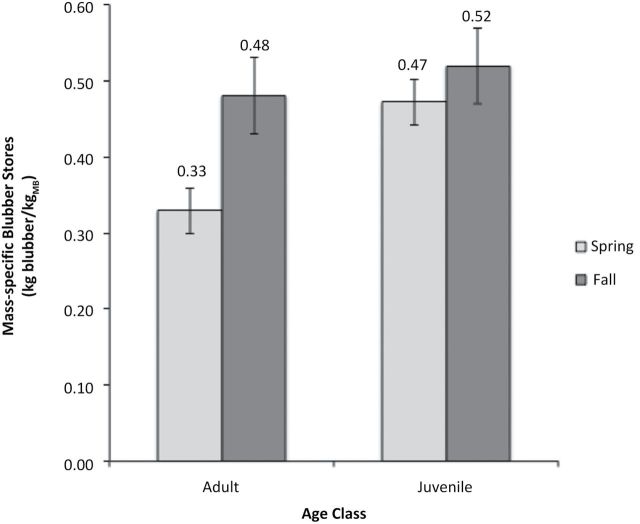
Adults had significantly greater mass-specific blubber stores in the fall (0.48±0.04kg/kgMB) than in the spring (0.33±0.02kg/kgMB; U4,10 = 40, P < 0.01; Fig. 10). There was no significant difference in mass-specific blubber stores between seasons in juveniles (U5,4 = 6, P = 0.16). Juvenile mass-specific blubber stores were greater overall than adult blubber stores in both seasons (0.52±0.08 and 0.48±0.04, respectively, in the fall; 0.47±0.02 and 0.33±0.02, respectively, in the spring); this difference was significant in the spring (U4,5 = 36, P < 0.01).
Fig. 10.
Mean mass-specific blubber mass between seasons for adults and juveniles. Adults had significantly greater mass-specific blubber stores in the fall (0.48±0.02kg/kgMB) than in the spring (0.33±0.02kg/kgMB); indicated by an asterisk. There was no significant difference in mass-specific blubber stores between seasons in juveniles.
Discussion
Blubber depth varied significantly across the body and was distributed similarly to that described in previous studies using beluga whale carcasses (Doidge 1990) and by-caught harbor porpoises (Phocoena phocoena—Koopman 1998). Other cetacean studies have measured thickness at only 1 body location (Moore et al. 2001; Noren and Wells 2009), so it is unknown whether blubber depth distribution varies similarly in other species. Detailed measurements of blubber thickness have been made in a number of pinniped species, including Steller sea lions (Mellish et al. 2004; Mellish 2007), harbor seals (P. vitulina—Rosen and Renouf 1997; Mellish et al. 2004; Mellish 2007; Polasek et al. 2015), harp seals (Phoca groenlandica—Gales and Renouf 1994), ringed seals (Phoca hispida—Ryg et al. 1988), northern (Mirounga angustirostris—Webb et al. 1998) and southern (Mirounga leonina) elephant seals (Slip et al. 1992), crabeater seals (Lobodon carcinophaga—McDonald et al. 2008), and Pacific walrus (Odobenus rosmarus—Quakenbush et al. 1999; Noren et al. 2015). In all of these studies, blubber depth and distribution varied and exhibited seasonal changes, but there was no generalized pattern applicable across taxa.
The patterns of blubber distribution in this study were similar in adults and juveniles, with blubber depth generally increasing from the area posterior to the head up to the dorsal ridge, and the greatest depth in the area immediately posterior to the dorsal ridge (D3). In adults, nearly all of the locations were greater in the fall, with the most significant increases in the 3 dorsal locations posterior to the dorsal ridge (D3, D4, D5) and in the axillary region, suggesting that these might be preferential regions of blubber deposition for energy storage. This pattern is consistent with previous studies on beluga carcasses (Doidge 1990) and harbor porpoises (Koopman 1998).
Body mass alone (Method 1) was a marginal predictor of mass-specific blubber stores in juveniles (68% of the variability explained), and a very poor predictor for mass-specific blubber stores in adults in both the fall (7% of the variability explained) and spring (33% of the variability explained). Given the poor predictive power of Method 1, and the critical role that juvenile survivorship and recruitment plays in population viability, the more precise method of using ultrasound to calculate blubber stores is highly preferable, particularly if an estimate of body composition is needed.
Seasonal differences in blubber mass in adults support the hypothesis that beluga whales in Bristol Bay have reduced access to prey in the winter, and mobilize blubber stores to make up energetic deficits (Quakenbush et al. 2015). The lack of seasonal differences in juveniles is of interest. Spring mean mass-specific blubber stores in juveniles (0.47±0.02) were almost identical to fall mean mass-specific blubber stores in adults (0.48±0.04), which may represent a minimum threshold for thermoregulation. We found no studies specifically investigating a minimum required blubber store; however, McLellan et al. (2002) found that harbor porpoises allocate a variable proportion of their body mass to blubber depending on age class (26% in non-calves, 37% in calves) and suggested this is an adaptation to being a small cetacean living in cold water. Belugas are larger than harbor porpoises but have even higher relative proportions of blubber and live in relatively colder waters. McLellan et al. (2002) also found that proportional blubber stores decreased with body size, which is reflected in this study for animals in the spring, but not in the fall. This is likely a function of seasonal availability of prey in the belugas in this study as noted earlier.
Juvenile belugas may continue to nurse up to 3 years of age (Matthews and Ferguson 2015), so juveniles in this study were also likely nursing, or supplementing independent foraging with periodic suckling, which reduces the need to deposit additional blubber in the summer that can be mobilized during the winter. With such a small buffer, juvenile beluga whales could be vulnerable during periods of reduced prey or milk availability in winter depending on weaning stage and the mother’s fitness, which could lead to an energy imbalance and reduced juvenile survivorship and/or recruitment.
Belugas in Cook Inlet, Alaska are a critically endangered stock with a similar ecology and diet to those in Bristol Bay (Lowry et al. 2008; Quakenbush et al. 2015). It is unknown why the Cook Inlet stock has failed to recover; a possible mechanism could be the lack of energy available during a critical time of year. A similar dataset of blubber measurements for adult and juvenile Cook Inlet belugas in spring and fall could determine how well animals are doing in winter. For example, if adult mass-specific blubber stores were significantly lower than 0.33kg/kg in spring, and lower than 0.48kg/kg in fall, and juvenile blubber stores were similarly lower, this could indicate that adults and juveniles are energetically challenged during winter. A similar mechanism has been suggested for differences in reproductive performance of North Atlantic (E. glacialis) and southern (Eubalaena australis) right whales (Miller et al. 2011). In that study, juvenile and adult male blubber thickness in northern right whales was significantly lower during years of reduced prey availability. The authors concluded that nutritional status was a factor in the wide fluctuations of reproductive success in North Atlantic right whales.
Our results suggest that B-mode high-resolution ultrasound is a simple, noninvasive alternative to biopsy for assessing blubber stores in beluga whales. Because it is noninvasive, multiple body locations can be measured on individuals for precise estimates of blubber distribution, accumulation, and mobilization by developmental stage and season. We were able to directly compare ruler measurements with the depth of the blubber–muscle transition on ultrasound images to ground truth the accuracy of ultrasound. In general, measuring depth from the bottom of the epidermal layer to the 1st consistent bright white line in the image (which corresponds to changes in backscatter intensity associated with changes in tissue density and composition) provided an accurate measurement of blubber depth compared to direct ruler measurements at the excised location. This is consistent with other studies where image quality and measurement indicators are discussed (Moore et al. 2001; Mellish et al. 2004; Mellish 2007). Adjusting scale settings on the instrument to capture the expected ranges of blubber depths in different seasons is important for optimal image quality. When time permits during sampling, image quality is also improved by adjusting the gain and transducer position to ensure a vertical image. We found that making digital caliper measurements during sampling on live animals added time to the process, and measurement precision was better when the caliper function was used as part of postprocessing, when images could be viewed on a computer screen in good light.
Given the continuing decline of Cook Inlet belugas, studies that test the hypothesis of insufficient energy availability to support belugas year-round are needed. High-resolution ultrasound provides a precise, noninvasive method for addressing this question and is proving a useful tool across a wide array of marine mammal taxa.
Supporting Information
The Supporting Information documents are linked to this manuscript and are available at Journal of Mammalogy online (Supplementary Data). The materials consist of data provided by the author that are published to benefit the reader. The posted materials are not copyedited. The contents of all supporting data are the sole responsibility of the authors. Questions or messages regarding errors should be addressed to the author.
Supplementary Data.—Mathematical derivations of girth measurements and cone volumes for Bristol Bay beluga whales.
Supplementary Material
Acknowledgments
This work was funded by grants to LAC from NOAA and the Pollock Conservation Cooperative. Bristol Bay samples were collected under NOAA marine mammal research permit #s 712-1719 and 14245 issued to the National Marine Mammal Laboratory. Pt. Lay samples were collected with the permission of the North Slope Borough under ADFG permit #10091 issued to the Alaska Department of Fish and Game. The authors would like to thank R. Suydam for facilitating collection of Pt. Lay samples, L. Pinney, L. Saxon-Kendal, and J. Henning for sample processing in Pt. Lay, and the Georgia Aquarium and Mystic Aquarium for morphological measurements of captive whales. We would also like to thank the entire team of the Bristol Bay health assessment project for their assistance in the collection of these data. Two anonymous reviewers greatly improved the quality of this manuscript.
Literature Cited
- AnalystSoft Inc. . 2015. StatPlus:mac – statistical analysis program for Mac OS Version v5 www.analystsoft.com/en/. Accessed 31 December 2015.
- Arnould J. P. Y., Boyd I. L., Speakman J. R. 1996. Measuring the body composition of Antarctic fur seals (Arctocephalus gazella): validation of hydrogen isotope dilution. Physiological Zoology 69:93–116. [Google Scholar]
- Costa D. P. 1987. Isotopic methods for quantifying material and energy balance of free-ranging marine mammals. Pp. 43–66 in Approaches to marine mammal energetics (A. D. Huntley D. P. Costa G. A. J. Worthy , eds.). Allen Press, Lawrence, Kansas. [Google Scholar]
- Curran M. P., Asher W. M. 1974. Investigation of blubber thickness in a grey whale using ultrasonography. Marine Fisheries Review 36:15–20. [Google Scholar]
- Doidge D. W. 1990. Integumentary heat loss and blubber distribution in the beluga, Delphinapterus leucas, with comparisons to the narwhal, Monodon monoceros. Canadian Bulletin of Fisheries and Aquatic Science 224:129–140. [Google Scholar]
- Dunkin R. C., McLellan W. A., Blum J. E., Pabst D. A. 2005. The ontogenetic changes in the thermal properties of blubber from Atlantic bottlenose dolphin Tursiops truncatus. Journal of Experimental Biology 208:1469–1480. [DOI] [PubMed] [Google Scholar]
- Gales N. J., Burton H. R. 1987. Ultrasonic measurement of blubber thickness of the southern elephant seal, Mirounga leonina (Linn.). Australian Journal of Zoology 35:201–217. [Google Scholar]
- Gales R., Renouf D. 1994. Assessment of body condition of harp seals. Polar Biology 14:381–387. [Google Scholar]
- Geraci J. R., Bruce-Allen L. J. 1987. Slow process of wound repair in beluga whales Delphinapterus leucas. Canadian Journal of Fisheries and Aquatic Science 44:1661–1665. [Google Scholar]
- Jonker R. A. H., Trites A. W. 2000. The reliability of skinfold calipers for measuring blubber thickness of Steller’s sea lion pups (Eumetopias jubatus). Marine Mammal Science 16:757–766. [Google Scholar]
- Koopman H. N. 1998. Topographical distribution of the blubber of harbor porpoises (Phocoena phocoena). Journal of Mammalogy 79:260–270. [Google Scholar]
- Koopman H. N. 2006. Phylogenetic, ecological, and ontogenetic factors influencing the biochemical structure of the blubber of Odontocetes. Marine Biology 151:277–291. [Google Scholar]
- Koopman H. N., Iverson S. J., Read A. J. 2003. High concentrations of isovaleric acid in the fats of Odontocetes: variation and patterns of accumulation in blubber vs. stability in the melon. Journal of Comparative Physiology B 173:247–261. [DOI] [PubMed] [Google Scholar]
- Koopman H. N., Pabst D. A., McLellan W. A., Dillaman R. M., Read A. J. 2002. Changes in blubber distribution and morphology associated with starvation in the harbor porpoise (Phocoena phocoena): evidence for regional differences in blubber structure and function. Physiological and Biochemical Zoology 75:498–512. [DOI] [PubMed] [Google Scholar]
- Krahn M. M., et al. 2001. Organochlorine contaminant concentrations and lipid profiles in eastern North Pacific gray whales (Eschrichtius robustus). Journal of Cetacean Research Management 3:19–29. [Google Scholar]
- Krahn M. M., et al. 2004. Stratification of lipids, fatty acids and organochlorine contaminants in blubber of white whales and killer whales. Journal of Cetacean Research Management 6:175–189. [Google Scholar]
- Lensink C. J. 1961. Status report: beluga studies. Alaska Department of Fish and Game, Juneau. [Google Scholar]
- Lowry L. F., Frost K. J., Zerbini A., DeMaster D., Reeves R. R. 2008. Trend in aerial counts of beluga or white whales (Delphinapterus leucas) in Bristol Bay, Alaska, 1993–2005. Journal of Cetacean Research Management 10:201–207. [Google Scholar]
- Matthews C. J. D., Ferguson S. H. 2015. Weaning age variation in beluga whales (Delphinapterus leucas). Journal of Mammalogy 96:425–437. [Google Scholar]
- McDonald B. I., Crocker D. E., Burns J. M., Costa D. P. 2008. Body condition as an index of winter foraging success in crabeater seals (Lobodon carcinophaga). Deep Sea Research II 55:515–522. [Google Scholar]
- McLellan W. A., et al. 2002. Ontogenetic allometry and body composition of harbor porpoises (Phocoena phocoena, L.) from the western North Atlantic. Journal of the Zoological Society of London 257:457–471. [Google Scholar]
- Mellish J. E. 2007. Seasonal and spatial blubber depth changes in captive harbor seals (Phoca vitulina) and Steller’s sea lions (Eumetopias jubatus). Journal of Mammalogy 88:408–414. [Google Scholar]
- Mellish J. E., Tuomi P. A., Horning M. 2004. Assessment of ultrasound imaging as a noninvasive measure of blubber thickness in pinnipeds. Journal of Zoo and Wildlife Medicine 35:116–118. [DOI] [PubMed] [Google Scholar]
- Miller C. A., Reeb D., Best P. B., Knowlten A. R., Brown M. W., Moore M. J. 2011. Blubber thickness in right whales Eubalaena glacialis and Eubalaena australis related with reproduction, life history status and prey abundance. Marine Ecology Progress Series 438:267–283. [Google Scholar]
- Moore M. J., et al. 2001. Ultrasonic measurement of blubber thickness in right whales. Journal of Cetacean Research Management Special Issue 2:301–309. [Google Scholar]
- National Marine Fisheries Service 2008. Conservation plan for the Cook Inlet beluga whale (Delphinapterus leucas). Alaska Fisheries Science Center, Juneau. [Google Scholar]
- Noren S. R., Udevitz M. S., Triggs L., Paschke J., Oland L., Jay C. V. 2015. Identifying a reliable blubber measurement site to assess body condition in a marine mammal with topographically variable blubber, the Pacific walrus. Marine Mammal Science 31:658–676. [Google Scholar]
- Noren S. R., Wells R. S. 2009. Blubber deposition during ontogeny in free-ranging bottlenose dolphins: balancing disparate roles of insulation and locomotion. Journal of Mammalogy 90:629–637. [Google Scholar]
- Norman S. A., et al. 2012. Seasonal hematology and serum chemistry of wild beluga whales (Delphinapterus leucas) in Bristol Bay, Alaska, USA. Journal of Wildlife Diseases 48:21–32. [DOI] [PubMed] [Google Scholar]
- Oftedal O. T., Iverson S. J. 1987. Hydrogen isotope methodology for measurement of milk intake and energetics of growth in suckling young. Pp. 67–96 in Approaches to marine mammal energetics (A. D. Huntley D. P. Costa G. A. J. Worthy , eds.). Allen Press, Lawrence, Kansas. [Google Scholar]
- Parry D. A. 1949. The structure of whale blubber and a discussion of its thermal properties. Quarterly Journal of Microscopical Science 90:13–25. [PubMed] [Google Scholar]
- Pitcher K. W. 1986. Variation in blubber thickness of harbor seals in southern Alaska. Journal of Wildlife Management 50:463–466. [Google Scholar]
- Polasek L., Karpovich S., Prewitt J., Goertz C., Conlon S., Hennen D. 2015. Ultrasound as a non-invasive alternative for deuterium oxide dilution measurement in harbor seals (Phoca vitulina). Journal of Mammalogy 96:361–367. [Google Scholar]
- Quakenbush L. T., Suydam R. S., Bryan A. L., Lowry L. F., Frost K. J., Mahoney B. A. 2015. Diet of beluga whales, Delphinapterus leucas, in Alaska from stomach contents, March-November. Marine Fisheries Review 77:70–84. [Google Scholar]
- Quakenbush L. T., Taras B., Kelly B. P. 1999. Topographic variation in blubber thickness of Pacific walruses, Odobenus rosmarus. Report to United States Geological Survey, Alaska Science Center, Anchorage. [Google Scholar]
- R Development Core Team 2012. R: a language and environment for statistical computing R Foundation for Statistical Computing, Vienna, Austria: www.R-project.org/. Accessed 7 December 2014. [Google Scholar]
- Rosen D. A., Renouf D. 1997. Seasonal changes in blubber distribution in Atlantic harbor seals: indications of thermodynamic considerations. Marine Mammal Science 13: 229–241. [Google Scholar]
- Ryg M., Lydersen C., Knutsen L. O., Bjorge A., Smith T. G., Oritsland N. A. 1993. Scaling of insulation in seals and whales. Journal of Zoology London 230:193–206. [Google Scholar]
- Ryg M. Smith T. G. and Oritsland N. A.. 1988. Thermal significance of the topographical distribution of blubber in ringed seals (Phoca hispida). Canadian Journal of Fisheries and Aquatic Sciences 45:985–992. [Google Scholar]
- Sergeant D. E., Brodie P. F. 1969. Body size in white whales, Delphinapterus leucas. Journal of Fisheries Board Canada 26:2561–2580. [Google Scholar]
- Slip D. J., Burton H. R., Gales N. J. 1992. Determining blubber mass in the southern elephant seal (Mirounga leonina), by ultrasonic and isotopic techniques. Australian Journal of Zoology 40:143–152. [Google Scholar]
- Webb P. M., Crocker D. E., Blackwell S. B., Costa D. P., LeBoeuf B. J. 1998. Effects of buoyancy on the diving behavior of northern elephant seals. Journal of Experimental Biology 201:2349–2358. [DOI] [PubMed] [Google Scholar]
Associated Data
This section collects any data citations, data availability statements, or supplementary materials included in this article.


