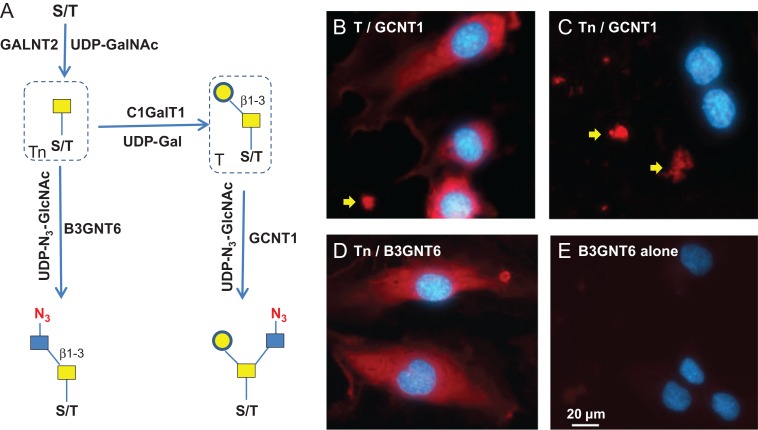
Fig. 6.
Specificity of T and Tn antigens imaging. (A) Schematic view of the synthesis of T and Tn antigens and their detection. The antigens are installed to proteins using GALNT2 and C1GalT1 in the presence of donor substrates UDP-GalNAc and UDP-Gal. T antigen is detected by GCNT1. Tn antigen is detected by B3GNT6. (B) Fully installed T antigen (core-1 O-glycan) on HUVEC cells imaged by GCNT1. (C) In the absence of UDP-Gal, only Tn antigen was synthesized, which resulted in negative cell staining by GCNT1. (D) In the absence of UDP-Gal, only Tn antigen was synthesized, which resulted in positive cell staining by B3GNT6. (E) Fixed HUVEC cells were directly stained by B3GNT6. Staining in B and C indicated by the yellow arrows may due to mis-folded and incompletely glycosylated protein aggregates. Antigen staining was revealed by Alexa-Fluor 555 (red) and nuclei were revealed by DAPI (blue).

