Abstract
The first extended comprehensive data set of the retrieval uncertainties in passive microwave observations of cloud liquid water path (CLWP) for warm oceanic clouds has been created for practical use in climate applications. Four major sources of systematic errors were considered over the 9‐year record of the Advanced Microwave Scanning Radiometer‐EOS (AMSR‐E): clear‐sky bias, cloud‐rain partition (CRP) bias, cloud‐fraction‐dependent bias, and cloud temperature bias. Errors were estimated using a unique merged AMSR‐E/Moderate resolution Imaging Spectroradiometer Level 2 data set as well as observations from the Cloud‐Aerosol Lidar with Orthogonal Polarization and the CloudSat Cloud Profiling Radar. To quantify the CRP bias more accurately, a new parameterization was developed to improve the inference of CLWP in warm rain. The cloud‐fraction‐dependent bias was found to be a combination of the CRP bias, an in‐cloud bias, and an adjacent precipitation bias. Globally, the mean net bias was 0.012 kg/m2, dominated by the CRP and in‐cloud biases, but with considerable regional and seasonal variation. Good qualitative agreement between a bias‐corrected AMSR‐E CLWP climatology and ship observations in the Northeast Pacific suggests that the bias estimates are reasonable. However, a possible underestimation of the net bias in certain conditions may be due in part to the crude method used in classifying precipitation, underscoring the need for an independent method of detecting rain in warm clouds. This study demonstrates the importance of combining visible‐infrared imager data and passive microwave CLWP observations for estimating uncertainties and improving the accuracy of these observations.
Keywords: clouds, microwave, precipitation, remote sensing, liquid water
Key Points
Uncertainties in passive microwave‐derived cloud liquid water observations are dominated by in‐cloud and cloud‐rain partition biases
Current methods for detecting rain in warm clouds from passive microwave measurements are inadequate
Combining passive microwave and visible‐infrared data is essential in quantifying errors and improving the accuracy of these observations
1. Introduction
As an important geophysical property of the climate system, cloud liquid water path (CLWP; see Appendix A) falls under the general category of cloud properties identified as an essential climate variable (ECV) by the Global Climate Observing System (http://www.gcos-science.org/). To qualify as an ECV, a geophysical variable must be necessary in characterizing the climate system and its changes, be observed on a global scale (ideally for at least 30 years) using technically feasible and proven methods, and be produced and archived in a cost‐effective manner using existing observing systems with proven technology (Bojinski et al., 2014). Observations of ECVs are important not only in climate research and in the assessment of climate change but also in developing public policy (Bojinski et al., 2014). Observations of CLWP, in particular, are vital in providing constraints to cloud‐climate feedback in climate model projections of global warming, which is the largest source of uncertainty in these models (IPCC, 2007), and in understanding cloud‐aerosol interactions (e.g., Lebsock, Stephens, & Kummerow, 2008; Liu, Li, & Cribb, 2016; Painemal & Zuidema, 2013).
Satellite observations obtained from microwave radiometers have perhaps the greatest potential as a CLWP ECV since the measurements have important advantages over solar reflectance techniques (e.g., Nakajima & King, 1990), such as being independent of cloud droplet size, having both day and night capability, and being largely insensitive to cloud ice particles and cloud inhomogeneities (e.g., Greenwald, 2009; Lebsock & Su, 2014). Furthermore, these observations are very close to reaching the 30‐year threshold as a long‐term climate data set (Elsaesser et al., 2017). However, issues such as cloud identification (Greenwald, L'Ecuyer, & Christopher, 2007; Stephens & Kummerow, 2007), partitioning of cloud liquid water and rainwater in precipitating systems (e.g., Bennartz et al., 2010; O'Dell et al., 2008; Stephens & Kummerow, 2007), cloud temperature uncertainties (Greenwald et al., 1993; Seethala & Horvath, 2010), and the so‐called cloud‐fraction‐dependent bias (Horváth & Gentemann, 2007) remain challenges in improving the accuracy of these observations.
One climate data record (CDR) considered state‐of‐the‐art for passive microwave (PMW) satellite CLWP observations is the Multi‐Sensor Advanced Climatology of LWP (MAC‐LWP) data set (Elsaesser et al., 2017; O'Dell et al., 2008). MAC‐LWP is based on intercalibrated measurements from all conical‐scanning microwave sensors since 1988 using retrieved products produced by Remote Sensing Systems (RSS; Hilburn & Wentz, 2008). This monthly gridded climatology primarily characterizes temporal/spatial sampling errors but has now accounted for retrieval errors attributed to clear‐sky biases (Elsaesser et al., 2017). Recently, this CDR played an important supportive role in identifying evidence of shifting patterns of cloudiness consistent with climate change (Norris et al., 2016) and showed that trends in LWP for climate models participating in the Coupled Model Intercomparison Project Phase 5 and Atmospheric Model Intercomparison Project were consistent with observed trends (Manaster et al., 2017).
Although PMW CLWP data sets like MAC‐LWP have been available for decades, they have largely been ignored by the climate modeling community mainly because they have undergone very limited validation and lack information on their inherent errors. For these reasons, PMW CLWP observations are currently not part of the Observations for Model Intercomparisons Project (https://www.earthsystemcog.org/projects/obs4mips/), the purpose of which is to make data sets such as these more accessible for evaluating climate models (Teixeira et al., 2014).
However, despite the lack of uncertainty estimates for these data sets, significant progress has been made over the past decade in assessing PMW CLWP errors for specifically warm clouds over relatively short time periods using other types of satellite sensors (e.g., visible‐infrared imagers, cloud radars, and lidars), which have greater sensitivity to clouds than microwave radiometers (Greenwald, 2009; Greenwald et al., 2007; Lebsock & Su, 2014; Seethala & Horvath, 2010). Focusing on warm clouds is important for several reasons: (1) They have a major impact on the Earth's albedo and thus have great significance in climate (e.g., Hartmann et al., 1992; Poetzsch‐Heffter et al., 1995); (2) errors in CLWP observations are relatively easier to obtain for these clouds in comparison to other cloud types; and (3) they have been the subject of numerous field campaigns over the past three decades that afford validation opportunities (e.g., Albrecht et al., 1995; Bretherton et al., 2004; Zhou et al., 2015).
This study builds on these earlier studies of assessing errors in PMW CLWP observations of warm clouds by not only combining these observations with lidar, radar, and visible‐infrared imager data but also providing new methods for estimating these errors and making available for the first time a multiyear uncertainty data set to the climate research community. The basis of this data set is a unique 9‐year merged Advanced Microwave Scanning Radiometer‐EOS (AMSR‐E) and MODerate resolution Imaging Spectroradiometer (MODIS) Level 2 (L2; i.e., pixel‐level) Earth Science Data Record developed specifically for assessing errors and improving the accuracy of PMW CLWP observations.
Section 2 describes the observations used in this study. Section 3 details the methods used, including the development of the Earth Science Data Record and a new approach for addressing biases in MODIS cloud top properties, as well as quantifying the four major sources of systematic errors in PMW satellite observations of CLWP, that is, clear‐sky, cloud‐rain partition, cloud temperature, and cloud‐fraction‐dependent biases. The error analysis highlights an improved cloud‐rain partition approach and a further interpretation of the cloud‐fraction‐dependent bias and provides insight into the limitations of PMW precipitation detection methods, a new method of quantifying cloud temperature bias, and the identification of a possible new source of error. Section 4 summarizes the relative contribution of these biases and how they change in space and time, followed by the conclusions in section 5.
2. Data
2.1. AMSR‐E
This study uses the latest (Version 7) AMSR‐E/Aqua Level 2B (L2B; i.e., pixel level) Global Swath Ocean Products obtained directly from RSS and Version 3 (stage 1 validated maturity version 12) of the AMSR‐E Level 2A (L2A) Global Swath Spatially Resampled brightness temperature data available from the National Snow and Ice Data Center (NSIDC). The L2A files were needed for collocation. It was necessary to obtain the latest version of the AMSR‐E L2B product files from RSS since these data are not yet available from the NSIDC. The L2B files supplied by RSS, however, consisted of full‐orbit flat binary files, which presented some challenges in attempting to match the data to the half‐orbit L2A HDF files supplied by the NSIDC. For example, the L2B binary files contained less precise geolocation information and used different orbit partitioning and reference times than the L2A files, among other complications.
The latest AMSR‐E ocean product suite includes not only sea surface temperature (SST), near‐surface wind speed, total precipitable water (TPW), and CLWP but also two new products: total LWP (TLWP)—rainwater path (RWP) plus CLWP—and surface rain rate. All quantities are retrieved via a two‐step regression algorithm procedure (Wentz & Meissner, 2000, 2007), except for rain rate, which is derived from a simple physical model (Hilburn & Wentz, 2008). For example, SST and wind speed are first retrieved from the 10 lowest frequency channels (except wind speed that excludes the 6.9‐GHz channels) using a regression equation that relates brightness temperatures computed for radiosonde profiles (some with added clouds) from around the globe to SST and wind speed, where the regression coefficients are found using a least squares method. To improve accuracy, a second regression equation is used covering a narrow range of environmental conditions in the vicinity of the initial retrieval. TPW and TLWP are retrieved in a similar manner but use the 18.7, 23.9, and 36.5‐GHz channels. Rain is indicated when the TLWP exceeds a threshold of 0.18 kg/m2, while CLWP is estimated under raining conditions using a simple parameterization (Wentz & Spencer, 1998, hereafter WS98):
| (1) |
where R is the column mean rain rate (mm/hr) and H is the height of the rain column (km).
2.2. CPR and CALIOP
CloudSat Cloud Profiling Radar (CPR) Level 2C (L2C) RAIN‐PROFILE (Release 04) products were used in quantifying the cloud‐rain partition and cloud‐fraction‐dependent biases. Variables include the precipitation liquid water and cloud liquid water profiles and precipitation flag. The RAIN‐PROFILE product is designed specifically for estimating drizzle and light rainfall in warm marine clouds with explicit models for subcloud evaporation, precipitation drop size distributions, and cloud/rainwater partitioning (Lebsock & L'Ecuyer, 2011). A supplementary CloudSat product called European Centre for Medium‐Range Weather Forecasts (ECMWF)‐AUX was used for identifying temperature inversions. Based on ECMWF forecasts, these data were spatially and temporally interpolated to the CPR 1.4 km (across‐track) by 2.5 km (along track) footprints and 125 vertical 240‐m‐deep bins (Partain, 2007). Cloud‐Aerosol Lidar with Orthogonal Polarization (CALIOP) L2C 1‐km Cloud Layer (Validation Stage 1 Version 3) products were used in validating MODIS cloud top properties and for screening purposes and validation in specific parts of the error analysis (Winker et al., 2009).
2.3. MODIS
The latest (Collection 6; C6) Aqua MODIS L2 1‐km cloud products (MYD06; Platnick et al., 2015, 2016) and C6 Level 1B (L1B) geolocation products (MYD03) are used in this study. L1B geolocation files are needed for collocation and the 1‐km cloud products. Several notable changes made to the C6 cloud algorithms have led to improvements over the Collection 5 (C5) products, including new ice cloud scattering properties that improve visible optical depths for thin cirrus (Holz et al., 2015), a new shortwave cloud thermodynamic phase algorithm that performs significantly better (Marchant et al., 2016), and addressing well‐known deficiencies in the C5 cloud top height and pressure products (Baum et al., 2012; Holz et al., 2008), as well as providing new 1‐km cloud top products. Other important changes include retrievals for cloud edge and subpixel partly cloudy conditions (called PCL) and improved pixel‐level retrieval uncertainty estimates (Platnick et al., 2016).
The MODIS Atmosphere Group has also made significant improvements to the C6 cloud mask product (MYD35), a portion of which is included in the MYD06 files, in terms of the detection of warm clouds that are the focus of this study. For example, 11 to 3.9‐μm brightness temperature difference thresholds as a function of TPW were added to the detection of clouds over land/ocean at night, which allowed for more clouds being detected as opposed to the C5 algorithm (Frey et al., 2008), thus enhancing the detection of transmissive cirrus. A new surface temperature test over the oceans better discriminates between clear skies and low clouds in moist regions such as the tropical western Pacific. Replacing the trispectral test in ocean scenes with a simple 8.6 to 11‐μm brightness temperature difference threshold test also eliminated many “probably cloudy” and “probably clear” results in clear‐sky conditions, especially in moist tropical environments (R. Frey, personal communication, 2017). Tests of the C6 MODIS cloud mask against CALIOP data have shown that it is very successful in detecting clouds over day/night water surfaces with a hit rate of 97.4%/95.1% and a missed rate of just 0.3%/0.4% (Kopp et al., 2014).
3. Methods
3.1. A merged AMSR‐E/MODIS L2 Data Set
A new L2C data set is produced that combines the AMSR‐E L2B ocean swath products with the MODIS L2 1‐km cloud products. These products are collocated at the native instrument resolution using a fast collocation method that projects the higher‐resolution MODIS observations onto an AMSR‐E footprint by inverting navigation models that use satellite position/velocity vectors and time supplied by the AMSR‐E L2A and MODIS L1B geolocation files (Greenwald, 2009; Nagle & Holz, 2009). This type of collocation provides for a more precise characterization of errors and sub‐FOV effects than using equal‐angle gridded data.
Selected MODIS cloud properties were weighted by the AMSR‐E effective antenna pattern (EAP), approximated as a 2‐D Gaussian distribution for the liquid‐sensitive 36.5‐GHz channels with assumed 3‐dB along‐track and along‐scan footprint dimensions of 14 × 11 km. During the collocation process, MODIS observations were collected within an extended region of 35 × 27.5 km to cover the range of influence of the EAP.
The weighted average and standard deviation for MODIS product A are computed for n collocated pixels as
| (2) |
| (3) |
where w i is the Gaussian weight for the ith pixel.
Included in the L2C HDF4 files are the complete set of AMSR‐E L2B ocean swath products as well as their quality assessment flags. The collocated MODIS products are summarized in Table 1. Unfortunately, due to file size considerations the full set of quality assessment flags for the MODIS products could not be included. However, some information on the number of cloud water path (CWP) retrievals that were successful is provided in the cloud statistics (Table 2). The collocated MODIS effective radius, cloud optical thickness, and CWP products are a combination of the overcast retrievals and the PCL retrievals. This was done mainly not only to reduce biases in these properties that can occur if retrievals for cloud edges and subpixel partly cloudy situations are excluded (e.g., Lebsock & Su, 2014) but also to minimize the size of the data files. Information regarding the number of successful PCL CWP retrievals and the number of each type of PCL condition is also included (Table 2).
Table 1.
MODIS Variables Contained Within the AMSR‐E/MODIS Level 2C Files
| Variable | Description |
|---|---|
| Number_collocated_MODIS_1km | Number of 1‐km MODIS pixels collocated within extended (35 × 27.5 km) AMSR‐E FOV |
| MODIS_cloud_stats | See Table 2 |
| MODIS_cloud_cover | Percentage of total and warm clouds within extended AMSR‐E FOV |
| MODIS_cloud_top_pressure_stats | High‐resolution (1‐km) cloud top pressure statistics (WAVG, min, max, WSD) |
| MODIS_cloud_top_height_stats | High‐resolution (1‐km) cloud top height statistics (WAVG, min, max, WSD) |
| MODIS_cloud_top_temperature_stats | High‐resolution (1‐km) cloud top temperature statistics (WAVG, min, max, WSD) |
|
MODIS_cloud_effective_radius_stats MODIS_cloud_effective_radius_1.6_stats MODIS_cloud_effective_radius_3.7_stats |
Effective radius retrievals for 0.86/2.1, 0.86/1.6, and 0.86/3.7‐μm spectral pairs (WAVG, WSD) |
|
MODIS_cloud_optical_thickness_stats MODIS_cloud_optical_thickness_1.6_stats MODIS_cloud_optical_thickness_3.7_stats |
Optical thickness retrievals for 0.86/2.1, 0.86/1.6, and 0.86/3.7‐μm spectral pairs (WAVG, WSD) |
|
MODIS_cloud_water_path_stats MODIS_cloud_water_path_1.6_stats MODIS_cloud_water_path_3.7_stats |
Cloudy‐pixel‐only CWP retrievals for 0.86/2.1, 0.86/1.6, and 0.86/3.7‐μm spectral pairs (WAVG, WSD) |
|
MODIS_cloud_water_path_AS_stats MODIS_cloud_water_path_AS_1.6_stats MODIS_cloud_water_path_AS_3.7_stats |
All‐sky CWP data (CWP = 0 for clear sky or missing data) for 0.86/2.1, 0.86/1.6, and 0.86/3.7‐μm spectral pairs (WAVG, WSD) |
|
MODIS_cloud_water_path_AS_uncertainty MODIS_cloud_water_path_AS_1.6_uncertainty MODIS_cloud_water_path_AS_3.7_uncertainty |
RMS errors provided in MODIS L2 products (WAVG) |
| MODIS_cloud_mask_SPI | Dispersion (%) in MODIS channels 1 and 2 from 250‐m reflectivity statistics of the cloud mask (WAVG) |
| MODIS_zenith | Average MODIS observation zenith angle (deg.) |
| MODIS_azimuth | Average MODIS observation azimuth angle (deg.) |
| Solar_zenith | Average solar zenith angle (deg.) |
| Solar_azimuth | Average solar azimuth angle (deg.) |
Note. WAVG is the Gaussian‐weighted average, WSD is the Gaussian‐weighted standard deviation, and CWP is cloud water path.
Table 2.
Cloud‐Related Parameters and Quality Assurance Flags Contained Within the MODIS_cloud_stats Variable of the L2C Data Set
| Array dimension | Description |
|---|---|
| 1 | Number of confident cloudy MODIS pixels as determined by cloud mask |
| 2 | Number of probably cloudy MODIS pixels as determined by cloud mask |
| 3 | Number of water clouds (VNSWIR method) |
| 4 | Number of ice clouds (VNSWIR method) |
| 5 | Number of clouds with undetermined phase (VNSWIR method) |
| 6 | Number of single‐layer clouds (VNSWIR method) |
| 7 | Number of multilayer clouds (VNSWIR method) |
| 8 | Number of warm clouds (IR method) |
| 9 | Number of cloud‐free pixels (IR method) |
| 10 | Number of water clouds (IR method) |
| 11 | Number of ice clouds (IR method) |
| 12 | Number of mixed‐phase clouds (IR method) |
| 13 | Number of clouds with undetermined phase (IR method) |
| 14 | Number of successful VNSWIR‐2.1 cloud water path (CWP) retrievals |
| 15 | Number of successful VNSWIR‐2.1 partly cloudy (PCL) CWP retrievals |
| 16 | Number of successful VNSWIR‐1.6 CWP retrievals |
| 17 | Number of successful VNSWIR‐1.6 PCL CWP retrievals |
| 18 | Number of successful VNSWIR‐3.7 CWP retrievals |
| 19 | Number of successful VNSWIR‐3.7 PCL CWP retrievals |
| 20 | Number of VNSWIR retrievals with clear‐sky restoral (CSR) = 0 (not restored) |
| 21 | Number of VNSWIR retrievals with CSR = 1 (cloud edges) |
| 22 | Number of VNSWIR retrievals with CSR = 2 (dust, smoke, Sun glint) |
| 23 | Number of VNSWIR retrievals with CSR = 3 (subpixel partly cloudy) |
Note. VNSWIR stands for visible, near‐, or shortwave infrared.
One special product contained in this data set is the MODIS “all‐sky” CWP product, which assigns a value of zero to clear‐sky pixels in the weighted average. Also, in the event of failed PCL retrievals, the LWP is set to 0. This was to facilitate direct comparisons between the two CLWP products since the all‐sky CLWP is what microwave sensors actually observe due to their relatively coarse spatial resolution. The “all‐sky” CLWP is also a more relevant variable for comparison to climate models than is the “cloud‐only” CLWP, which is included in MODIS Level 3 (L3) data aggregations.
3.2. MODIS Cloud Top Property Biases
Two MODIS cloud properties that are heavily relied upon in this study are cloud top height and cloud top temperature. Having accurate cloud top height/temperature in all cloud cover conditions is crucial for the error analysis and in identifying warm clouds. While the C6 MODIS cloud top height products have been validated against CALIOP observations (Baum et al., 2012), the C6 MODIS cloud top temperature products have not, to our knowledge, been validated.
Two factors that play a major role in limiting the accuracy of infrared methods for retrieving warm cloud top properties are partial cloud cover and the existence of a temperature inversion. In partial cloudiness there is an increased transmission of radiation from the ocean surface, which results in cloud top temperature retrievals being too warm (e.g., Zuidema et al., 2009) and, likewise, cloud top height retrievals being too low. The ambiguities involved in retrieving cloud top properties in temperature inversions are well known and typically cause cloud top height retrievals in overcast conditions to be too high (Baum et al., 2012; Holz et al., 2008).
MODIS cloud top properties were evaluated by collocating the CPR and CALIOP data in their native resolution with the merged AMSR‐E/MODIS L2C data set for only ascending passes during 2008, which we refer to here as the 2008 collocated multisensor data set. These data were collocated in the same manner as the merged AMSR‐E/MODIS L2C data set, that is, using the AMSR‐E EAP over the extended scene. However, only comparisons with more than 27 collocated CPR points were used in the analysis to ensure that the CPR traversed most of the scene observed by the AMSR‐E. Temperature profiles used to identify the presence of inversions were obtained from the ECMWF‐AUX data set.
The MODIS cloud top height products were validated using the CALIOP 1‐km Layer_Top_Altitude products. Results show that in environments without a temperature inversion the MODIS cloud top heights are negatively biased relative to CALIOP cloud top heights by 275 m for 100% cloud cover, which becomes larger as cloud cover decreases, reaching −471 m for the smallest cloud cover (Table 3). In scenes with a temperature inversion, the MODIS cloud top heights are instead positively biased by 227 m for 100% cloud cover and then become negative biases for 80–90% cloud cover, which increase with decreasing cloud cover. The tendency for MODIS cloud top heights to become increasingly negatively biased with decreasing cloud cover is consistent with the influence of the surface on the observed brightness temperatures in partly cloudy scenes.
Table 3.
Mean Differences Between Collocated MODIS and CALIOP Cloud Top Temperature and Height for Cases With and Without a Temperature Inversion
| Cloud top temperature difference (K) | Cloud top height difference (km) | |||
|---|---|---|---|---|
| Cloud cover (%) | No inversion | Inversion | No inversion | Inversion |
| 100 | −0.011 | −3.544 | −0.275 | 0.227 |
| 90–100 | 1.394 | −1.310 | −0.292 | 0.133 |
| 80–90 | 2.661 | 0.735 | −0.379 | −0.070 |
| 70–80 | 3.261 | 1.806 | −0.404 | −0.168 |
| 60–70 | 3.674 | 2.689 | −0.412 | −0.248 |
| 50–60 | 4.038 | 3.440 | −0.410 | −0.317 |
| 40–50 | 4.327 | 4.072 | −0.410 | −0.371 |
| 30–40 | 4.628 | 4.600 | −0.414 | −0.415 |
| 20–30 | 4.890 | 5.069 | −0.421 | −0.456 |
| 10–20 | 5.206 | 5.549 | −0.443 | −0.506 |
| 0–10 | 5.477 | 5.889 | −0.471 | −0.543 |
Evaluating the MODIS cloud top temperature products is somewhat more problematic since the CALIOP 1‐km Layer_Top_Temperature data are derived products that use temperature profiles obtained from the NASA Global Modeling and Assimilation Office. For the case of temperature inversions, the model analyses of the vertical location of the base of the inversion would need to be highly accurate to provide accurate cloud top temperature estimates. However, despite this caveat, the same comparison as done for the cloud top height was also carried out for the cloud top temperature. Results show that for 100% cloud cover in noninversion cases the MODIS cloud top temperature products agree well with the CALIOP products (Table 3). As expected, positive biases relative to CALIOP increase monotonically with decreasing cloud cover, reaching a maximum bias of about 5.5 K. For inversion cases, cloud top temperature differences for overcast clouds are on average −3.5 K, due possibly in part to errors in the CALIOP‐derived products, which switch to positive and increase with decreasing cloud cover (Table 3).
It is important to note that the biases in Table 3 are used only in correcting the MODIS cloud top properties for use in the L3 CLWP uncertainty data set production and the analyses in section 3.3 and are not applied to the L2C MODIS cloud products themselves.
3.3. Quantifying the Main Sources of Systematic Errors
3.3.1. Clear‐Sky Bias
Because measurements from microwave radiometers lack sufficient sensitivity and spatial resolution to identify whether a particular scene is clear or cloudy, observations that include clear scenes can introduce significant biases in PMW CLWP data sets, especially in regions with little cloudiness (Stephens & Kummerow, 2007). Studies have shown that similar biases can appear in cloudy scenes as well, suggesting they are related to the retrieval algorithm failing to fully account for the effects of noncloud parameters such as the ocean surface emissivity and/or atmospheric absorption (Greenwald, 2009; Greenwald et al., 2007). While other studies have extended clear‐sky biases determined in clear scenes to cloudy scenes (Elsaesser et al., 2017; Lebsock & Su, 2014), this study restricts the use of clear‐sky biases to only clear scenes using the observed AMSR‐E CLWP as a measure of this bias. Biases related to noncloud parameters and other effects within cloudy scenes will be examined separately in section 3.3.4.
In this study, cloud‐free AMSR‐E scenes were identified from the cloud mask for which all MODIS pixels were neither confident cloudy nor probably cloudy. It is possible that nearby precipitation could impact the AMSR‐E clear‐sky bias estimates due to the high sensitivity of these measurements to nearby precipitation (Elsaesser et al., 2017). An analysis showed that this situation rarely occurs (<0.015%) and thus has an insignificant impact on the overall biases. However, to provide a better estimate of the clear‐sky bias in the small number of cases where adjacent pixels have CLWP >0.18 kg/m2, the clear‐sky look‐up table (LUT) developed by Elsaesser et al. (2017) for the V7 RSS ocean products was used, which is based on the merged AMSR‐E/MODIS Level 2C products used in this study for 2008. The LUT depends solely on two parameters: TPW and near‐surface wind speed, both of which have been extensively validated and are thus useful for classification purposes (e.g., Wentz, 2015).
The clear‐sky LUT demonstrates that the V7 CLWP products (Elsaesser et al., 2017) exhibit marked improvement over the V6 products, not only in terms of overall reduced dependence on wind speed and TPW but also in terms of the global mean bias (cf. Greenwald, 2009; Lebsock & Su, 2014; Seethala & Horvath, 2010). Smaller biases throughout the middle range of water vapor are thought to be related to changes made to the water vapor absorption model for V7 (Kyle Hilburn, personal communication, 2016). However, one conspicuous feature of the clear‐sky biases is a slight deviation from a Gaussian distribution on the negative side of the global probability distribution function (PDF; Figure 1). A global map of the location of these overrepresented negative values reveals that they occur most often near major deserts, suggesting the influence of scattering by large airborne dust particles on the CLWP products (Figure 2). Observations have shown that these particles can cause, on average, depressions in 37‐GHz vertical polarization brightness temperatures of 5 K (e.g., Ge et al., 2008). Noting that the relative contribution of this effect to the clear‐sky bias is rather small, we leave further exploration of the potential influence of dust on microwave CLWP products to a future study.
Figure 1.
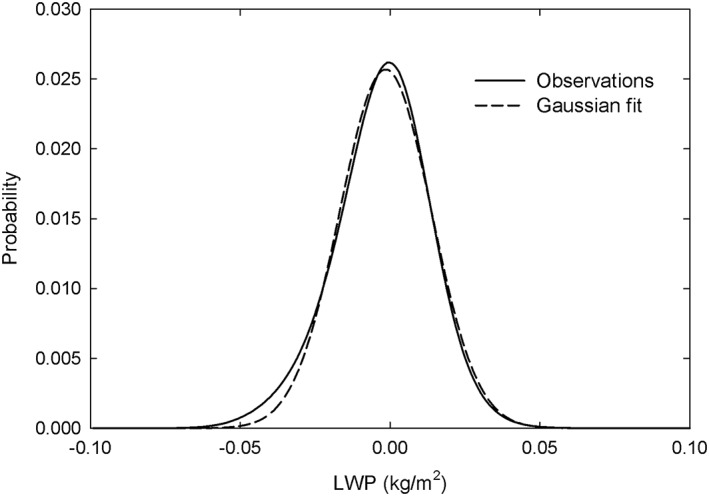
Probability distribution function (PDF) of AMSR‐E liquid water path (LWP) observations in clear scenes as determined by collocated Moderate Resolution Imaging Spectroradiometer cloud mask data for daytime satellite passes in 2008. Also shown are the LWP mean and standard deviation and a Gaussian fit to the observed PDF.
Figure 2.
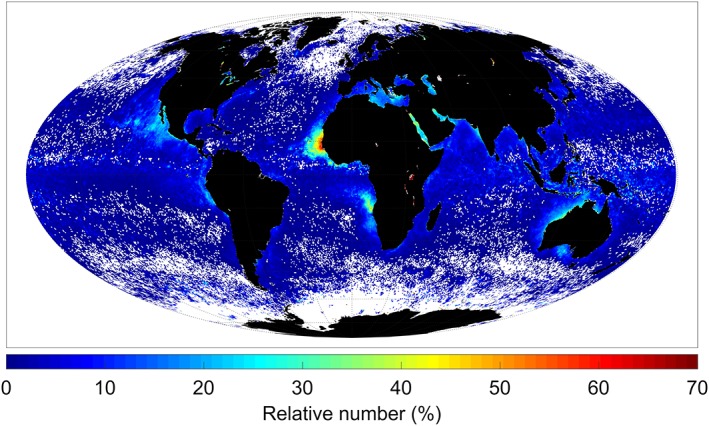
Geographic distribution of the percentage of clear‐sky Advanced Microwave Scanning Radiometer‐Earth Observing System observations with liquid water path less than −0.03 kg/m2 for 2008. The white areas contain no data points.
3.3.2. Cloud‐Rain Partition Bias
A fundamental observable that PMW measurements can provide in precipitating clouds is the TLWP (e.g., Bennartz et al., 2010; Liu & Curry, 1993). This is because attempting to differentiate between CLWP and RWP using these measurements alone is complicated by the fact that raindrops and cloud droplets have similar radiative signatures at AMSR‐E frequencies. The most common way to separate CLWP and RWP from the TLWP observations is to devise a parameterization that relates CLWP to precipitation parameters based on, for example, numerical weather prediction model data or observations (WS98; O'Dell et al., 2008) or ancillary observations (Lebsock, L'Ecuyer, & Stephens, 2011; Saavedra et al., 2012).
A recent study, however, found significant differences between AMSR‐E and MODIS CLWP data in warm precipitating clouds which correlated with RWP independently observed by the CloudSat CPR (Lebsock & Su, 2014), suggesting an inconsistency between the WS98 cloud‐rain partition parameterization (1) and independent observations of CLWP from MODIS. To explore these results further, AMSR‐E CLWP/TLWP data for all warm precipitating clouds were analyzed for the 2008 collocated multisensor data set. CPR data were used for rain detection, whereas CALIOP cloud top temperature data served to identify warm cloud conditions. The adiabatic assumption (e.g., Greenwald, 2009) was applied to the MODIS 0.86‐μm optical thickness/3.7‐μm effective radius all‐sky CWP products for solar zenith angles ≤45°, which represents the most conservative threshold when noticeable biases begin to occur in these products (Greenwald, 2009; Grosvenor & Wood, 2014; Horváth et al., 2014; Lebsock & Su, 2014). The 3.7‐μm effective radius data were chosen because they are less impacted by drizzle (Lebsock et al., 2011) and cloud inhomogeneities (e.g., Painemal, Minnis, & Sun‐Mack, 2013; Zhang et al., 2012) than other wavelengths. Also, the 0.86/3.7‐μm CWP data have the lowest percentage of failed retrievals (Cho et al., 2015).
Results of the CLWP/TLWP comparisons are consistent with Lebsock and Su (2014) in that the AMSR‐E CLWP data are negatively biased for TLWP ≈ 0, which then change over to significant positive biases relative to the MODIS CLWP for larger TLWP (Figure 3). These results were motivation to develop a new cloud‐rain partition parameterization based on the 2008 collocated multisensor data set. Since the relationship of MODIS CLWP to AMSR‐E TLWP appears to approximately follow a power law, we propose the same basic form as (1) but allow for three free variables: an offset parameter (α), which is the LWP threshold (kg/m2) used for rain detection, a slope parameter (β), and an exponent (γ):
| (4) |
Figure 3.
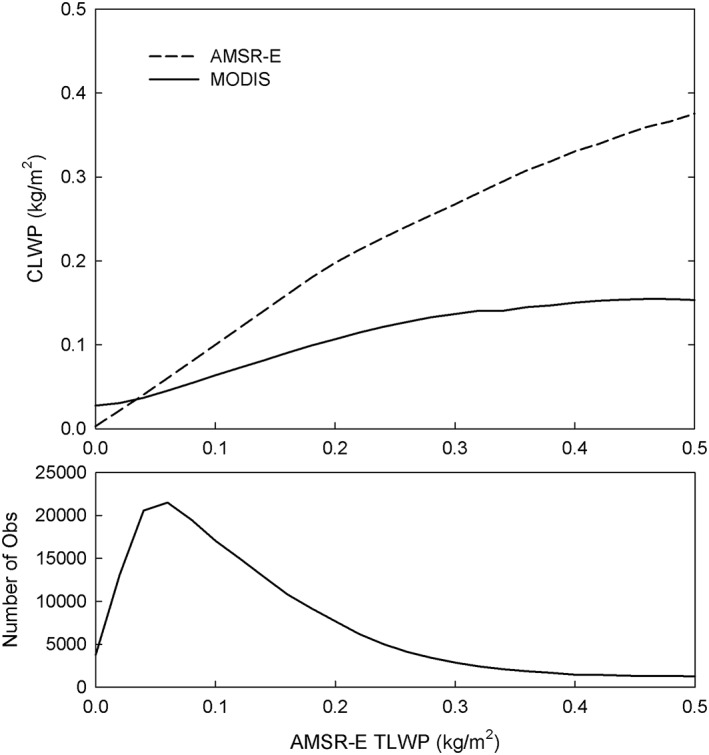
(top) Advanced Microwave Scanning Radiometer‐Earth Observing System (AMSR‐E) and Moderate Resolution Imaging Spectroradiometer cloud liquid water path versus AMSR‐E total liquid water path for warm rain conditions as determined by the CloudSat Cloud Profiling Radar and Cloud‐Aerosol Lidar with Orthogonal Polarization from the 2008 collocated multisensor data set. (bottom) Number of observations used as a function of total liquid water path.
In the RSS algorithm, H is a linear function of SST (Hilburn & Wentz, 2008):
| (5a) |
| (5b) |
| (5c) |
While CLWP is also known to vary with cloud cover (e.g., Painemal et al., 2016), this parameter was excluded so as to retain a simple formulation.
To reduce the impact of cloud inhomogeneities on the MODIS CLWP observations, the analysis was further limited to overcast scenes (i.e., cloud cover >95% as determined by MODIS). The first step in determining the free parameters was to estimate α from only CPR observations. Since CLWP ≈ α as HR approaches zero in (4), the mean CPR CLWP for very small HR (i.e., <0.05 mm/hr km) was used to approximate α. R was computed from CPR rainwater content profiles via a LUT that relates rainwater content to rain rate, which is consistent with the drop size distribution assumptions in the CloudSat rain profile algorithm. Also, H was determined as the top‐most level with a nonzero rainwater content from the CPR profile data. The analysis determined α to be 0.087 kg/m2, which is roughly half as large as the threshold in the WS98 algorithm.
Parameters β and γ were estimated by comparing the MODIS all‐sky CLWP observations against HR but at the same time ensuring that changes in the AMSR‐E R and MODIS CLWP were consistent with the observed 37‐GHz liquid optical depth (τL37). The steps in this procedure are as follows:
-
1
Compute AMSR‐E R and τL37 (Hilburn & Wentz, 2008):
| (6) |
and
| (7) |
where CLWP and H are values from the RSS algorithm; a 37, b 37, c 37, d 37, and e 37 are coefficients derived using a Marshall‐Palmer raindrop size distribution (see WS98 and Hilburn & Wentz, 2008 for details), a 37(1 − b 37ΔT) is the mass absorption coefficient in units of m2/kg, and
| (8) |
| (9) |
where T L is the liquid water temperature (K) and T U is the effective upwelling brightness temperature, which is dependent on TPW and SST (see Hilburn & Wentz, 2008).
-
2
Apply the new LWP threshold of 0.087 kg/m2 to the MODIS CLWP data and compute a new R from (7) as
| (10) |
where ΔT cal assumes T L is the CALIOP cloud top temperature, CLWPmod is the MODIS CLWP, and H cpr is the rain column height derived from the CPR. This new R is consistent with a Marshall‐Palmer drop size distribution like the WS98 algorithm.
-
3
Plot CLWPmod versus R new H cpr and find β and γ through a fit of the data to (4).
The results of the analysis determined that β = 0.9 and γ = 0.38, with the resulting curve plotted in Figure 4. We define the cloud‐rain partition bias as being the difference between the CLWP predicted by the WS98 scheme (1) and the new parameterization, which is nearly always positive. In practice, this bias can be computed using these steps:
-
1
Compute R and τL37 in the same manner as above.
-
2
Find a new R by combining (4) and (7) and solving iteratively for the following transcendental equation:
| (11) |
Figure 4.
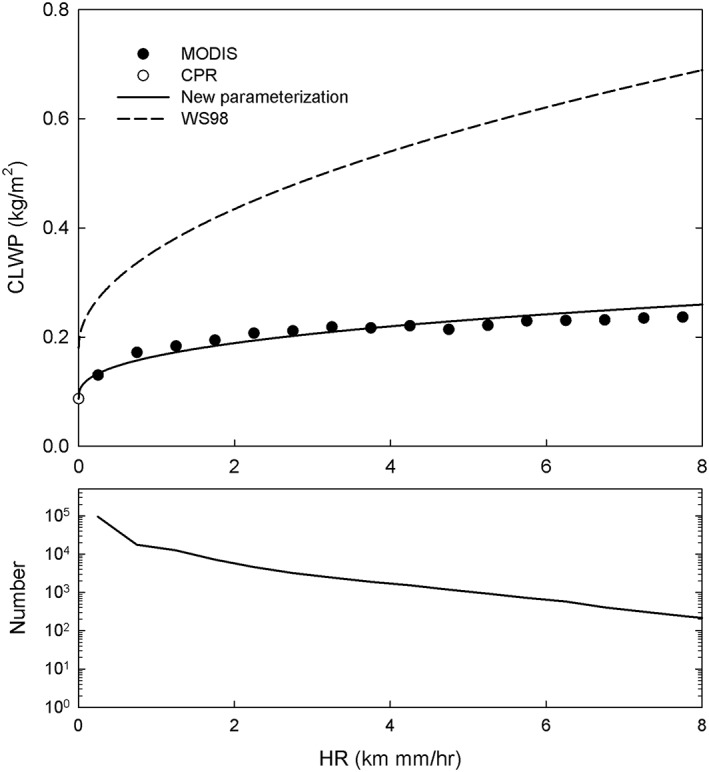
(top) Moderate Resolution Imaging Spectroradiometer and CloudSat Cloud Profiling Radar (CPR) cloud liquid water path observations versus CPR‐derived rain column height (H) times the modified Advanced Microwave Scanning Radiometer‐Earth Observing System column mean rain rate (R) for overcast warm rain conditions from the 2008 collocated multisensor data set. Also shown are the new cloud‐rain partition parameterization and the Wentz and Spencer (1998) scheme. (bottom) Number of observations used in the analysis as a function of HR.
where
| (12) |
ΔT mod uses the MODIS bias‐corrected cloud top temperature, and H mod is the MODIS bias‐corrected cloud top height, which is used as a proxy for the rain column height since it should be a better predictor than SST for warm clouds (Bennartz et al., 2010). Direct comparisons of CPR‐observed H to MODIS cloud top height observations and H derived from the SST‐based Hilburn and Wentz (2008) approach confirm this assumption (Figure 5).
Figure 5.
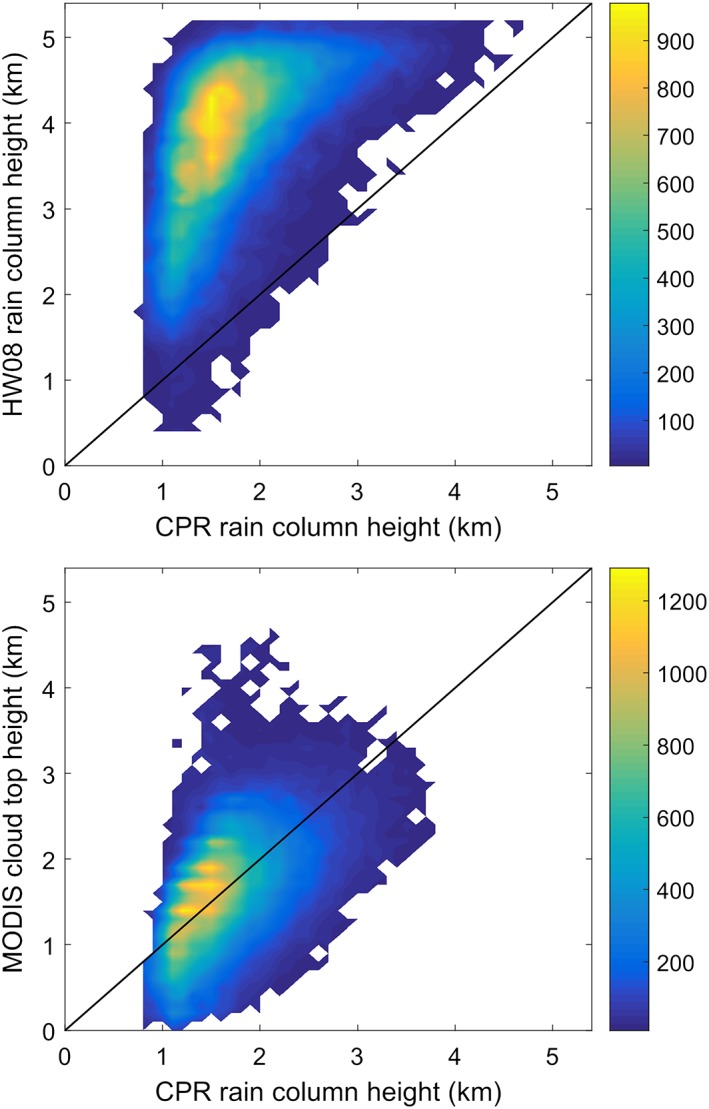
(top) Joint number histogram of the rain column height (H) derived from the Hilburn and Wentz (2008) algorithm versus CloudSat Cloud Profiling Radar (CPR)‐derived H for warm overcast clouds from the 2008 collocated multisensor data set. (bottom) Same as top panel except for Moderate Resolution Imaging Spectroradiometer cloud top height versus CPR H.
While the new cloud‐rain partition parameterization leads to somewhat larger rain rates owing to an increase in the RWP, it also has implications for the detection of rain since the LWP threshold is significantly lower than what is assumed in the RSS algorithm. This is illustrated in Figure 6, which shows the difference in rain frequency between using the different thresholds as compared to CPR observations. The WS98 LWP threshold is found to greatly underestimate rain frequency except at the highest latitudes. The new LWP threshold, in contrast, agrees very well with the CPR observations in the tropics and subtropics, which is not surprising since the CPR and MODIS observations used to derive the threshold were limited by solar zenith angle to lower latitudes. However, rain frequency is significantly overestimated at the middle‐to‐high latitudes. This underscores the fundamental limitation of using LWP thresholds for the detection of rain, at least in the case of warm clouds (Lebsock et al., 2008; Stephens & Kummerow, 2007). This limitation can be understood by comparing the AMSR‐E TLWP PDFs for raining and nonraining scenes as identified by the CPR (Figure 7). Results demonstrate there is significant overlap between the PDFs, making it impossible to fully differentiate raining from nonraining conditions.
Figure 6.
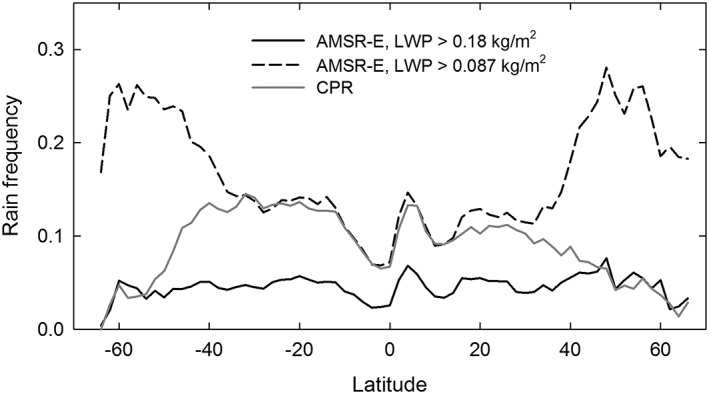
Zonal average rain frequency versus latitude for two different liquid water path thresholds for Advanced Microwave Scanning Radiometer‐Earth Observing System observations as compared to rain detected by the CloudSat Cloud Profiling Radar for the 2008 collocated multisensor data set.
Figure 7.
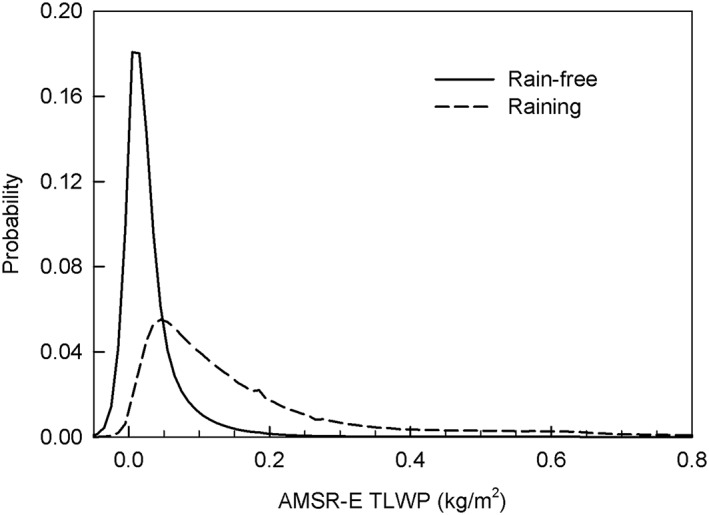
Probability distribution functions for Advanced Microwave Scanning Radiometer‐Earth Observing System total liquid water path for raining and nonraining warm clouds from the 2008 collocated multisensor data set.
3.3.3. Cloud Temperature Bias
Because the emission of microwaves absorbed by liquid drops depends on temperature, possible biases in the cloud temperature assumed in the retrieval algorithm can lead to biases in the CLWP observations (e.g., Greenwald et al., 1993; O'Dell et al., 2008; Seethala & Horvath, 2010). We have already seen evidence in Figure 8 that the RSS algorithm tends to overestimate the cloud height, which may result in an associated emission temperature error. Although cloud‐temperature‐related errors are expected to be smaller for warm clouds than other cloud types, a quantitative analysis is still important to identify and reduce this source of bias.
Figure 8.
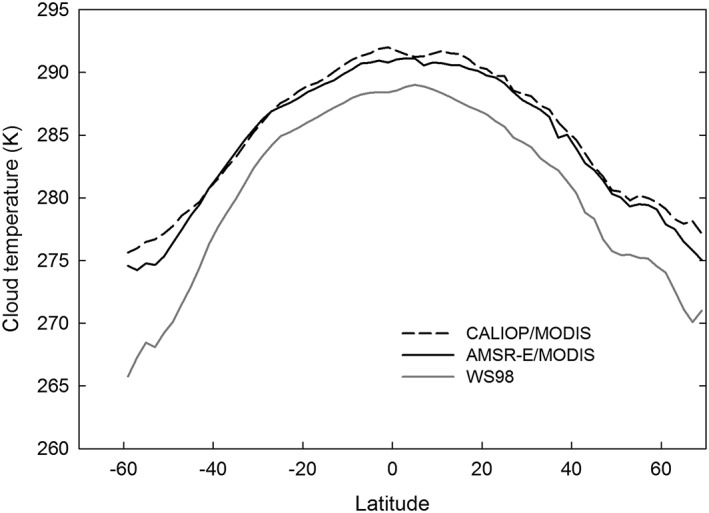
Zonal average cloud temperature derived from the Cloud‐Aerosol Lidar with Orthogonal Polarization cloud top height (CTH) and Moderate Resolution Imaging Spectroradiometer (MODIS) cloud liquid water path (CLWP; dashed), MODIS CTH and Advanced Microwave Scanning Radiometer‐Earth Observing System CLWP (black solid) and Wentz and Spencer (1998) approach for the 2008 collocated multisensor data set.
Our approach estimates cloud temperature based on collocated MODIS bias‐corrected cloud top properties and adiabatic theory, and then compares the CLWP derived from the observed cloud temperature to the original CLWP product. However, because the RSS CLWP algorithm is regression‐based and not publicly available, we use instead (7) to derive a new CLWP. This is justified on the grounds that the training database of simulated brightness temperatures used in developing the RSS regression equations was likely generated using (7) as part of the model function. Also, this approach assumes that the impact of cloud temperature errors on the CLWP retrieval occurs only through changes in the absorption coefficient.
The first step is to compute the liquid water content (LWC) profile by assuming the clouds are adiabatic. The assumption of adiabatic stratification is well‐justified for stratocumulus existing in well‐mixed boundary layers. It will tend to underestimate the depth of warm cumuli that mix significant amounts of dry environmental air into their updrafts. As a result, there will be some tendency for this analysis to underestimate the cloud emission temperature for cumuli. For adiabatic clouds the LWC at cloud top (kg/m3) is related to CLWP through (Wood & Bretherton, 2004):
| (13) |
where CLWP (kg/m2) is observed by the AMSR‐E and c w (kg/m3/m) is the condensation rate or adiabatic rate of change of LWC with height:
| (14) |
where T top is the cloud top temperature (K) observed by MODIS and ρ o is the density of moist air (kg/m3). Equation (14) is fitted to a value of 80% of the adiabatic condensation rate f(p top, T top) assuming a cloud top pressure of 850 hPa (e.g., Ahmad et al., 2013; Albrecht et al., 1990). The fit is good to about ±1.5% between 260 and 300 K. The adiabatic cloud depth (m) can then be computed from (Wood & Bretherton, 2004)
| (15) |
For negative values of AMSR‐E CLWP where (13) and (15) become ill‐defined, the values were set to a fixed CLWP of 0.005 kg/m2 that yields a cloud depth of about 63 m.
Knowing the LWC at cloud top, the cloud top height (also obtained from MODIS observations), cloud depth, and rate of change of LWC with height, the adiabatic LWC profile can be determined. The temperature profile can be obtained by computing the temperature lapse rate (K/km) within the cloud:
| (16) |
where SST (K) is observed by the AMSR‐E and T top and z top are the MODIS bias‐corrected cloud top temperature (K) and cloud top height (km), respectively.
With knowledge of the cloud top height and base along with the temperature/LWC profiles, one way to approximate the cloud temperature (K) is (O'Dell et al., 2008)
| (17) |
where
| (18) |
and z base is the cloud base height (km) and A(z) is the attenuation due to liquid water (dB/km), which is computed from the 1989 version of the Millimeter wave Propagation Model (Liebe, 1989) that compares well with the model used in the RSS retrieval algorithm (Meissner & Wentz, 2004) and is a function of temperature and LWC.
As a test of the accuracy of the cloud temperatures derived from MODIS cloud top temperature/height and AMSR‐E CLWP data, we compared them to cloud temperatures derived from independent CALIOP cloud top temperature/height and MODIS all‐sky CLWP data for the 2008 collocated multisensor data set. Results show the MODIS/AMSR‐E cloud temperatures compare favorably to the CALIOP/MODIS cloud temperatures when zonally averaged for the entire year, except perhaps at the highest latitudes due, probably to biases in the MODIS CTTs (Figure 8). The mean difference between these two estimates of cloud temperature was found to be −0.434 K. We therefore conclude that the AMSR‐E/MODIS‐derived cloud temperatures are sufficiently accurate to provide useful estimates of the cloud temperature bias in AMSR‐E CLWP products. Each of these estimates of cloud temperature is warmer than the WS98 parameterization. Furthermore, the WS98 bias is most likely underestimated because of the physical constraint of the adiabatic assumption, which artificially limits the depth of cumulus clouds.
Using (7) it can be seen that the cloud temperature bias depends nonlinearly on cloud temperature errors and on CLWP (Figure 9). Although the WS98 cloud temperatures are, on average, biased cold by −3.54 K as compared to the CALIOP/MODIS cloud temperatures (see Figure 8), resultant biases in the AMSR‐E CLWP can be either negative or positive depending on the sign of the cloud temperature biases when applied to observations (Figure 10).
Figure 9.
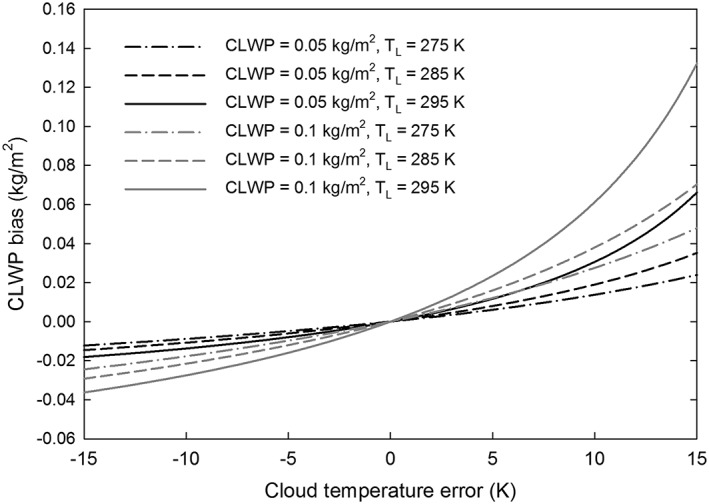
Sensitivity of the bias in cloud liquid water path (CLWP) to cloud temperature error for two CLWP values and a range of cloud temperatures (T L).
Figure 10.
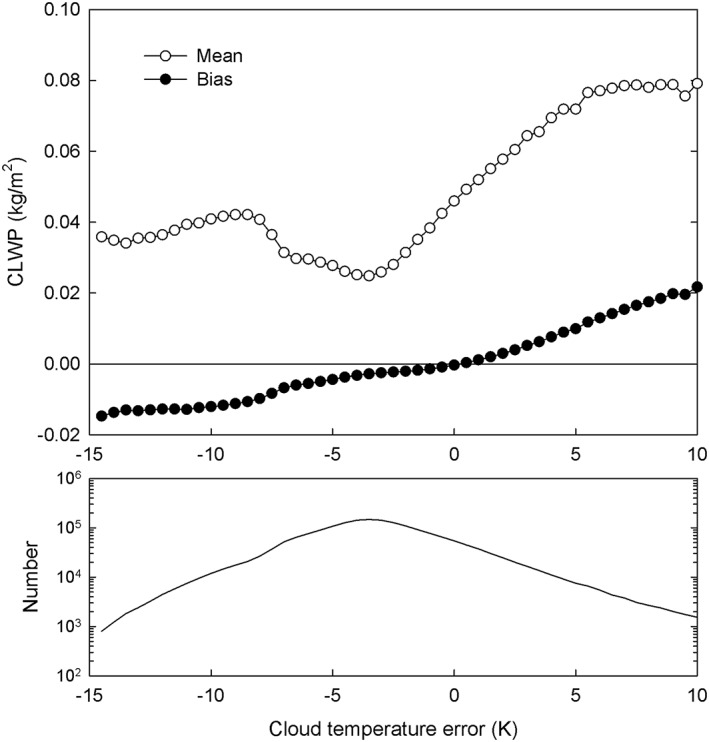
(top) Biases in cloud liquid water path (CLWP) due to errors in cloud temperature as compared to the mean CLWP (open circles) using Advanced Microwave Scanning Radiometer‐Earth Observing System and Moderate Resolution Imaging Spectroradiometer observations for the 2008 collocated multisensor data set. (bottom) Number of observations used in the analysis as a function of cloud temperature error.
3.3.4. Cloud‐Fraction‐Dependent Bias
Satellite PMW observations of CLWP typically exhibit a significant positive bias in broken cloudy scenes that become relatively larger as cloud fraction decreases in comparison to MODIS and ship‐based MWR observations (Horváth & Gentemann, 2007; Painemal et al., 2016; Seethala & Horvath, 2010). This is known as the “cloud‐fraction‐dependent” bias (Figure 11). While caused in part by other known errors such as the cloud‐rain partition bias, its behavior suggests that it contains other contributing sources of error that have yet to be identified.
Figure 11.
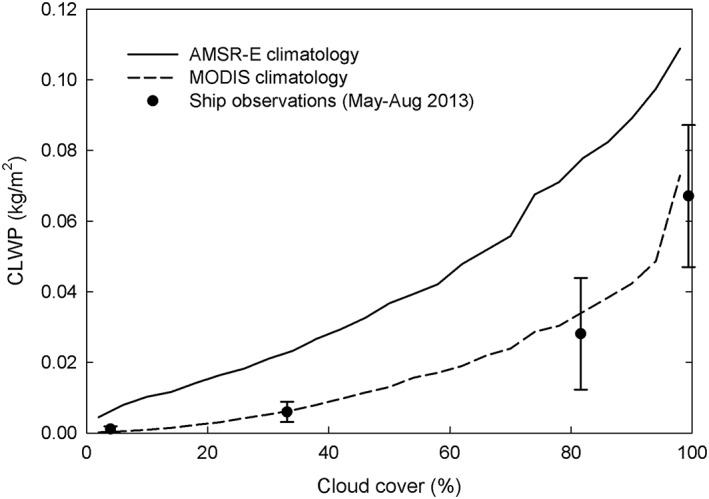
Cloud liquid water path versus cloud cover for Advanced Microwave Scanning Radiometer‐Earth Observing System and Moderate Resolution Imaging Spectroradiometer climatologies (2002–2011 May–Aug) along a line between Hawaii and Los Angeles. Ship‐based microwave radiometer observations from Painemal et al. (2016) are also shown for comparison.
One source of error to be considered is the impact of precipitation on the AMSR‐E CLWP observations. CPR observations show that the frequency of warm rain tends to increase modestly with increasing cloud cover, and then rises sharply in overcast conditions (Figure S1 in the supporting information). This implies that precipitation, either directly or indirectly, may play a role in the cloud‐fraction‐dependent bias. To examine this further, we used the 2008 collocated multisensor data set to classify AMSR‐E warm cloud scenes according to the precipitation conditions. The baseline for the analysis was rain‐free scenes as identified from CPR observations without appreciable nearby precipitation, where “nearby” means that all adjacent AMSR‐E pixels must have CLWP ≤0.18 kg/m2. In relation to warm clouds, this threshold is considered moderate to heavy precipitation, whereas for other cloud types with more vertical development, it is more likely to be light precipitation. The main limitation of this analysis is in precisely identifying scenes that are confidently free of rain since the CPR samples only a small portion of the AMSR‐E footprint (Lebsock & Su, 2014). However, good agreement is found between the baseline AMSR‐E CLWP data and coincident MODIS all‐sky CLWP data in mostly cloudy conditions, suggesting that the influence of rain within the AMSR‐E footprint not sampled by the CPR is rather small.
Scenes were classified according to whether the AMSR‐E pixel of interest contained probable rain and whether there were any adjacent pixels with CLWP >0.018 kg/m2. Measurements affected by adjacent AMSR‐E pixels that contain precipitation are included as a classification parameter because strong emission/absorption effects on the measured 36.5‐GHz brightness temperatures from nearby precipitation can be appreciable through the instrument sidelobes nearest the main beam.
Three precipitation types were identified: (1) rain‐free scenes with nearby precipitation, (2) rainy scenes without nearby precipitation, and (3) rainy scenes with nearby precipitation. In the analysis, AMSR‐E CLWP was limited to ≤0.18 kg/m2 to minimize the cloud‐rain partition errors. As expected, precipitation effects tend to increase with increasing cloud cover (Figure 12). The contributions of these precipitation types to the CLWP are similar in magnitude; however, scenes identified as rainy with nearby precipitation were slightly larger than the other two types. It is also possible that a CLWP bias exists from the impact of the direct emission of raindrops on the PMW brightness temperatures.
Figure 12.
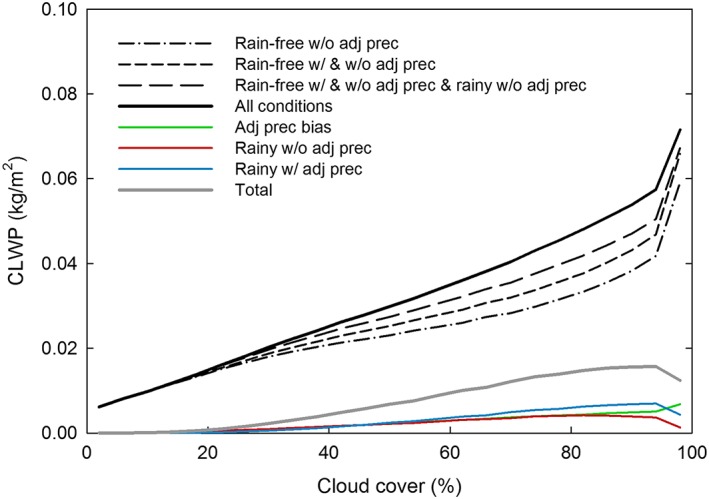
Effects of precipitation classification types on Advanced Microwave Scanning Radiometer‐Earth Observing System cloud liquid water path observations (black curves) and contributions from each class (colored curves) as a function of cloud cover for the 2008 collocated multisensor data set.
Another distinguishing feature of the cloud‐fraction‐dependent bias is a dominant, underlying error that extends from about near 0% to 70% cloud cover. Clues into the nature of this bias can be gleaned from direct comparisons that have been made between satellite PMW CLWP observations and ship‐based MWR observations, which show that it has a strong relationship to water vapor amount and a slight dependence on wind speed (Painemal et al., 2016). These dependencies suggest the same uncertainties in noncloud parameters that constitute the clear‐sky bias may also affect the retrievals in cloudy conditions (e.g., Greenwald, 2009), which we refer to as the in‐cloud bias. However, contributing factors may include undetermined retrieval artifacts, simplifications in how the clouds are modeled in the algorithm (e.g., Stephens & Kummerow, 2007), or even limitations in the measurements themselves (Painemal et al., 2016).
To estimate the in‐cloud bias, we generated TPW‐wind speed LUTs in much the same way as the clear‐sky bias LUTs but instead defined the bias as being the difference between the AMSR‐E CLWP and the MODIS all‐sky CLWP for the baseline rain‐free data set limited to solar zenith angles ≤45° and created separate LUTs for different ranges of cloud cover to form a 3‐D LUT. MODIS CLWP data are appropriate to help quantify this bias because they are expected to have an insignificant dependence on TPW and wind speed. However, Painemal and Zuidema (2011) showed that MODIS C5 CLWP data had a water vapor dependent bias for temperature inversions through a bias in the effective radius due to errors in the specified above‐cloud water vapor path. The C6 effective radius data used in this study, however, properly account for above‐cloud emission (Rausch et al., 2017). The data were smoothed using a moving nearest neighbor averaging approach, and a quadratic surface was fit to the 2‐D LUTs used to fill in regions containing no points or too few points. Also, the AMSR‐E CLWP data were corrected for cloud temperature biases.
The in‐cloud biases generally decrease with increasing wind speed for smaller TPWs and increase with increasing TPW for all cloud cover categories but with some variation in these tendencies (Figure 13). Although this behavior is similar in some respects to the clear‐sky biases, results show that the in‐cloud biases are significantly larger overall than the clear‐sky biases (Figure S2). This implies the clear‐sky bias does not appear to be a major factor in the in‐cloud bias, except perhaps for large TPW, at least for the V7 RSS CLWP products. Earlier studies showing a possible clear‐sky bias effect in warm overcast clouds (e.g., Greenwald, 2009) were based on the V6 products, which have significantly larger clear‐sky biases. Without knowing the details of the retrieval algorithm, it is difficult to establish whether the cause of this bias is retrieval algorithm or measurement related, or a combination of both. Further investigation is needed in a separate study to uncover the specific cause of this bias.
Figure 13.
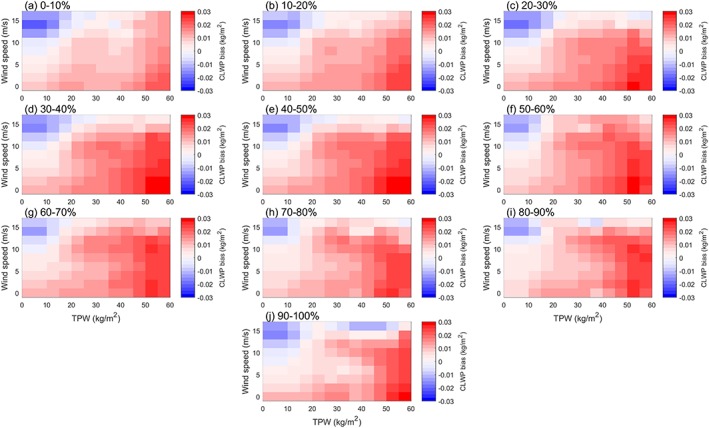
Three‐dimensional look‐up table (LUT) used to compute the in‐cloud bias. Each panel shows the total precipitable water/wind speed LUT for different ranges of cloud cover.
When applied to the baseline rain‐free data set and binned as a function of cloud cover, the in‐cloud bias dominates over the precipitation‐related effects and reaches a peak at around 35%, then falls off with increasing cloud cover (Figure 14). The fact that the biases are largest in partial cloudiness may be due in part to the reduced sensitivity of 36.5‐GHz measurements to CLWP and the increased sensitivity to noncloud parameters. The modest decline in the bias with increasing cloud cover is expected due to nonuniform beam‐filling effects on the microwave measurements in the absence of rain.
Figure 14.
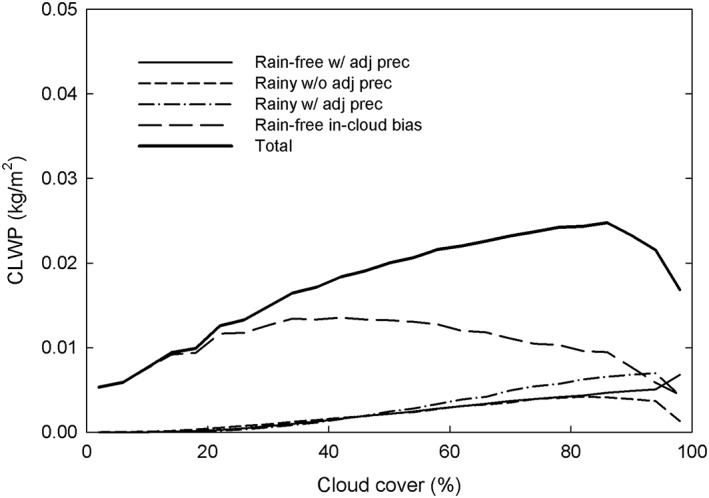
Components of the cloud‐fraction‐dependent bias for the 2008 collocated multisensor data set. The total bias is the sum of these components.
Although predicting in‐cloud biases from AMSR‐E observations is relatively straightforward, this is not the case for the separate precipitation components since adequately classifying precipitation using just an LWP threshold is difficult. However, one component that can be estimated fairly reliably is the impact of nearby precipitation on the AMSR‐E CLWP observation, that is, the adjacent precipitation bias. Using the baseline rain‐free data set, the CLWP for the pixel of interest was compared against the number of adjacent pixels having CLWP >0.18 kg/m2 (Figure 15). Results indicate a power law increase as the number of adjacent pixels with heavy precipitation increase. This relationship was used in predicting the adjacent precipitation bias.
Figure 15.
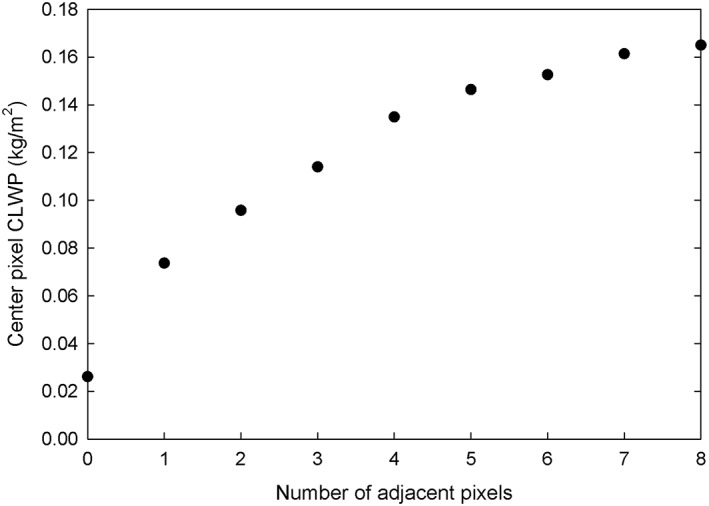
Cloud liquid water path of Advanced Microwave Scanning Radiometer‐Earth Observing System center pixels identified as rain‐free as a function of the number of adjacent pixels containing precipitation for the 2008 collocated multisensor data set.
Before classifying the scenes for precipitation we first corrected the CLWP for the adjacent precipitation bias when CLWP ≤0.18 kg/m2 under the assumption that both rain‐free and rainy scenes are affected by this bias in the same way. Because this bias correction always reduces the CLWP to be less than the criterion used for identifying rain (i.e., CLWP > 0.087 kg/m2), it is not possible to distinguish between scenes that are rain‐free with nearby precipitation and those that are rainy with nearby precipitation using a simple LWP threshold, so these two classification types are combined into one. That leaves one remaining classification type, that is, rainy without nearby precipitation, which is identified for CLWP >0.087 kg/m2 with no nearby precipitation. Comparing the predicted (i.e., using a LWP threshold) adjacent precipitation bias and rainy scenes with no nearby precipitation with those determined by the CPR analysis shows that the adjacent precipitation bias is slightly overestimated, whereas the CLWP for rainy scenes with no adjacent precipitation is greatly underestimated since the predicted CLWP is based solely on the cloud‐rain partition bias, which has been intentionally minimized in this analysis (Figure 16). However, the predicted total effect on the CLWP is roughly the same.
Figure 16.
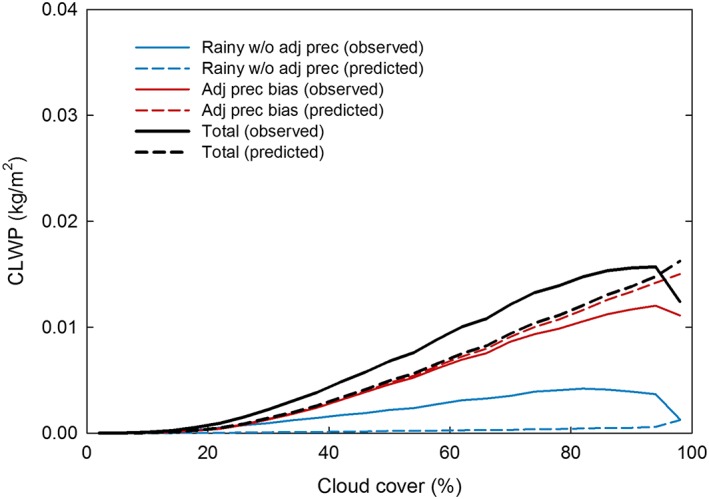
Observed versus predicted precipitation‐related components of the cloud‐fraction‐dependent bias for the 2008 collocated multisensor data set.
4. Spatiotemporal Characteristics of the Errors
The methods described previously to quantify the main sources of systematic error in PMW CLWP observations were applied to the entire 111‐month record (July 2002–September 2011) of the AMSR‐E to investigate how the errors vary in space and time and the extent to which they contribute to the error budget. NOAA 6‐hourly Global Data Assimilation System T126 resolution analyses were used in identifying temperature inversions needed in correcting biases in the MODIS cloud top properties. A L3 uncertainty data set (i.e., 1° × 1° global monthly mean grids) was generated that includes not only CLWP errors but also other pertinent information (Table 4).
Table 4.
Variables Contained Within the AMSR‐E Level 3 CLWP Uncertainty Data Set
| Variables | Description |
|---|---|
| Clear_sky_bias | Clear sky bias as determined from AMSR‐E CLWP obs for clear scenes; LUT is used for clear scenes with nearby precipitation. |
| Number_of_all‐sky_obs | Number of warm cloud plus clear‐sky observations |
| Number_of_clear‐sky_obs | Number of clear‐sky observations |
| Number_of_inversions | Number of temperature inversions as determined from Global Data Assimilation System data |
| Number_of_large_negative_clwp | Number of clear‐sky CLWP values less than −0.03 kg/m2. Used for screening purposes |
| Warm_cloud_temperature_bias | Estimated CLWP error due to biases in cloud temperature for warm clouds |
| Warm_in‐cloud_bias | CLWP error due to in‐cloud biases for CLWP ≤0.018 kg/m2 for warm clouds |
| Warm_adjacent_precipitation_bias | Bias due to adjacent pixels containing precipitation (i.e., CLWP > 0.18 kg/m2) for warm clouds |
| Warm_cloud‐rain_partition_bias | CLWP bias due to biases in the cloud‐rain partition parameterization for warm clouds |
| Warm_clwp_uncorrected | Original CLWP product for warm clouds |
| Warm_clwp_bias‐corrected | Bias‐corrected CLWP product for warm clouds |
| MODIS_warm_cloud_top_temperature_bias‐corrected | Bias‐corrected MODIS cloud top temperature for warm clouds |
| MODIS_warm_cloud_top_height_bias‐corrected | Bias‐corrected MODIS cloud top height for warm clouds |
| MODIS_cloud_cover | Total and warm cloud cover (%) as determined by the MODIS cloud mask |
| Adiabatic_cloud_depth | Derived as a by‐product of the cloud temperature bias calculation |
| Cloud_temperature | Derived as a by‐product of the cloud temperature bias calculation |
The geographic distribution of the individual biases over the 9‐year period reveals that each has its own unique spatial pattern, except the cloud‐rain partition and adjacent precipitation biases which both naturally follow rainfall patterns (Figure 17). As expected, the clear‐sky bias contributes the least to the net bias (Table 5) mainly because clear‐sky scenes occur much less frequently than cloudy scenes and, overall, it is slightly negative except near major deserts and at higher latitudes with higher mean wind speeds where the negative biases are a maximum. The largest source of negative bias is cloud temperature uncertainty, which has maxima at higher latitudes and in cold upwelling regions on the western sides of the continents where the cloud temperature errors are greatest. The distribution of the in‐cloud bias closely follows the distribution of water vapor and thus has its biggest impact in the Tropics. The in‐cloud and cloud‐rain partition biases together contribute 75% of the positive systematic errors in CLWP (Table 5). However, spatially, the net bias follows rainfall patterns since the cloud‐rain partition and adjacent precipitation biases contribute 61% to the positive bias. Globally, the net bias is 0.012 kg/m2 (compared to the mean CLWP of 0.041 kg/m2), but in certain locations, such as the Pacific ITCZ, it can exceed 0.04 kg/m2.
Figure 17.
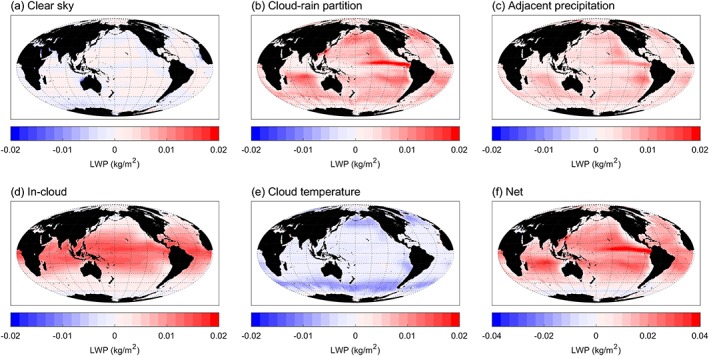
Geographic distribution of cloud liquid water path biases, including the net bias, averaged over the 111‐month period. Range of values has been expanded for the net bias.
Table 5.
Global Means of the 111‐Month Average and Intra‐annual Standard Deviation (SD) of the Individual Biases in AMSR‐E CLWP Observations
| Clear sky (kg/m2) | Cloud‐rain partition (kg/m2) | Adjacent precipitation (kg/m2) | In‐cloud (kg/m2) | Cloud temperature (kg/m2) | Net (kg/m2) | |
|---|---|---|---|---|---|---|
| Mean | −0.00058 | 0.0056 | 0.0038 | 0.0060 | −0.0031 | 0.012 |
| SD | 0.0015 | 0.0059 | 0.0033 | 0.0027 | 0.0026 | 0.0093 |
Distinct geographic distributions are also seen in the seasonal variation of the individual biases. The interannual standard deviation indicates that this variation is dominated by the cloud‐rain partition bias with maxima in the midlatitudes, China Sea, and eastern Pacific ITCZ, which are sometimes as large as 0.02 kg/m2 (Figure 18). Net biases can exceed 0.03 kg/m2 in localized regions within the China Sea and midlatitudes. Globally speaking, the mean seasonal variation of the net bias is 0.0093 kg/m2 in comparison to the mean CLWP standard deviation of 0.025 kg/m2 (Table 5).
Figure 18.
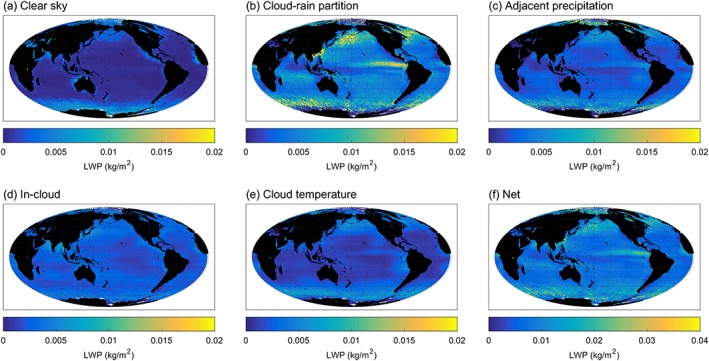
Geographic distribution of the intra‐annual standard deviation of the cloud liquid water path biases, including the net bias. Range of values has been expanded for the net bias. Note that large errors at the highest latitudes are likely due to sea ice contamination.
These biases and their net impact on CLWP can be examined more closely from zonal averages over the 111‐month period (Figure 19). The net bias, in some cases, can be more than 50% of the mean CLWP in the Tropics due to the combined effects of the cloud‐rain partition, in‐cloud, and adjacent precipitation biases. At higher latitudes the net bias approaches zero from compensating negative cloud temperature errors. Consequently, when the original CLWP products are corrected for these biases, the effect is a significant reduction in the CLWP throughout the Tropics and subtropics. In terms of the seasonal variation of the cloud‐rain partition and net biases, the most prominent features are the maximum in the ITCZ and midlatitudes (Figure 19). The effect of correcting for these biases is to significantly reduce the CLWP standard deviation at all latitudes, particularly in the Tropics.
Figure 19.
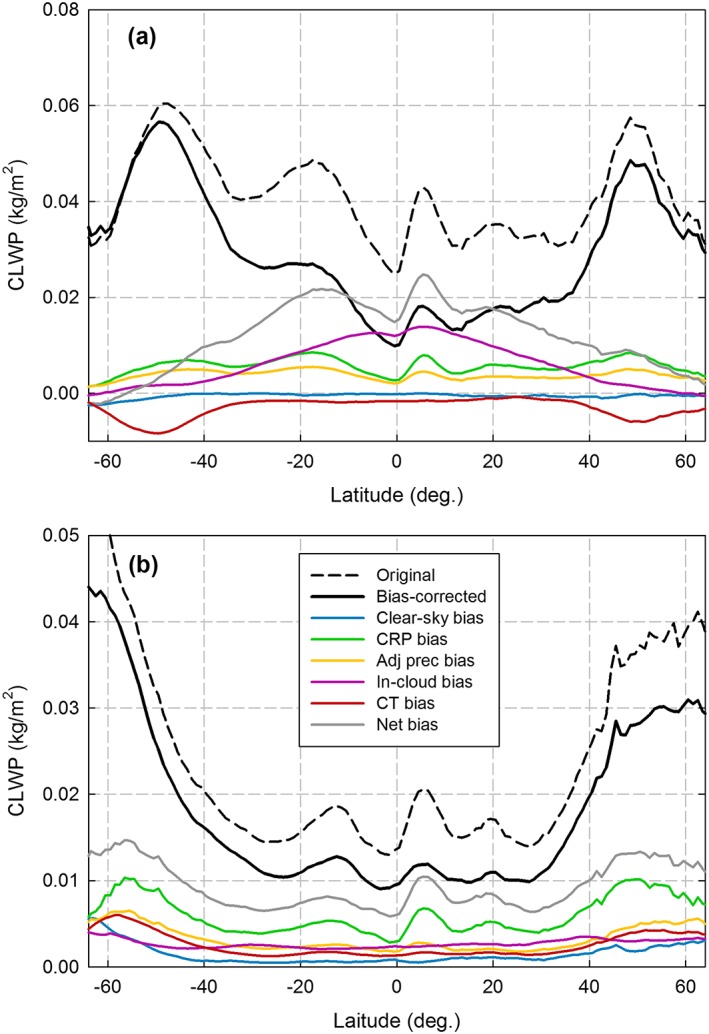
(a) Zonal variation of the 111‐month average cloud liquid water path (CLWP) and bias fields, which includes the net bias and CLWP with and without (original) bias correction. All curves are weighted by their frequency of occurrence, where CT is cloud temperature, CRP is cloud‐rain partition, and the net bias is the sum of the individual biases. (b) Same as (a) but for the intra‐annual standard deviation for CLWP and bias fields.
One critical test of the estimated biases is to evaluate how the bias‐corrected CLWP observations vary with cloud cover. While not a true validation, a qualitative comparison can be made between the AMSR‐E CLWP climatology and ship‐based MWR observations taken in the NE Pacific in May–August 2013 (Painemal et al., 2016). Results show that the bias‐corrected CLWP data are in significantly better agreement with the ship observations, especially for overcast conditions and cloud cover under about 60% (Figure 20). However, the agreement is poorer in mostly cloudy conditions, which may be a result of underestimating precipitation‐related biases based on a simple LWP threshold method used to classify precipitation. Additionally, the assumption of a Marshall‐Palmer raindrop size distribution may contribute to the underestimation of the emission effect of rainwater. This is because for a fixed rainwater content emission efficiency increases with drop size and Marshall‐Palmer size distributions have larger drops than are typically observed in shallow maritime clouds.
Figure 20.
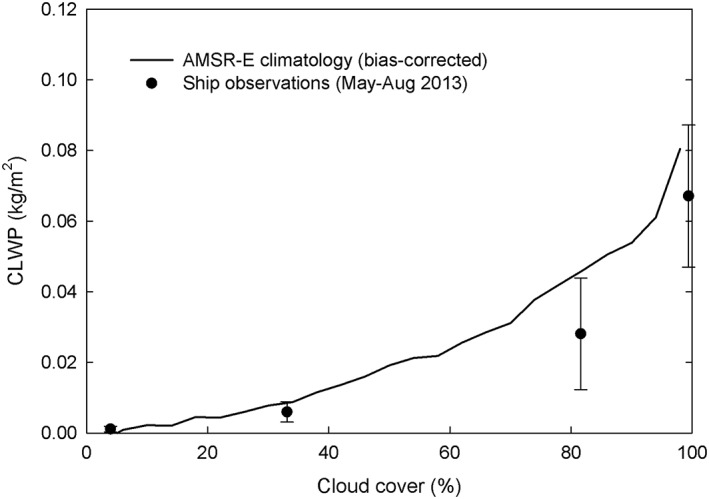
Same as Figure 11 but instead using a bias‐corrected Advanced Microwave Scanning Radiometer‐Earth Observing System cloud liquid water path climatology.
5. Conclusions
New methods have been developed for estimating the inherent systematic errors in PMW CLWP observations of warm clouds and providing these errors as an L3 uncertainty data set available for use in climate studies. These uncertainties are specific to the RSS Version 7 CLWP products, and thus, a new data set must be produced for each successive version of the products or for CLWP products generated from an entirely different algorithm. A multisensor approach for quantifying systematic errors was applied to the entire AMSR‐E record based on a unique merged data set of AMSR‐E and MODIS cloud properties, as well as cloud and precipitation observations from the CloudSat CPR and CALIOP. The uncertainty data set should prove useful, as well, in providing guidance in the interpretation of errors for more complete LWP CDRs, such as MAC‐LWP.
To quantify the cloud‐rain partition bias more accurately, a new cloud‐rain partition parameterization was developed from AMSR‐E, MODIS, CPR, and CALIOP observations to improve the inference of CLWP in warm rain conditions. Like the WS98 scheme, the new parameterization uses a LWP threshold for rain detection; however, the threshold was found to be significantly smaller (0.087 kg/m2) than that used by the WS98 scheme. This had the effect of significantly improving warm rain frequency in the tropics/subtropics but greatly overestimating it at other latitudes. These results speak to a larger issue as to the appropriateness of using LWP thresholds in general for rain detection, at least for warm clouds and coarse resolution observations. Our results support earlier studies that conclude rain detection methods based solely on LWP thresholds are overly simplistic (Stephens & Kummerow, 2007).
Further investigation of the cloud‐fraction‐dependent bias showed that it is composed of a significant in‐cloud bias that depends primarily on cloud cover and TPW, an adjacent precipitation bias, and the cloud‐rain partition bias. The cause of the in‐cloud bias is uncertain but may be related to deficiencies in the retrieval algorithm and/or limitations in 37‐GHz measurements of liquid clouds in higher water vapor environments. Overall, the net systematic error in CLWP was found to be positive, sometimes greater than 50% of the mean in the region from about 40°N to 40°S, which was dominated by the in‐cloud, adjacent precipitation, and cloud‐rain partition biases. Although the global mean bias was 0.012 kg/m2, these errors vary widely from region to region and season to season. Notable regions of large errors include the Pacific ITCZ and the stratocumulus regions of the SE Pacific and southern Indian Ocean. A potential new source of bias was identified near major deserts, suggesting the effects of scattering on 37‐GHz measurements by dust particles. However, until the effects of this bias can be further understood, we recommend that CLWP observations be used with caution in these areas.
One revealing test of CLWP observations is how well they reproduce the relationship between CLWP and cloud cover (e.g., Painemal et al., 2016). A limited evaluation using ship observations in the NE Pacific compared to a bias‐corrected CLWP climatology showed that our estimates of the systematic errors appear reasonable for overcast conditions and cloud cover under about 60% but are slightly overestimated under mostly cloudy conditions. While this may be due in part to the fact that the CLWP data are climatic means, we believe it is more likely related to our inability to fully characterize precipitation‐related biases as a result of not having an independent means of detecting and classifying warm rain. Clearly, there is a need for the use of classification methods that exploit higher microwave frequency measurements (e.g., 89 GHz), which have higher spatial resolution and hold greater promise in warm rain detection (e.g., Miller & Yuter, 2013).
Another important conclusion is that one way to quantify errors and improve the accuracy of PMW CLWP observations is to combine them with visible‐infrared imager cloud observations when possible since PMW measurements alone cannot accurately identify cloud conditions due to their relatively coarse spatial resolution and lower sensitivity to clouds. Other studies have also shown the benefits of combining satellite observations from different sensors in observing cloud and precipitation properties (e.g., Bennartz et al., 2010; Rapp et al., 2009; Stephens & Kummerow, 2007). While the current study combined AMSR‐E and MODIS observations, other possible sensor combinations might include the AMSR2 and MODIS, the Tropical Rainfall Measuring Mission Visible and Infrared Scanner and Tropical Rainfall Measuring Mission Microwave Imager (Greenwald et al., 2007; Rapp et al., 2009), and the Defense Meteorological Satellite Program Special Sensor Microwave Imager Sounder and Operational Linescan System.
The production of uncertainty data sets for PMW CLWP observations is just one part of a broader plan that includes an extensive validation of these observations over many years and over large areas using island‐based and ship‐based MWR observations (e.g., Greenwald et al., 1993; Painemal et al., 2016). A validation of this kind will be investigated in a follow‐up study and should prove valuable in evaluating the bias estimates obtained in this study. Making available the most accurate CLWP observations possible will help to promote the wider use of these observations in constraining cloud feedback in climate models and for climate studies in general.
Supporting information
Supporting Information S1
Acknowledgments
Support was provided by the National Aeronautics and Space Administration (NASA) MEaSUREs (Making Earth System Data Records for Use in Research Environments) Program through subcontract #1479552 with the Jet Propulsion Laboratory. We wish to thank Remote Sensing Systems in Santa Rosa, CA, for making available the Version 7 AMSR‐E L2 ocean swath products. AMSR‐E L2A brightness temperature data were obtained from the NSIDC, CloudSat data were obtained from the CloudSat Data Processing Center (http://www.cloudsat.cira.colostate.edu), CALIOP data were acquired through the NASA Atmospheric Science Data Center (https://eosweb.larc.nasa.gov), and MODIS C6 products and Global Data Assimilation System data were obtained from the NASA LAADS (L1 and Atmospheres Archive and Distribution System; https://ladsweb.modaps.eosdis.nasa.gov). Part of this work was carried out at the Jet Propulsion Laboratory, California Institute of Technology, under contract with NASA. The L3 uncertainty data set and merged AMSR‐E/MODIS L2C data set are available from the Goddard Earth Sciences Data and Information Services Center (GES DISC) DAAC (https://earthdata.nasa.gov/about/daacs/daac-ges-disc). We also thank three anonymous reviewers whose comments helped to improve the manuscript.
Appendix A.
A.1.
Cloud LWP can be defined as
| (A1) |
where z t and z b are the height of the cloud top and cloud bottom, respectively, and the LWC as a function of height is
| (A2) |
where n(r,z)dr is the number of cloud droplets per unit volume with radius between r and r + dr at height z and ρ L is the density of liquid water. A “warm” cloud is one in which the environmental temperature throughout the cloud is greater than 273.15 K.
Greenwald, T. J. , Bennartz, R. , Lebsock, M. , & Teixeira, J. (2018). An Uncertainty Data Set for Passive Microwave Satellite Observations of Warm Cloud Liquid Water Path. Journal of Geophysical Research: Atmospheres, 123, 3668–3687. https://doi.org/10.1002/2017JD027638
References
- Ahmad, I. , Mielonen, T. , Grosvenor, D. P. , Portin, H. J. , Arola, A. , Mikkonen, S. , et al. (2013). Long‐term measurements of cloud droplet concentrations and aerosol‐cloud interactions in continental boundary layer clouds. Tellus B, 20138 https://doi.org/10.3402/tellusb.v65i0.20138 [Google Scholar]
- Albrecht, B. A. , Bretherton, C. S. , Johnson, D. , Schubert, W. H. , & Frisch, A. S. (1995). The Atlantic Stratocumulus Transition Experiment—ASTEX. Bulletin of the American Meteorological Society, 76(6), 889–904. https://doi.org/10.1175/1520-0477(1995)076%3C0889:TASTE%3E2.0.CO;2 [Google Scholar]
- Albrecht, B. A. , Fairall, C. W. , Thomson, D. W. , White, A. B. , Snider, J. B. , & Schubert, W. H. (1990). Surface‐based remote‐ sensing of the observed and the adiabatic liquid water‐content of stratocumulus clouds. Geophysical Research Letters, 17(1), 89–92. https://doi.org/10.1029/GL017i001p00089 [Google Scholar]
- Baum, B. A. , Menzel, W. P. , Frey, R. A. , Tobin, D. , Holz, R. E. , Ackerman, S. A. , et al. (2012). MODIS cloud top property refinements for Collection 6. Journal of Applied Meteorology and Climatology, 51(6), 1145–1163. https://doi.org/10.1175/JAMC-D-11-0203.1 [Google Scholar]
- Bennartz, R. , Watts, P. , Meirink, J. F. , & Roebeling, R. (2010). Rainwater path in warm clouds derived from combined visible/near‐infrared and microwave satellite observations. Journal of Geophysical Research, 115, D19120 https://doi.org/10.1029/2009JD013679 [Google Scholar]
- Bojinski, S. , Verstraete, M. , Peterson, T. C. , Richter, C. , Simmons, A. , & Zemp, M. (2014). The concept of essential climate variables in support of climate research, applications, and policy. Bulletin of the American Meteorological Society, 95, 1432–1443. https://doi.org/10.1175/BAMS-D-13-00047.%201 [Google Scholar]
- Bretherton, C. S. , Uttal, T. , Fairall, C. W. , Yuter, S. E. , Weller, R. A. , Baumgardner, D. , et al. (2004). The Epic 2001 stratocumulus study. Bulletin of the American Meteorological Society, 85(7), 967–978. https://doi.org/10.1175/BAMS-85-7-967 [Google Scholar]
- Cho, H.‐M. , Zhang, Z. , Meyer, K. , Lebsock, M. , Platnick, S. , Ackerman, A. S. , et al. (2015). Frequency and causes of failed MODIS cloud property retrievals for liquid phase clouds over global oceans. Journal of Geophysical Research: Atmospheres, 120, 4132–4154. https://doi.org/10.1002/2015JD023161 [DOI] [PMC free article] [PubMed] [Google Scholar]
- Elsaesser, G. S. , O'Dell, C. W. , Lebsock, M. D. , Bennartz, R. , Greenwald, T. J. , & Wentz, F. J. (2017). The Multi‐Sensor Advanced Climatology of liquid water path (MAC‐LWP). Journal of Climate, 30, 10,193–10,210. https://doi.org/10.1175/JCLI-D-16-0902.1 [DOI] [PMC free article] [PubMed] [Google Scholar]
- Frey, R. A. , Ackerman, S. A. , Liu, Y. , Strabala, K. I. , Zhang, H. , Key, J. R. , & Wang, X. (2008). Cloud detection with MODIS. Part I: Improvements in the MODIS cloud mask for Collection 5. Journal of Atmospheric and Oceanic Technology, 25(7), 1057–1072. https://doi.org/10.1175/2008JTECHA1052.1 [Google Scholar]
- Ge, J. , Huang, J. , Weng, F. , & Sun, W. (2008). Effects of dust storms on microwave radiation based on satellite observation and model simulation over the Taklamakan desert. Atmospheric Chemistry and Physics, 8, 4903–4909. https://doi.org/10.5194/acp-8-4903-2008 [Google Scholar]
- Greenwald, T. J. (2009). A 2 year comparison of AMSR‐E and MODIS cloud liquid water path observations. Geophysical Research Letters, 36, L20805 https://doi.org/10.1029/2009GL040394 [Google Scholar]
- Greenwald, T. J. , L'Ecuyer, T. S. , & Christopher, S. A. (2007). Evaluating specific error characteristics of microwave‐derived cloud liquid water products. Geophysical Research Letters, 34, L22807 https://doi.org/10.1029/2007GL031180 [Google Scholar]
- Greenwald, T. J. , Stephens, G. L. , Vonder Haar, T. H. , & Jackson, D. L. (1993). A physical retrieval of cloud liquid water over the global oceans using Special Sensor Microwave/Imager (SSM/I) observations. Journal of Geophysical Research, 98, 18,471–18,488. [Google Scholar]
- Grosvenor, D. P. , & Wood, R. (2014). The effect of solar zenith angle on MODIS cloud optical and microphysical retrievals. Atmospheric Chemistry and Physics, 14(14), 7291–7321. https://doi.org/10.5194/acp-14-7291-2014 [Google Scholar]
- Hartmann, D. L. , Ockert‐Bell, M. E. , & Michelsen, M. L. (1992). The effect of cloud type on Earth's energy balance: Global analysis. Journal of Climate, 5(11), 1281–1304. https://doi.org/10.1175/1520-0442(1992)005%3C1281:TEOCTO%3E2.0.CO;2 [Google Scholar]
- Hilburn, K. A. , & Wentz, F. J. (2008). Intercalibrated passive microwave rain products from the Unified Microwave Ocean Retrieval Algorithm (UMORA). Journal of Applied Meteorology and Climatology, 47(3), 778–794. https://doi.org/10.1175/2007JAMC1635.1 [Google Scholar]
- Holz, R. E. , Ackerman, S. A. , Nagle, F. W. , Frey, R. , Dutcher, S. , Kuehn, R. E. , et al. (2008). Global MODIS cloud detection and height evaluation using CALIOP. Journal of Geophysical Research, 113, D00A19 https://doi.org/10.1029/2008JD009837 [Google Scholar]
- Holz, R. E. , Platnick, S. , Meyer, K. , Vaughan, M. , Heidinger, A. , Yang, P. , et al. (2015). Resolving ice cloud optical thickness biases between CALIOP and MODIS using infrared retrievals. Atmospheric Chemistry and Physics, 15(20), 29,455–29,495. https://doi.org/10.5194/acpd-15-29455-2015 [Google Scholar]
- Horváth, Á. , & Gentemann, C. (2007). Cloud‐fraction‐dependent bias in satellite liquid water path retrievals of shallow, non‐precipitating marine clouds. Geophysical Research Letters, 34, L22806 https://doi.org/10.1029/2007GL030625 [Google Scholar]
- Horváth, Á. , Seethala, C. , & Deneke, H. (2014). View angle dependence of MODIS liquid water path retrievals in warm oceanic clouds. Journal of Geophysical Research: Atmospheres, 119, 8304–8328. https://doi.org/10.1002/2013JD021355 [DOI] [PMC free article] [PubMed] [Google Scholar]
- IPCC (2007). In Solomon S., et al. (Eds.), Climate change 2007: The physical science basis. Contribution of Working Group I to the fourth assessment report of the Intergovernmental Panel on Climate Change. Cambridge, UK and New York: Cambridge University Press. [Google Scholar]
- Kopp, T. J. , Thomas, W. , Heidinger, A. K. , Botambekov, D. , Frey, R. A. , Hutchison, K. D. , et al. (2014). The VIIRS Cloud Mask: Progress in the first year of S‐NPP toward a common cloud detection scheme. Journal of Geophysical Research: Atmospheres, 119, 2441–2456. https://doi.org/10.1002/2013JD020458 [Google Scholar]
- Lebsock, M. , & Su, H. (2014). Application of active spaceborne remote sensing for understanding biases between passive cloud water path retrievals. Journal of Geophysical Research: Atmospheres, 119, 8962–8979. https://doi.org/10.1002/2014JD021568 [Google Scholar]
- Lebsock, M. D. , & L'Ecuyer, T. S. (2011). The retrieval of warm rain from CloudSat. Journal of Geophysical Research, 116, D20209 https://doi.org/10.1029/2011JD016076 [Google Scholar]
- Lebsock, M. D. , L'Ecuyer, T. S. , & Stephens, G. L. (2011). Detecting the ratio of rain and cloud water in low‐latitude shallow marine clouds. Journal of Applied Meteorology and Climatology, 50(2), 419–432. https://doi.org/10.1175/2010JAMC2494.1 [Google Scholar]
- Lebsock, M. D. , Stephens, G. L. , & Kummerow, C. (2008). Multisensor satellite observations of aerosol effects on warm clouds. Journal of Geophysical Research, 113, D15205 https://doi.org/10.1029/2008JD009876 [Google Scholar]
- Liebe, H. J. (1989). MPM—An atmospheric millimeter‐wave propagation model. International Journal of Infrared and Millimeter Waves, 10(6), 631–650. https://doi.org/10.1007/BF01009565 [Google Scholar]
- Liu, G. , & Curry, J. A. (1993). Determination of characteristics of cloud liquid water from satellite microwave measurements. Journal of Geophysical Research, 98(D3), 5069–5092. https://doi.org/10.1029/92JD02888 [Google Scholar]
- Liu, J. , Li, Z. , & Cribb, M. (2016). Response of marine boundary layer cloud properties to aerosol perturbations associated with meteorological conditions from the 19‐month AMF‐Azores campaign. Journal of the Atmospheric Sciences, 73, 4253–4268. https://doi.org/10.1175/JAS-D-15-0364.1 [Google Scholar]
- Manaster, A. , O'Dell, C. W. , & Elsaesser, G. (2017). Evaluation of cloud liquid water path trends using a multidecadal record of passive microwave observations. Journal of Climate, 30(15), 5871–5884. https://doi.org/10.1175/JCLI-D-16-0399.1 [DOI] [PMC free article] [PubMed] [Google Scholar]
- Marchant, B. , Platnick, S. , Meyer, K. , Arnold, G. T. , & Riedi, J. (2016). MODIS Collection 6 shortwave‐derived cloud phase classification algorithm and comparisons with CALIOP. Atmospheric Measurement Techniques, 9(4), 1587–1599. https://doi.org/10.5194/amt-9-1587-2016 [DOI] [PMC free article] [PubMed] [Google Scholar]
- Meissner, T. , & Wentz, F. J. (2004). The complex dielectric constant of pure and sea water from microwave satellite observations. IEEE Transactions on Geoscience and Remote Sensing, 42(9), 1836–1849. https://doi.org/10.1109/TGRS.2004.831888 [Google Scholar]
- Miller, M. A. , & Yuter, S. (2013). Detection and characterization of heavy drizzle cells within subtropical marine stratocumulus using AMSR‐E 89‐GHz passive microwave measurements. Atmospheric Measurement Techniques, 6(1), 1–13. https://doi.org/10.5194/amt-6-1-2013 [Google Scholar]
- Nagle, F. W. , & Holz, R. E. (2009). Computationally efficient methods of collocating satellite, aircraft, and ground observations. Journal of Atmospheric and Oceanic Technology, 26(8), 1585–1595. https://doi.org/10.1175/2008JTECHA1189.1 [Google Scholar]
- Nakajima, T. , & King, M. D. (1990). Determination of the optical thickness and effective radius of clouds from reflected solar radiation measurements. Part I: Theory. Journal of the Atmospheric Sciences, 47(15), 1878–1893. https://doi.org/10.1175/1520-0469(1990)047%3C1878:DOTOTA%3E2.0.CO;2 [Google Scholar]
- Norris, J. R. , Allen, R. J. , Evan, A. T. , Zelinka, M. D. , O'Dell, C. W. , & Klein, S. A. (2016). Evidence for climate change in the satellite cloud record. Nature, 536(7614), 72–75. https://doi.org/10.1038/nature18273 [DOI] [PubMed] [Google Scholar]
- O'Dell, C. W. , Wentz, F. J. , & Bennartz, R. (2008). Cloud liquid water path from satellite‐based passive microwave observations: A new climatology over the global oceans. Journal of Climate, 21(8), 1721–1739. https://doi.org/10.1175/2007JCLI1958.1 [Google Scholar]
- Painemal, D. , Greenwald, T. , Cadeddu, M. , & Minnis, P. (2016). First extended validation of satellite microwave liquid water path with ship‐based observations of marine low clouds. Geophysical Research Letters, 43, 6563–6570. https://doi.org/10.1002/2016GL069061 [Google Scholar]
- Painemal, D. , Minnis, P. , & Sun‐Mack, S. (2013). The impact of horizontal heterogeneities, cloud fraction, and liquid water path on warm cloud effective radii from CERES‐like Aqua MODIS retrievals. Atmospheric Chemistry and Physics, 13(19), 9997–10003. https://doi.org/10.5194/acp-13-9997-2013 [Google Scholar]
- Painemal, D. , & Zuidema, P. (2011). Assessment of MODIS cloud effective radius and optical thickness retrievals over the Southeast Pacific with VOCALS‐REx in situ measurements. Journal of Geophysical Research, 116, D24206 https://doi.org/10.1029/2011JD016155 [Google Scholar]
- Painemal, D. , & Zuidema, P. (2013). The first aerosol indirect effect quantified through airborne remote sensing during VOCALS‐REx. Atmospheric Chemistry and Physics, 13(2), 917–931. https://doi.org/10.5194/acp-13-917-2013 [Google Scholar]
- Partain, P . (2007). Cloudsat ECMWF‐AUX auxiliary data process description and interface control document. Retrieved from http://www.cloudsat.cira.colostate.edu/data-products/level-aux/ecmwf-aux?term=64
- Platnick, S. , Meyer, K. G. , King, M. D. , Wind, G. , Amarasinghe, N. , Marchant, B. , et al. (2016). The MODIS cloud optical and microphysical products: Collection 6 updates and examples from Terra and Aqua. IEEE Transactions on Geoscience and Remote Sensing, 55, 502–525. https://doi.org/10.1109/TGRS.2016.2610522 [DOI] [PMC free article] [PubMed] [Google Scholar]
- Platnick, S. , King, M. D. , Meyer, K. G. , Wind, G. , Amarasinghe, N. , Marchant, B. , et al. (2015). MODIS cloud optical properties: User guide for the Collection 6 level‐2 MOD06/MYD06 product and associated level‐3 datasets Retrieved from https://modis-images.gsfc.nasa.gov/_docs/C6MOD06OPUserGuide.pdf
- Poetzsch‐Heffter, C. , Liu, Q. , Ruperecht, E. , & Simmer, C. (1995). Effect of cloud types on the Earth radiation budget calculated with the ISCCP Cl dataset: Methodology and initial results. Journal of Climate, 8(4), 829–843. https://doi.org/10.1175/1520-0442(1995)008%3C0829:EOCTOT%3E2.0.CO;2 [Google Scholar]
- Rapp, A. D. , Kummerow, C. , & Elsaesser, G. (2009). A combined multisensor optimal estimation retrieval algorithm for oceanic warm rain clouds. Journal of Applied Meteorology and Climatology, 48(11), 2242–2256. https://doi.org/10.1175/2009JAMC2156.1 [Google Scholar]
- Rausch, J. , Meyer, K. , Bennartz, R. , & Platnick, S. (2017). Differences in liquid cloud droplet effective radius and number concentration estimates between MODIS collections 5.1 and 6 over global oceans. Atmospheric Measurement Techniques, 10(6), 2105–2116. https://doi.org/10.5194/amt-10-2105-2017 [DOI] [PMC free article] [PubMed] [Google Scholar]
- Saavedra, P. , Battaglia, A. , & Simmer, C. (2012). Partitioning of cloud water and rainwater content by ground‐based observations with the Advanced Microwave Radiometer for Rain Identification (ADMIRARI) in synergy with a micro rain radar. Journal of Geophysical Research, 117, D05203 https://doi.org/10.1029/2011JD016579 [Google Scholar]
- Seethala, C. , & Horvath, A. (2010). Global assessment of AMSR‐E and MODIS cloud liquid water path retrievals in warm oceanic clouds. Journal of Geophysical Research, 115, D13202 https://doi.org/10.1029/2009JD012662 [DOI] [PMC free article] [PubMed] [Google Scholar]
- Stephens, G. L. , & Kummerow, C. D. (2007). The remote sensing of clouds and precipitation from space: A review. Journal of the Atmospheric Sciences, 64(11), 3742–3765. https://doi.org/10.1175/2006JAS2375.1 [Google Scholar]
- Teixeira, J. , Waliser, D. , Ferraro, R. , Gleckler, P. , Lee, T. , & Potter, G. (2014). Satellite observations for CMIP5: The Genesis of Obs4MIPs. Bulletin of the American Meteorological Society, 95(9), 1329–1334. https://doi.org/10.1175/BAMS-D-12-00204.1 [Google Scholar]
- Wentz, F. , & Meissner, T. (2000). AMSR ocean algorithm. Algorithm theoretical basis document, Version 2. Santa Rosa, CA; Remote Sensing Systems.
- Wentz, F. , & Meissner, T. (2007). Supplement 1 algorithm theoretical basis document for AMSR‐E ocean algorithms. Santa Rosa, CA: Remote Sensing Systems. [Google Scholar]
- Wentz, F. J. (2015). A 17‐yr climate record of environmental parameters derived from the Tropical Rainfall Measuring Mission (TRMM) microwave imager. Journal of Climate, 28(17), 6882–6902. https://doi.org/10.1175/JCLI-D-15-0155.1 [Google Scholar]
- Wentz, F. J. , & Spencer, R. W. (1998). SSM/I rain retrievals within a unified all‐weather ocean algorithm. Journal of the Atmospheric Sciences, 55(9), 1613–1627. https://doi.org/10.1175/1520-0469(1998)055%3C1613:SIRRWA%3E2.0.CO;2 [Google Scholar]
- Winker, D. M. , Vaughan, M. A. , Omar, A. , Hu, Y. , Powell, K. A. , Liu, Z. , et al. (2009). Overview of the CALIPSO mission and CALIOP data processing algorithms. Journal of Atmospheric and Oceanic Technology, 26(11), 2310–2323. https://doi.org/10.1175/2009JTECHA1281.1 [Google Scholar]
- Wood, R. , & Bretherton, C. S. (2004). Boundary layer depth, entrainment, and decoupling in the cloud‐capped subtropical and tropical marine boundary layer. Journal of Climate, 17(18), 3576–3588. https://doi.org/10.1175/1520-0442(2004)017%3C3576:BLDEAD%3E2.0.CO;2 [Google Scholar]
- Zhang, Z. , Ackerman, A. S. , Feingold, G. , Platnick, S. , Pincus, R. , & Huiwen, X. (2012). Effects of cloud horizontal inhomogeneity and drizzle on remote sensing of cloud droplet effective radius: Case studies based on large‐eddy simulations. Journal of Geophysical Research, 117, D19208 https://doi.org/10.1029/2012JD017655 [Google Scholar]
- Zhou, X. , Kollias, P. , & Lewis, E. R. (2015). Clouds, precipitation, and marine boundary layer structure during the MAGIC field campaign. Journal of Climate, 28(6), 2420–2442. https://doi.org/10.1175/JCLI-D-14-00320.1 [Google Scholar]
- Zuidema, P. , Painemal, D. , Szoeke, S. , & Fairall, C. (2009). Stratocumulus cloud‐top height estimates and their climatic implications. Journal of Climate, 22(17), 4652–4666. https://doi.org/10.1175/2009JCLI2708.1 [Google Scholar]
Associated Data
This section collects any data citations, data availability statements, or supplementary materials included in this article.
Supplementary Materials
Supporting Information S1


