

SUMMARY
Genomic sequencing has driven precision-based oncology therapy; however, genetic drivers remain unknown or non-targetable for many malignancies, demanding alternative approaches to identify therapeutic leads. Ependymomas are chemotherapy-resistant brain tumours, which, despite genomic sequencing, lack effective molecular targets. Intracranial ependymomas are segregated based on anatomical location – supratentorial region (ST) or posterior fossa (PF) – and further divided into distinct molecular subgroups that reflect differences in age of onset, gender predominance, and response to therapy1–3. The most common and aggressive subgroup, Posterior Fossa Ependymoma Group A (PF-EPN-A), occurs in young children and appears to lack recurrent somatic mutations2. Conversely, Posterior Fossa Ependymoma Group B (PF-EPN-B) tumours display frequent large-scale copy number gains and losses yet favourable clinical outcomes1,3. Greater than 70% of supratentorial ependymomas are defined by highly recurrent gene fusions in the NFκB subunit RELA (ST-EPN-RELA), and less frequently involve fusion of the gene encoding the transcriptional activator YAP1 (ST-EPN-YAP1).1,3,4 Subependymomas, a distinct histologic variant, can also be found within the ST and PF compartments accounting for the majority of tumours in the molecular subgroups ST-EPN-SE and PF-EPN-SE, respectively1. Here, we mapped active chromatin landscapes in 42 primary ependymomas in two non-overlapping primary ependymoma cohorts with the goal of identifying essential super enhancer associated genes on which tumour cells were dependent. Enhancer regions revealed putative oncogenes, molecular targets, and pathways, which when subjected to small molecule inhibitor or shRNA treatment, diminished proliferation of patient-derived neurospheres and increased survival in mouse models of ependymomas. Through profiling of transcriptional enhancers, our study provides a framework for target and drug discovery in other cancers recalcitrant to therapeutic development because of their lack of known genetic drivers.
To pinpoint genes that depend on enhancers for their role in tumour formation, we characterized regions of actively transcribed chromatin in 42 primary intracranial ependymomas using histone 3 lysine 27 acetylation chromatin immunoprecipitation and sequencing (H3K27ac ChIP-seq), a histone mark of active chromatin, on two independent cohorts of fresh-frozen primary ependymoma specimens in two different facilities ('Heidelberg' and 'Toronto'), each with a different H3K27 acetylation specific antibody. Our analysis focused on the intersection of shared enhancers between these two datasets, integrated with whole exome sequencing (WES), whole genome sequencing (WGS), RNA-seq, DNA copy-number analysis, and DNA methylation profiling (Extended Data Fig. 1–2 Supplementary Table 1-7). ‘Active’ typical enhancers were defined as significant H3K27ac peaks outside 2.5 kilobases from the nearest transcriptional start site. To perform unsupervised hierarchical clustering, the top 10,000 variant enhancer loci from both cohorts were compared to the Roadmap Epigenomics and ENCODE databases5 (Fig. 1a, Extended Data Fig. 3,4). Ependymoma enhancer profiles were unique from those of other tissue types, marked by acquisition and loss of hundreds of enhancer loci (Extended Data Fig. 4). Consistent with prior literature, super enhancer (SE) domains were significantly associated with greater transcriptional load6–9 (Extended Data Fig. 4). We identified 2196 and 3176 SEs in the Heidelberg and Toronto cohorts, respectively, and both cohorts shared a large proportion of SE regions (Fig. 1b-e, Supplementary Table 8-10, Extended Data Fig. 4). The vast majority of SEs were tumour-specific and enriched with cancer-associated genes reported in other solid cancers, including PAX6, SKI, FGFRL1, FGFR1, and BOC (Fig. 1b,c, Supplementary Table 10, Extended Data Fig. 4). Several of these genes, such as EPHB2 and CCND1, have been previously validated as ependymoma oncogenes10–12 (Extended Data Fig. 5).
Figure 1. H3K27ac profiles define active regulatory elements of ependymoma.
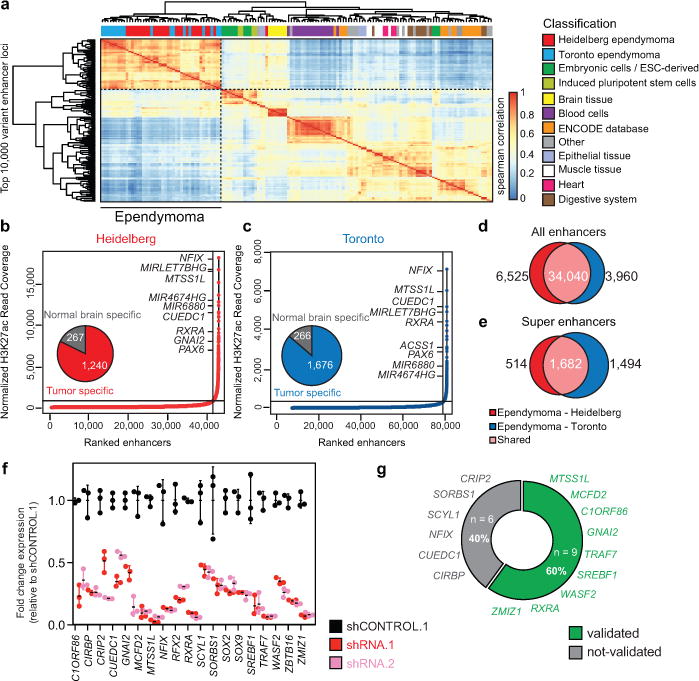
(a) Unsupervised hierarchical clustering of the top 10,000 variant enhancer loci detected in ependymoma as compared to the Roadmap Epigenomics Consortium samples, n = 143 independent samples. (b-c) Inflection plot indicating ependymoma super enhancers (SEs) identified. (d-e) Venn diagram depicting the number of shared enhancers (d) and SEs (e) between the Heidelberg (n = 24) and Toronto (n = 18) ependymoma independent sample cohorts. (f) Quantitative RT-PCR knockdown efficiency of 15 ependymoma SE associated genes (n = 3 technical replicates, error bars indicated as standard deviation. Results were reproduced in independent biological duplicates). (g) Percent of top ependymoma SE genes that demonstrate greater than 50% decrease in viability over 7 days. Cell survival from knockdown of each gene assayed and independently replicated as biological triplicates.
To determine if SEs reveal pathways and genes on which ependymoma cells are dependent, and which could be actionable by targeted therapy, the 15 top-ranking ependymoma SE genes were validated in a series of 60 RNA interference shRNA knockdown time-course studies to demonstrate the feasibility of our approach to uncover novel cancer targets (Extended Data Fig. 6). Following transduction of EP1-NS cells (ST-EPN-RELA) with shRNA constructs, the top two most effective and specific shRNA constructs per gene were functionally validated (Fig. 1f). Globally, depletion of the top-ranking tumour-specific SE genes impaired cell growth to varying degrees over seven days, as compared to non-targeting shRNA controls (Extended Data Fig. 7). Using a stringent cut-off of shRNA-mediated growth inhibition by two independent shRNA constructs (delineated as shRNA.1 and shRNA.2) of ≥ 50% decrease in cell viability over seven days, a majority (60%) of ependymoma SE genes were required for cellular maintenance, supporting SE mapping as a viable approach for therapeutic target identification (Fig. 1g).
We next asked whether distinct enhancer landscapes between molecular subgroups of ependymoma reflect transcriptional differences. In both cohorts, unsupervised hierarchical clustering of all enhancers demonstrated an unbiased segregation of ependymoma molecular subgroups (Fig. 2a-d, Extended Data Fig. 5). Molecular differences between ependymoma subgroups were supported by robust segregation at the DNA methylation level (Fig. 2c). Subgroup-specific typical enhancers were enriched within large H3K27 acetylated domains (i.e. SEs), confirmed by unsupervised segregation of ependymoma subgroups using SE regions (Fig. 2e,f, Extended Data Fig. 5). We termed this distinct class of SEs with subgroup specific enhancer activity as SE-SSEAs, and similarly TEs with subgroup specific activity as TE-SSEAs. Over 86% of SE-SSEAs observed in the Heidelberg cohort were confirmed by the Toronto cohort as active SEs in the respective subgroup (Extended Data Fig. 5), thus uncovering a distinct subset of SEs most common in the PF-EPN-A, PF-EPN-B and ST-EPN-RELA subgroups of ependymoma (Fig. 2g-l, Extended Data Fig. 5, Supplementary Table 11-16). Due to the low prevalence of ST-EPN-YAP1, ST-SE, and PF-SE tumours, these tumours were not represented in the Toronto cohort, and further downstream analysis was based on the Heidelberg cohort alone (Fig. 2g-l, Extended Data Fig. 5, Supplementary Table 11-16). SE-SSEA genes were associated with subgroup-specific gene expression, further supporting the role of SEs as important contributors to transcriptional output (Extended Data Fig. 5, Supplementary Table 11-16). SE-SSEA genes also converged on a subset of signalling pathways that distinguished the molecular subgroups of ependymoma, such as the polycomb repressive complex 1 (PRC1) and histone deacetylase (HDAC4) pathways in ST-EPN-RELA tumours, both of which can be inhibited by small molecules (Fig. 2m, Extended Data Fig. 5, Supplementary Table 17).
Figure 2. Active enhancers delineate subgroups of ependymoma.

(a-b) Unsupervised hierarchical clustering of all H3K27ac enhancer loci in Heidelberg (n = 24) and Toronto (n = 18) independent sample cohorts (c) Combined t-SNE analysis of the top 10,000 variably methylated Illumina 450K CpG probes. (d) Combined t-SNE analysis of all enhancer loci. n = 43 independent samples. (e-f) t-SNE analysis of the H3K27ac marked ependymoma SE regions in ependymoma. n = 42 independent samples. (g-l) Inflection plot indicating the SEs with subgroup specific enhancer activity (SE-SSEA) in ependymoma. n = 24 independent samples. (m) G-profiler pathway analysis of ependymoma subgroup SE associated genes with significant enrichment indicated as the FDR corrected p-value. n = 24 independent samples.
To translate identified SE-SSEA genes in subgroups of ependymoma into novel therapeutic leads, we first focused on ST-EPN-RELA tumours, where we observed a SE-SSEA proximal to CACNA1H and associated with its subgroup-restricted gene expression (Extended Data Fig. 8). CRISPR-dCAS9 mediated repression of active constituent enhancers within the CACNA1H SE resulted in down-regulation of CACNA1H gene expression (Extended Data Fig. 8). As compared to a PF-EPN-A primary culture (S15-NS), cell proliferation of a ST-EPN-RELA patient-derived primary culture model (EP1-NS) was specifically impaired by shRNA-mediated knockdown of CACNA1H or pharmacologic blockade of its activity using the calcium channel inhibitor mibefradil (Extended Data Fig. 8). In a similar fashion, the SE regulated gene, IGF2BP1, we found preferentially in a subset of PF-EPN-A tumours. shRNA-mediated targeting of IGF2BP1 in PF-EPN-A ependymoma cultures, but not ST-EPN-RELA primary cultures, impaired cell proliferation, implicating IGF2BP1 as a potential cancer dependency gene in PF-EPN-A ependymoma (Extended Data Fig. 8). Our findings thus identify candidate oncogenes that are associated with SEs, as well as novel pathways specific to subgroups of ependymoma.
Regulation of cell type specific gene expression is often dominated by only a small number of core transcription factors (TFs) out of the hundreds expressed within a given cell type13. While many significant TF motifs were enriched across shared enhancers of ependymoma, such as FOSL1, FOSL2, SOX9, RFX2, and SOX2 (Fig. 3a, Supplementary Table 18), we sought to identify the principal TFs of ependymoma that govern ependymoma cell identity across subgroups using core regulatory circuitry analysis8,14 (Fig. 3b, Extended Data Fig. 9, Supplementary Table 19). A small set of highly active TFs was identified, including SOX9, RFX2, SOX2, ZBTB16, HES1, NFIA, and NFIB, which were highly expressed in ependymoma as compared to their expression in a large collection of normal brain tissues (Fig. 3b, Extended Data Fig. 9). In contrast, TFs that exhibited lower relative activity exhibited no significant difference in gene expression compared to normal brain (Extended Data Fig. 9). RNA interference (RNAi) was used to functionally validate that the ependymoma core TFs – SOX9, RFX2, SOX2, and ZBTB16 – were essential for ependymoma cell maintenance (Fig. 3c-f, Extended Data Fig. 7). We hypothesized that this core model would be further specified by additional TFs that delineate the transcriptional differences between molecular subgroups of ependymoma. An integrative analysis was performed to assess subgroup specific enhancers, the expression of their target genes within local topological associated domains15, and the enrichment of subgroup specific TF binding motifs at these subgroup specific enhancer loci. Using this approach, we modelled regulatory circuitry maps of each molecular subgroup of ependymoma, as defined by distinct sets of TFs, potentially utilized in order to establish and/or maintain ependymoma subgroup identity (Fig. 3g-l, Supplementary Table 20).
Figure 3. Transcription factor circuitries of ependymoma.

(a) DNA motifs enriched within shared ependymoma typical enhancers that overlay with ATAC-seq peaks derived from the EP1-NS cell culture model as determined by HOMER motif analysis (see Methods and Supplementary Table 18) (b) Heatmap of transcription factors (TFs) ranked by predicted activity using core circuitry analysis (left panel) and presence or absence of self-loop activity (right panel). n = 18 independent samples of Toronto cohort. (c-f) shRNA constructs targeting SE associated genes ordered by normalized cell survival. Highlighted in red are shRNAs targeting SE associated core TFs. Each gene assayed with 6 technical replicates and replicated in 3 independent biological experiments. (g-l) Connections between subgroup specific transcription factors (TF) integrated with gene expression in subgroups of ependymoma. n = 24 independent samples.
We leveraged subgroup-specific SE-regulated TFs to provide further insight into the lineage programs of ependymoma (Extended Data Fig. 10). The rationale for these experiments stemmed from our observation that in zebrafish embryos, several subgroup-specific SEs were active in specific regions within the developing central nervous system (Extended Data Fig. 9). We identified a FOXJ1 TF network enriched in PF-EPN-B ependymoma (Extended Data Fig. 10). FOXJ1 is expressed during murine embryonic development at E13.5 (a time point during expansion of radial glial cells (RGCs), which are candidate cells-of-origin of ependymoma) and observed restricted expression of FOXJ1 in the regions surrounding the choroid plexus in the mouse forebrain and hindbrain (Extended Data Fig. 10). Comparing to other brain tumour types, FOXJ1 expression was increased in ependymomas, with the highest levels in PF-EPN-B tumours16 (Extended Data Fig. 10). Furthermore, we found that the ependymal differentiation program in RGC-derived FOXJ1 expressing cells versus FOXJ1 knockout cells was significantly and specifically enriched in PF-EPN-B ependymomas (Extended Data Fig. 10). From these data, we hypothesized that the transcriptional program of PF-EPN-B tumours closely resembles a more differentiated cell-type along the ependymal lineage compared to ependymomas previously shown to match more primitive RGC precursor populations11.
To inform the clinical translation of ependymoma dependencies, we prioritized targets for which small molecules were available by integrating our analysis of tumour specific SE regulated genes with the Washington University Drug Gene interaction database (Fig. 4a, Supplementary Table 21).17 HDAC7, EPHA2, FGFR1, and CACNA1H were identified as candidate ependymoma gene dependencies that could be responsive to small molecule inhibitors (Fig. 4a). Numerous subtype-restricted lead compounds were also identified (Supplementary Table 22). Active SEs marking molecular dependencies for ependymomas suggested that ependymoma cells would be responsive to BET bromodomain protein inhibition (i.e. JQ1), which blocks protein 'readers' of H3K27 acetylation. JQ1 inhibited the proliferation of ependymoma cells at clinically achievable nanomolar concentrations and showed limited efficacy against normal brain cell proliferation (Fig. 4b). Our SE analysis identified FGFR1 small molecule inhibitors as possible pan-ependymoma therapies, whereas WEE1 inhibitors likely active for subsets of ependymoma. AZD4547 (FGFR1 inhibitor) and AZD1775 (WEE1 inhibitor) exhibited potent and clinically achievable anti-tumour activity (Fig. 4c,d). AZD4547 therapy of immunodeficient mice bearing PF ependymoma intracranial xenografts (H.612) extended survival (Fig. 4e), suggesting that chromatin landscapes inform therapeutic paradigms.
Figure 4. Active regulatory maps identify candidate drugs against ependymoma.

(a) Pie graph of candidate drug compounds detected by integrating shared SEs with the Washington University Drug Gene Interaction Database. (b-d) Ependymoma cells and NSC (NSC1) controls treated with JQ1 (b), AZD1775 (c), and AZD4547 (d) for 72h and assessed using an Alamar Blue stain. Error bars as standard deviation. Experiment performed as six technical replicates and replicated in biological triplicates. (e) Kaplan - Meier curve for immunodeficient mice bearing H.612 ependymomas, treated with either vehicle or AZD4547 (25 mg/kg/d). Significance of endpoint difference was assessed using a log-rank test. Median survival ratio of Treatment (AZD4547) : Control (vehicle) is 44 days : 33 days, and reported as a ratio of 1.333 with a 95% confidence interval of 0.4677 to 3.801.
Using data we generated on active chromatin landscapes within ependymomas, our study identified tumour- and subgroup- specific SE driven genes in ependymoma as potential leads for further testing. By integrating our data with drug interaction databases, we identified and validated novel cancer dependencies of ependymoma that are responsive to pharmacologic inhibition. Our study further demonstrates that knowledge of enhancer landscapes can be used to dissect the molecular differences between histologically similar tumour entities and provide unique information that may inform precision therapies. These differences are captured by the characterization of variant enhancer and SE loci, in addition to the reverse engineering of core transcriptional regulatory circuitries in tumours. Finally, as shown in ependymoma and other tumours, knowledge of core and subgroup-specific TFs reveals a molecular basis for the oncogenic transcriptional programs of cancer, and provides insight into lineage programs that persist in the neoplastic state8.
METHODS
Patients and tumour samples
Tumour samples, clinical information, and animal studies were processed in approval with local ethics institutional review board (IRB) from both the Heidelberg and Toronto institutions. From all patients informed consent was obtained. No subject underwent chemotherapy or radiotherapy prior to the surgical removal of the primary tumour. In the sequencing cohort of tumour samples, at least 80% of tumour cell content was estimated by staining cryosections (~5 μm thick) of each sample with hematoxylin and eosin as described previously2. Diagnoses were confirmed by histopathologic assessment by at least two neuropathologists, including a central pathology review that utilized the 2007 WHO classification for Central Nervous System tumours.
WES and WGS DNA library preparation and Illumina sequencing
Tumour and control samples were individually processed, in every case thorough histological examination proved that each tumour consisted of >80% tumour cells, in most cases it was >95%. DNA from tumour and control samples (blood) were prepared and sequenced individually. The Agilent SureSelect Human All Exon 50 Mb target enrichment kit (v3 initially switched to v4 subsequently) was used to capture all human exons for deep sequencing, using the vendor’s protocol v2.0.1. The SureSelect Human All Exon Kit targets regions of 50 Mb in total size, which is approximately 1.7% of the human genome. Briefly, 3μg of genomic DNA were sheared with a Covaris S2 to a mean size of 150bp. 500ng of library were hybridized for 24h at 65°C with the SureSelect baits. The captured fragments of the tumour samples and controls were sequenced in 105bp single end mode on an Illumina HiSeq2000 deep sequencing instrument (based on Illumina, Inc., v3 sequencing chemistry). Median coverage of whole-exome sequenced tumour samples was 157-fold (range 43-469×) and for control samples (blood DNA) 146-fold (range 80-222×). In addition, whole genome libraries (before the exome hybridization step) were sequenced three lanes each in paired end 105bp mode on the HiSeq2000, as described earlier by Jones et al15.
To increase the coverage of the samples for whole exome-sequencing we used the following strategy: Exome capture was initially carried out with Agilent SureSelect (Human All Exon 50 Mb) in-solution reagents using the default Illumina adapters (without barcode). To introduce Illumina Multiplex barcodes into the existing libraries at a later stage, 15ng final exome-enriched library (without barcode) were used as a template in a 50ul PCR reaction. The Herculase II Fusion enzyme (Agilent) was used together with the NEBNext Universal PCR primer for Illumina and NEBNext Index primer (NEB #E7335S) with the following conditions: The initial denaturation step for 2min at 98°C was followed by 4 cycles of 30sec 98°C, 30sec 57°C, 1min 72°C, and a final 10min at 72°C step. 6-7 barcoded samples were then sequenced on the Hiseq2000 in 2×100bp paired end mode.
WGS and WES data processing
Fastq files were processed by the standardized alignment and variant calling pipeline developed and applied in the context of the Pan-cancer Analysis of Whole Genomes (PCAWG) project (https://github.com/ICGC-TCGA-PanCancer)18. Here, we used the human genome assembly hs37d5 (ncbi.nlm.nih.gov/assembly/2758) as a reference genome and GENCODE19 (gencodegenes.org/releases/19.html) as gene annotations. Germline or somatic origin of the variants and indels were determined based on their presence or absence in the matched control tissue.
RNA-sequencing data processing
Sequencing reads were aligned to GRCh37 1000G reference using STAR 2.3.019 by reporting only reads with one best alignment (–outFilterMultimapNmax 1). Uniquely aligned reads were counted at gene regions using the package Subread v1.4.6 based on Gencode v19 annotations. Differential gene expression analysis between subgroups was performed using the R/Bioconductor package DESeq2 with contrast adjustment for multiple groups comparison. Fusion gene discovery was performed by the InFusion toolkit v.0.6.320
Chromatin immunoprecipitation
Chromatin immunoprecipitation (ChIP) of 5-10 mg of flash frozen primary ependymoma tumours was performed using 5 mg of H3K27ac antibody per ChIP experiment (Abcam-AB4729 (Toronto) or Active Motif-39133 (Heidelberg)). Enriched DNA was quantified using Picogreen (Invitrogen) and ChIP libraries were amplified and barcoded using the Thruplex DNA-seq library preparation kit (Rubicon Genomics) according to manufacturer recommendations. Following library amplification, DNA fragments were Agarose gel (1.0%) size selected (< 1 kb), assessed using Bioanalyzer (Agilent Technologies) and sequenced at The Centre for Applied Genomics (The Hospital for Sick Children) using Illumina Hi-Seq 2000 100bp (Toronto cohort) and 50bp (Heidelberg) single-end sequencing.
ChIP-seq data pre-processing, enhancer, and SE analysis
Mapping of ChIP-seq data was performed as described in Hovestadt et al. (2014)21. Analogous to Lin et al8., H3K27ac peak finding was performed using MACS1.4 with default parameter settings except setting a P-value threshold of 1 × 10⁻⁹. Peak finding for each ependymoma was performed separately and as a control background for each H3K27ac ChIP-seq sample, its matched genomic DNA was used where available. Peaks which cannot be identified in at least two primary ependymomas and peaks contained completely within the region surrounding ±2.5 kb of TSSs were excluded from any further analysis. Afterwards, H3K27ac peaks of the individual samples were merged into a single set of (non-overlapping) peaks. When comparing against the Roadmap Epigenomics Dataset, reads from ependymoma samples were trimmed to 36 bp to be consistent with processed Roadmap Epigenomics Data, and then pre-processed as described above. To reduce potential batch effects enhancer H3K27 acetylation profiles were quantile normalized using the preprocessCore package in R. SEs were identified using the Rank Ordering of Super Enhancers (ROSE) algorithm and classified any SE as a set of 2 or more H3K27ac peaks (detected by MACS1.4, p < 1e-9) within a 12.5 kb distance, and greater than 2.5 kb distance from a transcriptional start site. SEs were further defined by those demonstrating the greatest levels of H3K27 acetylation as detected by graphing an inflection plot and selecting values for which the slope of a fitted curve exceeded a value of 1. In the case of tumour-specific SEs, all regions were removed which contained any overlap with a SE detected in at least one normal brain region consisting of: anterior caudate, cingulate gyrus, hippocampus middle, inferior temporal lobe, mid frontal lobe, and substantia nigra.
t-SNE analysis of Illumina DNA methylation and enhancer data
All DNA methylation analyses were performed in R version 3.3.0 (R Development Core Team, 2015). Raw signal intensities were obtained from IDAT-files using the minfi Bioconductor package version 1.18.2. Each sample was individually normalized by performing a background correction (shifting of the 5 % percentile of negative control probe intensities to 0) and a dye-bias correction (scaling of the mean of normalization control probe intensities to 10,000) for both color channels. No further normalization or transformation steps were performed, and standard beta-values were used for downstream methylation analyses. The following criteria were applied to filter out probes prone to yield inaccurate methylation levels: Removal of probes targeting the X and Y chromosomes (n = 11,551), removal of probes that overlap common SNPs (dbSNP132 Common) within the CpG or the following base (n = 7,998), and removal of probes not mapping uniquely to the human reference genome (hg19) (n = 3,965). To enable comparability with the Illumina Infinium HumanMethylationEPIC array, we also removed probes not represented on this array (n= 32,260). In total, 428,799 probes were kept for analysis. For unsupervised hierarchical clustering, we selected the 10,000 most variably methylated probes across the dataset (s.d. > 0.264). Distance between samples was calculated by using 1-Pearson correlation coefficient as the distance measure. The resulting distance matrix was used to perform the t-SNE analysis (t-Distributed Stochastic Neighbor Embedding, Rtsne package version 0.11. The following non-default parameters were used: theta=0, is_distance=T, pca=F, max_iter=10000.
For clustering of H3K27ac ChIP-seq data from the Heidelberg and Toronto cohorts together, we have processed both cohorts in single-end mode without background using the R/Bioconductor package QSEA v.0.0.11, For each sample, we have quantified sequencing reads as reads per kilobase per million (rpkm) at previously derived enhancers (see Methods) neglecting enhancers at mitochondrial and sex chromosomes. Distance between samples was calculated by using 1-Spearman correlation coefficient as the distance measure. The resulting distance matrix was used to perform the t-SNE analysis (t-Distributed Stochastic Neighbor Embedding, Rtsne package version 0.11. The following non-default parameters were used: theta=0, is_distance=T, pca=F, max_iter=5000.
Unsupervised hierarchical clustering analysis of variant enhancer loci
A matrix of the normalized H3K27ac density was generated in HOMER (v3.12) based upon the consensus typical enhancers (TEs) identified. Variant enhancer loci (VELs) were defined as enhancers, which exhibited the greatest median absolute deviation (MAD) across all samples used for clustering. In the case of unsupervised hierarchical clustering between ependymoma, Roadmap Epigenomics, and ENCODE samples, the top 10,000 VELs were retained. These enhancers were used for unsupervised hierarchical clustering using a Pearson correlation as a distance metric. In the case of SEs, a matrix was generated in HOMER using the consensus SE .BED files of normalized H3K27ac densities across all samples. Non-Negative Matrix factorization was performed using all SE regions, using the methodology described previously, with 20 iterations, across 10 rank classifications2.
Identification of super enhancer associated pathways and drug gene interactions
Differential SEs associated genes in ependymoma or ependymoma subgroups were imported into G-Profiler22 for pathway analysis, restricted to GO, KEGG and REACTOME gene sets. Cytoscape (v3.2.1) and the EnrichmentMap plug-in was used to generate networks for genesets enriched with an FDR cut-off of < 0.05. SE associated genes were also used to query the Washington University Drug Gene Interaction database restricted to expert curated drug-target interactions to identify novel and Druggable gene targets17.
Analysis of SEs with subgroup specific enhancer activity (SSEA)
To identify subgroup specific enhancer activity, we employed the R/Bioconductor package QSEA v.0.0.1123. Here, previously calculated enhancer regions (see above) were provided as regions of interest and tiled into 500bp windows. For each sample, H3K27ac ChIP-seq enrichments are calculated at these tiled enhancers and were library size normalized by TMM. In addition, matched blood and tumour whole genome sequencing data was imported and copy number variations were calculated for all ependymoma samples using the findCNV() function of the QSEA package. CNV aware subgroup specific enhancer activity was then calculated by comparing H3K27ac ChIP-seq enrichments in one subgroup against the other subgroups by fitting general linear models with respect to the presence of CNVs (non-default parameters are norm_method="nrpkm", minRowSum=10, fdr_th=10−5, direction="gain"). 500bp windows significant in more than one subgroup were excluded. For each subgroup, we stitched all significant 500bp windows within a distance of 12.5kb together, sum up their normalized H3K27ac ChIP-seq enrichment values (nrpkm), and rank them accordingly. Analogous to the definition of super enhancers, we define the first occurrence of a slope>1 (from high to low enrichment) as a threshold for distinguishing between extended stretches of significant SEs with subgroup specific enhancer activity (SE-SSEA) and TEs with subgroup specific enhancer activity (TE-SSEA).
Calculating core regulatory networks for SE associated transcription factors
To quantify the interaction network of transcription factor (TF) regulation, we calculated the inward and outward binding degree of all super enhancer (SE) associated TFs14. For all promoters within 100 kb, the most acetylated promoter was assigned as the target of the SE (excluding promoters that overlap SEs). If there were no active promoters within 100kb, the SE is assigned to the nearest active promoter. All SE-associated promoters annotated to regulate a TF were considered as the node-list for network construction. For any given TF (TFi) The IN degree was defined as the number of TFs with an enriched binding motif at the proximal SE or promoter of TFi. The OUT degree was defined as the number of TF associated SEs containing an enriched binding site for TFi. Within any given SE, enriched TF binding sites were determined at putative nucleosome free regions (valleys) flanked by high levels of H3K27ac. Valleys were calculated using an algorithm adapted from Ramsey et al., 201013. In these regions, we searched for enriched TF binding sites using the FIMO59 algorithm with TF position weight matrices defined in the TRANSFAC database24. An FDR cut-off of 0.01 was used to identify enriched TF binding sites.
Identification of regulatory networks at enhancers with subgroup specific enhancer activity
Subgroup specific transcription factor regulatory networks were constructed as previously described with only few amendments8,25. H3K27ac data of the samples within the same subgroup were combined. For each subgroup, nucleosome free regions (NFRs) were identified using the “findPeaks” function of HOMER26 (http://homer.salk.edu/homer/ngs/index.html) with option “-nfr”. ENCODE transcription factor motifs and their mapped positions in the genome were downloaded from http://compbio.mit.edu/encode-motifs/. For each TF, contingency tables containing the number of NFRs overlapping and non-overlapping with the respective TF were constructed. Significance of enrichment of TFs in NFRs of enhancers with subgroup specific activity was determined using the Chi-squared test. The resulting p-values were corrected for multiple testing (FDR<0.01). TF enrichments were calculated as the ratio between observed counts over expected counts. To identify enhancer target genes, we have accessed publicly available topology-associated domains (TAD) previously obtained in IMR90 cells. Each SSEA was assigned to its enclosing TAD and protein-coding genes within the same TAD were determined. Correlation tests (Spearman’s rank correlation coefficient) for SSEA H3K27ac enrichment and gene expression level within the same TAD were performed. After repeating this procedure for each enhancer, all p-values obtained were combined and corrected for multiple testing using the Bioconductor package “qvalue”. Correlations with a FDR less than 1% were preserved. To derive subgroup specific TF regulatory networks, we have selected the top 50% enriched TFs in each subgroup, which also have the highest expression in the respective subgroup compared to the other subgroups. The resulting networks highlight transcription factors (red/orange nodes), whose binding sites are significantly enriched at enhancers with subgroup specific enhancer activity (SSEA). By gene-enhancer correlation analysis restricted by TAD domains (see above), these transcription factors have been assigned to their likely target genes (blue nodes). Networks have been visualized by Gephi (http://gephi.github.io/).
ATAC-seq chromatin preparation and sequencing
Freshly cultured ependymoma cells were prepared for ATAC-seq according to previously published methods27. Briefly, nuclei were prepared from ~50,000 cells by spinning at 600g for 10 minutes 4°C, followed by a PBS wash and centrifugation at 600g for 5 minutes. Cells were lysed using ice-cold lysis buffer (10mM Tris -HCl, pH 7.4, 10mM NaCl, 3mM MgCl2, 0.1%), and centrifuged for 10 minutes at 600g at 4°C. The supernatant was removed and pellet re-suspended in 50ul of transposase mix (25ul of 2×TD Buffer, 2.5ul of transposase, 22.5ul of water) (FC-121-1030 Illumina; CA, USA) for 30 minutes at 37°C. Library amplification was performed using the NEBnext High Fidelity 2×PCR Master Mix (#M0541S New England Biolabs; ON, Canada) according to previously published PCR conditions27. PCR reactions were purified using QIAGEN miniElute kit, and a following size selection step using standard gel extraction protocol to isolate ~240-360bp. ATAC-seq library preparations were sequenced using single-end 50bp reads on the Illumina HiSeq 2000 platform. Raw reads were adapter-trimmed using Trim Galore (v0.2.5) and aligned to the genome with Bowtie (v1.0.1) with the m1 option enabled to allow for only uniquely aligned high-quality reads. Peaks were called using the MACS2 software (v2.1.0.20140616) with the options –q 0.05 to retain significant peaks, –shiftsize 50 to account for the transposase fingerprint, and otherwise default parameters were used. Tag count libraries and bedgraph files were constructed using HOMER software (v4.7).
Ependymoma culture experiments
Ependymoma cell cultures were isolated from patients and cultured on Laminin (Sigma) and in Neurobasal media (Invitrogen) consisting of: sodium pyruvate (Invitrogen), B27 (Invitrogen), Glutamine (Cleveland Clinic Media Core), human EGF (Invitrogen), human basic FGF (Invitrogen), and penicillin/streptomycin (Cleveland Clinic Media Core). Media was replenished every other day while leaving ~50% conditioned media to encourage continued cell proliferation. Cell viability assays were performed in 96 wells using an Alamar Blue stain (Invitrogen) according to manufacturer’s instructions. Drug response assays were performed by seeding cells overnight, treating the following day with increasing drug concentrations, and reading by Alamar Blue Absorption following 72 hours of treatment. AZD4547 and MK1775 were obtained from Selleck Chemicals. JQ1 was provided by the laboratory of James E. Bradner (Harvard). All cell lines were confirmed to be mycoplasma free using a PCR-based detection strategy with positive and negative controls.
RNA interference of enhancer-associated genes
Lentiviral shRNA clones (Sigma Mission RNAi) targeting SE associated genes, and two non-targeting controls (SHC002, SHC007) were purchased from Sigma. (Supplementary Table 23) These vectors were co-transfected into 293FT cells with the packaging vectors psPAX2 (Addgene) and pCI-VSVG (Addgene) using a calcium phosphate method to produce viable lentivirus. Knockdown efficiency of different lentiviral shRNA clones in cells was determined by real-time quantitative PCR. Cells infected with lentivirus expressing the indicated shRNAs were plated in 96-well plates at 1,000 cells per well. Cell viability was determined after the indicated number of days after plating using Alamar Blue Assay (Life Technologies) or CellTitreGlo (Promega).
CRISPR/cas9 mediated repression of enhancer regions
CRISPR/Cas9 sgRNAs were identified and designed using the MIT CRISPR Design tool, and control (pLenti-Guide-Puro D103), non-targeting sgRNAs were selected from the GeCKOv2 library. All sgRNA sequences may be found in (Supplementary Table 23). sgRNAs were cloned into plenti-Guide-Puro (Addgene, 52963). Lentivirus expressing dCAS9-KRAB (Gift from Matthew Meyerson Lab)28 were used to infect EP1-NS, following which cells were selected 48h with 10 μg/ml blasticidin. These cells were then infected with selected lentiGuide-Puro sgRNA constructs and selected 48h with 1 μg/ml puromycin. These cells were plated 48h following selection in 96 - well plates and cell viability was assessed using an Alamar Blue Stain (Life Technologies).
In vivo animal experiments
We have utilized Guidelines for the Care and Use of Mammals in Neuroscience and Behavioral Research from the National Research Council to estimate the minimal number of animals necessary to assess statistical significance. The number of animals per arm is based upon the following calculation: c N=1+2C(s/d)2 where n=number of animals per arm, C=7.85 when alpha=0.05 and 1-beta=0.8 (significance level of 5% with a power of 80%), s= standard deviation, an d=difference to be detected. All animal experiments were performed in accordance with local IACUC regulations and protocols. Animal experiments were conducted in a single-blinded fashion, and endpoints assessed by an independent animal technician in the lab. 250,000 H612 cells were xenografted intracranially into NOD-scid gamma female mice. Tumours were allowed to develop for 14 days then independently randomized into a treatment or vehicle group. AZD4547 (25mg/kg/d) or vehicle (Sigma: 1% Tween-80) were administered daily by oral gavage. Survival of mice was plotted using a Kaplan-Meier curve and quantified using a log rank test. Our study did not measure tumour size/volumes directly. We monitored neurological signs/behaviours associated with brain tumour development, which were performed in accordance with our IACUC protocols and regulations.
Data availability
All raw data files were deposited to the European Genome Phenome archive under the accession number: EGAS00001002696.
Extended Data
Extended Data Figure 1. DNA fingerprint analysis of ependymoma sequence data.

(a-b) Unsupervised clustering of ChIP-seq, RNA-seq, WES, WGS, RNA-seq, and Illumina DNA methylation profiles with genotypes that have an average heterozygosity score greater than 0.25 in the Heidelberg (n = 25 independent samples) (a) and Toronto Cohort (n = 18 independent samples) (b).
Extended Data Figure 2. Summary of genome sequencing and copy number data.

(a) Number of somatic single nucleotide variants (SNVs) detected per ependymoma sample. (b) Frequency of somatic mutations detected across the Heidelberg ependymoma cohort (n = 24 independent samples). (c) Unsupervised hierarchical clustering of copy number alterations detected by WGS in primary ependymoma samples (n = 24 independent samples).
Extended Data Figure 3. Preprocessing and clustering of ependymoma H3K27ac profiles.
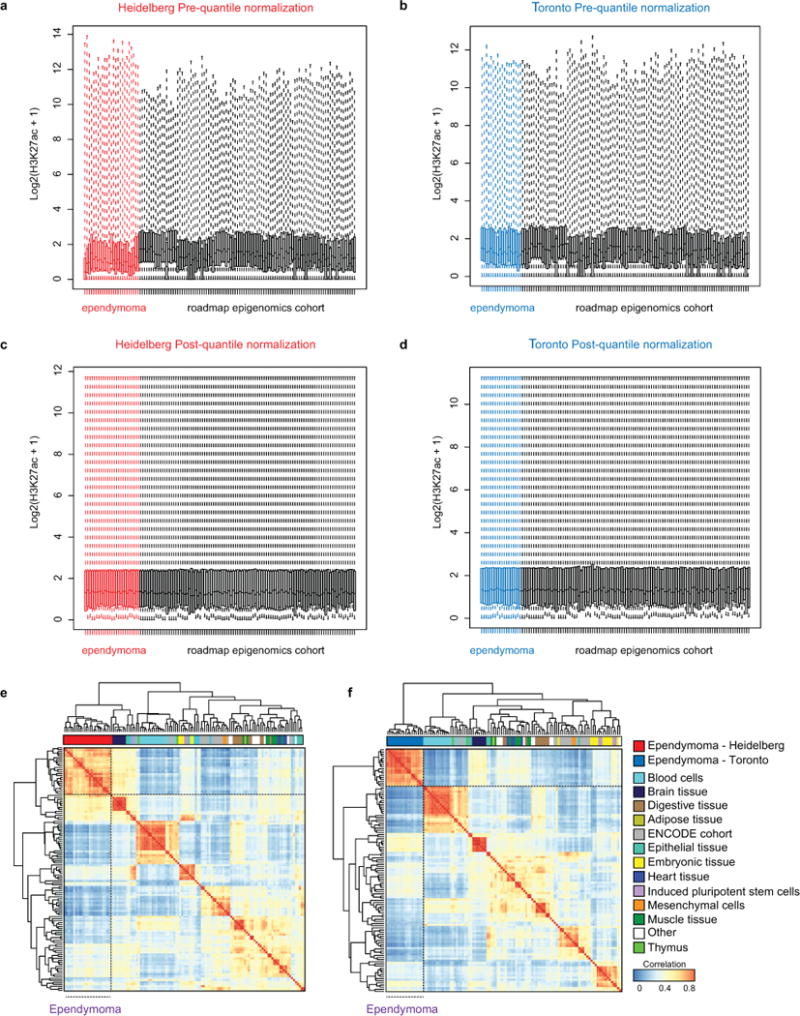
(a-b) Box plots of H3K27ac enhancer profiles (n = 556,676 enhancer loci evaluated per sample) pre-quantile normalization for both Heidelberg (n = 24 independent samples) (a) and Toronto (n = 18 independent samples) (b) cohorts as compared to Roadmap Epigenomics and ENCODE cohort (n = 98 independent samples). Box plots are shown with the center (median), upper and lower quartile range, and dotted line indicating minima and maxima per sample. (c-d) Box plots of H3K27ac enhancers post-quantile normalization for both Heidelberg (n = 24 independent samples) (c) and Toronto (n = 18 independent samples) (d) cohorts as compared to Roadmap Epigenomics cohort (n = 98 independent samples). (e-f) Unsupervised hierarchical clustering of enhancer profiles as measured using the Top 10,000 variant enhancer loci identified in the Roadmap Epigenomics cohort with the Heidelberg (n = 122 independent samples) (e) and Toronto cohort (n =116 samples) (f) and compared in a pair-wise fashion using a Spearman Correlation.
Extended Data Figure 4. Ependymoma enhancer supporting data.
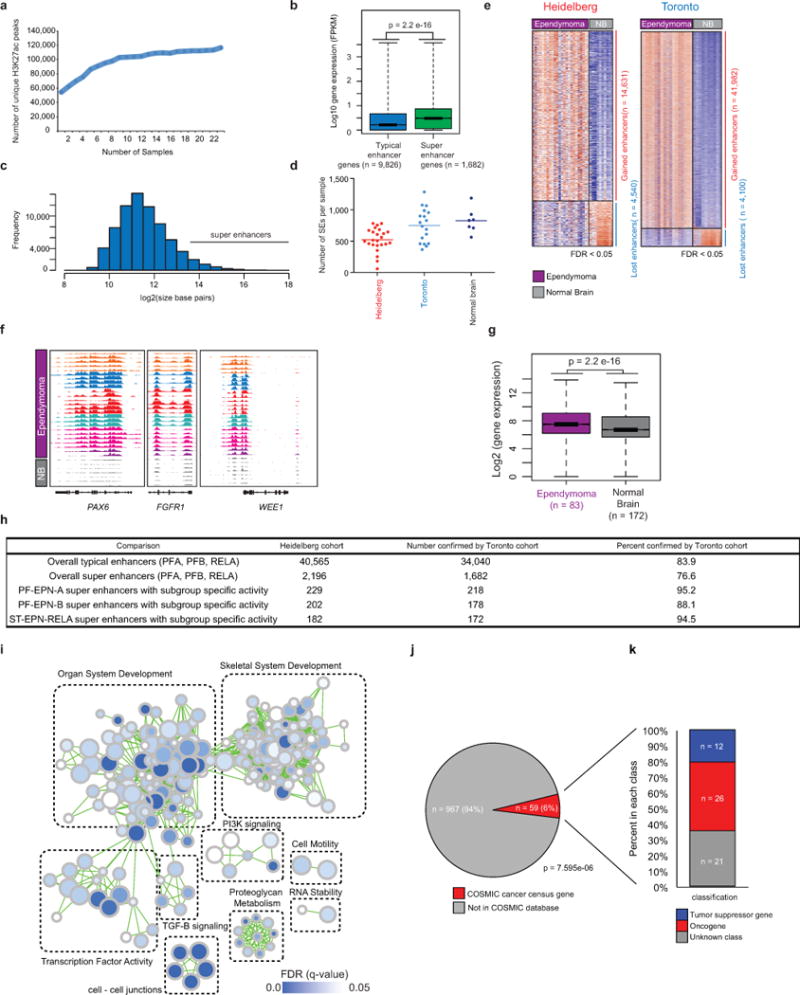
(a) Number of unique H3K27ac peaks detected by MACS1.4 (p < 1e-9 cutoff) with increasing sample number in the Heidelberg cohort (n = 24 independent samples) (b) Boxplot of gene expression values comparing typical enhancer (n = 9826 genes) versus super enhancer (SE) (n = 1682 genes) associated genes. Statistical analysis was assessed using a two-sided Wilcoxon-Rank Sum Test. Box plots of gene expression values are shown with the center (median), upper and lower quartile range, and dotted line indicating minima and maxima (c) Frequency of enhancer and SE regions as a function of size in basepairs (d) Dot plots illustrating the numbers of SE detected in the Heidelberg (n = 24 independent samples), Toronto (n = 18 independent samples), and Normal brain (n = 7 independent samples) cohort. The center bar in the dot plot indicates the mean. (e) Heatmap illustrating significant gained and lost enhancer loci in both ependymoma cohorts as compared to normal brain samples. Comparisons were evaluated using a two-sided Wilcoxon-rank sum test with false discovery rate (FDR) correction and a cut-off of less than FDR < 0.05 (f) Example plots of normalized and scaled H3K27ac RPKM profiles at example ependymoma candidate genes in Heidelberg-ependymomas and normal brain (n = 32 independent samples). (g) Gene expression comparing ependymoma SE associated genes derived from Johnson et al., (2010) (n = 83 independent samples) with normal brain (n = 172 independent samples). Statistical analysis was assessed using a two-sided Wilcoxon-Rank Sum Test. (h) Table comparing the number and percent confirmation between the Heidelberg (n = 24 independent samples) and Toronto ependymoma cohorts (n = 18 independent samples) (i) G-profiler pathway enrichment analysis of ependymoma specific SE associated genes in the Toronto cohort (n = 18 independent samples), with statistical significance determined using a hypergeometric test (j) Overlap analysis as measured by a two-sided binomial test between tumour specific ependymoma SEs and cancer census genes from the Catalogue of Somatic Mutations in Cancer database (k) Classification of tumour specific ependymoma SE genes also found in the COSMIC database29 as tumour suppressor genes (n = 12), oncogenes (n = 26), or unknown (n = 21).
Extended Data Figure 5. Subgroup specific enhancers of ependymoma.

(a-b) Heatmap of all subgroup-specific active enhancers detected in ependymoma in independent samples in the Heidelberg (n = 24 independent samples) and Toronto (n = 18 independent samples) cohort (c) Box plot of gene expression for ependymoma SE-SSEA associated genes in the Heidelberg cohort (n = 24 independent samples). Comparisons were made using a two-sided Wilcoxon-Rank Sum test. Box plots of gene expression values are shown with the center (median), upper and lower quartile range, and dotted line indicating minima and maxima. (d-f) Venn diagrams of the number and percent of subgroup-specific SE loci validated between the Heidelberg and Toronto cohort (g-h) Non-negative factorization of ependymoma SE profiles in the Heidelberg (n = 24 independent samples) and Toronto (n = 18 independent samples) cohort (i) Normalized H3K27ac profiles for subgroup specific genomic example loci in the Heidelberg cohort with at minimum 3 biological replicates per subgroup with the exception of ST-EPN-SE shown as a biological duplicate. (j) This has been corrected to read: G-profiler pathway enrichment analysis of ependymoma subgroup-specific SE associated genes in the Heidelberg cohort (n = 24 independent samples) with statistical significance determined using a hypergeometric test. (k-n) H3K27ac profiles surrounding the EPHB2 (k) and CCND1 (m) locus in the Heidelberg cohort with at minimum 3 biological replicates per subgroup with the exception of ST-EPN-SE shown as a biological duplicate. EPHB2 (l) and CCND1 (n) expression by RNA-seq across ependymoma subgroups in the Heidelberg cohort with horizontal bar indicating the median value and each dot representing an independent ependymoma sample (n = 24 independent samples).
Extended Data Figure 6. Workflow describing the functional validation of ependymoma SE genes.
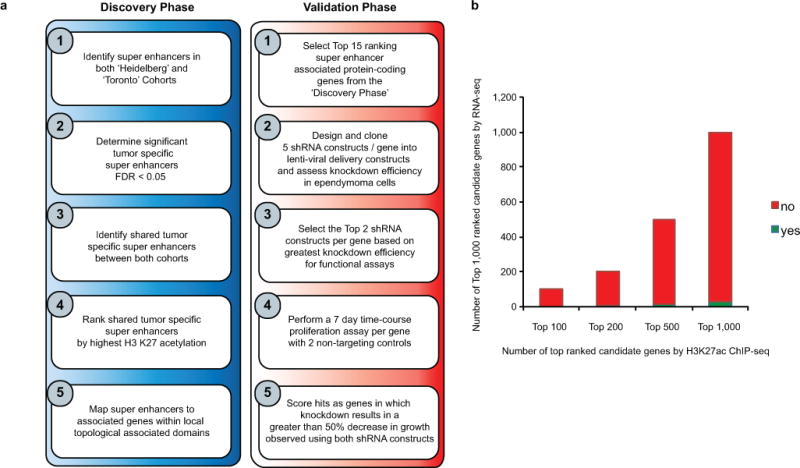
(a) Workflow of super enhancer target gene prioritization for functional evaluation. (b) Bar chart comparing the top ranked SE associated genes against top ranked genes detect by RNA-seq defined as significantly gained or over-expressed compared to normal brain controls across all ependymoma samples (n = 42 independent samples). Significant genes were identified by a two-sided Wilcoxon rank sum test with FDR correction and ranked by FDR corrected p-value cut-off of less than a minimum of 0.05.
Extended Data Figure 7. RNA interference of ependymoma SE genes.

(a) Individual shRNA time-course knockdown experiments in EP1-NS (ST-EPN-RELA) cells, using two shRNA constructs (shRNA.1 and shRNA.2) as compared to two controls (shCONTROL.1 and shCONTROL.2). Shown are time-course experiments for 19 genes performed in 6 technical replicates. (b) Ependymoma cell viability (EP1-NS) following treatment with shRNAs targeting super enhancer associated genes over a 7-day time course (alphabetically ordered). Cell viability data for treatment with non-targeting controls: shCONTROL.1 (black), shCONTROL.2 (grey), and for two gene-specific shRNA constructs: shRNA.1 (red) and shRNA.2 (pink).
Extended Data Figure 8. Validation of ependymoma subgroup specific SE genes.

(a) H3K27ac profiles at the ependymoma specific SE locus IGF2BP1 in the Heidelberg cohort (n = 24 independent samples) with at minimum 3 biological replicates per subgroup with the exception of ST-EPN-SE shown as a biological duplicate. (b) IGF2BP1 gene expression derived from RNA-seq data of the Heidelberg cohort (n = 24 independent samples) and horizontal bar for each subgroup that indicates the mean. (c-d) Normalized survival of PF-EPN-A (S15) primary cultures (c) and EP1-NS (d) cell cultures following shRNA knockdown of IGF2BP1 with 2 independent non-overlapping shRNA constructs as compared to shCONTROL.1. Experiments performed as 6 technical replicates and independently validated in 3 biological replicates. Horizontal black bar indicates mean value for each treatment. (e) H3K27ac profiles at the ependymoma specific SE locus CACNA1H in the Heidelberg cohort with at minimum 3 biological replicates per subgroup with the exception of ST-EPN-SE shown as a biological duplicate. (f) H3K27ac profiles of a ST-EPN-RELA model (EP1-NS), a PF-EPN-A model (S15), and a normal neural stem cell control surrounding the CACNA1H locus performed in biological duplicates. (g) CACNA1H gene expression derived from RNA-seq data of the Heidelberg cohort (n = 24 independent samples) and horizontal bar for each subgroup that indicates the mean. (h-i) Normalized survival of PF-EPN-A (S15) primary cultures (k) and EP1-NS (l) cell cultures following shRNA knockdown of CACNA1H with 2 shRNA constructs as compared to shCONTROL.1. Experiments performed as 4 technical replicates and independently validated in 3 biological replicates. Horizontal black bar indicates mean value for each treatment. (j) Normalized cell survival of EP1-NS, S15, and NSC194 cells treated with increasing concentrations of Mibefradil. Shown are technical triplicates and replicated in biological triplicates (k) Overlay of ATAC-seq and H3K27ac seq data centered upon ATAC-seq peak regions identified in the ST-EPN-RELA cell culture EP1-NS. (l) CRISPR dCAS9 targeting of CACNA1H active enhancers impairs CACNA1H expression. H3K27ac-seq (top panel) and ATAC-seq (bottom panel) surrounding the CACNA1H locus, indicating regions targeted by CRISPR-dCAS9 sgRNA complexes. Region 1 (R1) indicates a negative control region devoid of H3K27ac (green), while Region 2-4 (R2-4) indicate experimental regions under evaluation. Experiments replicated in biological duplicates. (m) Gene expression for various sgRNA constructs relative to a 'dummy' targeting control (D103), negative control (green), and uninfected control. All group comparisons were made using a two-sided Wilcoxon-Rank sum test, error bars indicated as standard deviation in all dot plots of this figure, and horizontal bar indicating the mean value. Experiments were replicated in biological triplicates.
Extended Data Figure 9. Validation of ependymoma transcription factors.

(a-b) Gene expression of 'high activity' transcription factors (ranked < 50) (a) and 'low activity' transcription factors (ranked > 50) (b) in ependymoma (n = 83 independent samples) versus normal brain tissue (n = 172 independent samples). Box plot is described by the median value (horizontal bar), interquartile range, and dotted line representing the data range. Comparison between groups was assessed using a two-sided Wilcoxon rank sum test. Boxplots indicate the range of data points. (c) Constituent enhancer activity in the central nervous system of developing zebrafish embryos derived from subgroup specific SEs identified in ependymoma
Extended Data Figure 10. Putative cell lineage programs of origin uncovered by TF mapping.

(a-c) Immunohistochemical staining of foxj1 at day 13.5 of mouse embryonic development (E13.5). Staining in discrete regions encompassing the choroid plexus and ependymal layer are shown in the forebrain (b) and hindbrain (c). (d) Log2 normalized gene expression of FOXJ1 in ependymoma (n = 83 independent samples) as compared to independent sample cohorts of the following tissue types: Normal Brain (n = 172), Pediatric Glioma (n = 53), Glioblastoma (n = 84), Atypical Rhabdoid Teratoid Tumours (n = 18), Medulloblastoma (n = 62), and Pilocytic Astrocytoma (n = 41). Horizontal bar indicates the mean value. (e) Subgroup specific gene expression of FOXJ1 derived from Pajtler et al., Cancer Cell 2015 (n = 209 independent samples) Error bars indicate standard deviation, interquartile range, and horizontal bar indicating the median. (f) Gene set enrichment analysis30 demonstrating significant enrichment of the FOXJ1 transcriptional program derived from E14.5 mouse embryos specifically in PF-EPN-B tumours (n = 209 independent samples). FDR corrected significance evaluated by gene set enrichment analysis. (g) Significant FOXJ1 gene expression correlations with proteins known to regulate cilia assembly and function. P-values for significant positive/negative correlations have been corrected for multiple testing using the Bonferroni method. (h-m) FOXJ1 gene set enrichment plots of PF-EPN-A (h), PF-EPN-B (i), PF-EPN-SE (j), ST-EPN-RELA (k), ST-EPN-YAP1 (l), and ST-EPN-SE (m) ependymomas. FDR corrected significance evaluated by gene set enrichment analysis, n = 209 independent samples.
Supplementary Material
Supplementary Table 1 Heidelberg Sample Information
Sample identifiers for each genomic platform in the Heidelberg cohort
Supplementary Table 2 Toronto Sample Information
Sample identifiers for each genomic platform in the Toronto cohort
Supplementary Table 3 Heidelberg ChIP-seq statistics
ChIP sequencing summary statistics from the Heidelberg cohort
Supplementary Table 4 Toronto ChIP-seq statistics
ChIP sequencing summary statistics from the Toronto cohort
Supplementary Table 5 WGS statistics
Whole genome sequencing summary statistics from the Heidelberg cohort
Supplementary Table 6 WES statistics
Whole exome sequencing summary statistics from the Heidelberg cohort
Supplementary Table 7 SNVs INDELS
Summary of somatic nucleotide variants and insertion-deletions identified in the Heidelberg cohort
Supplementary Table 8 Heidelberg SEs
Summarized super enhancers detected in the Heidelberg cohort
Supplementary Table 9 Toronto SEs
Summarized super enhancers detected in the Toronto cohort
Supplementary Table 10 Confirmed SEs both cohorts
Super enhancers detected in both the Heidelberg and Toronto cohorts
Supplementary Table 11 PFA-EnhancerAssociatedGene
Subgroup specific enhancers and super enhancers detected in PF-EPN-A ependymoma
Supplementary Table 12 PFB-EnhancerAssociatedGene
Subgroup specific enhancers and super enhancers detected in PF-EPN-B ependymoma
Supplementary Table 13 PFSE-EnhancerAssociatedGene
Subgroup specific enhancers and super enhancers detected in PF-EPN-SE ependymoma
Supplementary Table 14 RELA-EnhancerAssociatedGene
Subgroup specific enhancers and super enhancers detected in ST-EPN-RELA ependymoma
Supplementary Table 15 YAP1-EnhancerAssociatedGene
Subgroup specific enhancers and super enhancers detected in ST-EPN-YAP1 ependymoma
Supplementary Table 16 STSE-EnhancerAssociatedGene
Subgroup specific enhancers and super enhancers detected in ST-EPN-SE ependymoma
Supplementary Table 17 SE-pathway-analysis
Significant SE driven pathways enrichment in each molecular subgroup of ependymoma
Supplementary Table 18 Motif Analysis
Significant known DNA motifs identified in regions of open chromatin within shared ependymoma typical enhancers
Supplementary Table 19 Core TF network
List of ependymoma transcription factors (TF) and overall TF connectivity
Supplementary Table 20 Subgroup Specific TF network
List of ependymoma transcription factors (TF) with subgroup specific activity
Supplementary Table 21 SE Drug Gene Integration
Drugs predicted by integration of ependymoma tumor specific genes with the WashU drug gene interaction database
Supplementary Table 22 Subtype SE drug-gene
Drugs predicted by integration of ependymoma subgroup-specific genes with the WashU drug gene interaction database
Supplementary Table 23 shRNA sgRNA construct details
List of shRNA and sgRNA sequences used and their targets in the manuscript
Acknowledgments
This work was supported by an Alex’s Lemonade Stand Young Investigator Award (SCM), The CIHR Banting Fellowship (SCM), The Cancer Prevention Research Institute of Texas (SCM-RR170023), Sibylle Assmus Award for Neurooncology (KWP), the DKFZ-MOST (Ministry of Science, Technology & Space, Israel) program in cancer research (HW), James S. McDonnell Foundation (JNR) and NIH grants: CA154130 (JNR), R01 CA169117 (JNR), R01 CA171652 (JNR), R01 NS087913 (JNR), R01 NS089272 (JNR). RCG is supported by NIH grants: T32GM00725, and F30CA217065. MDT is supported by The Garron Family Chair in Childhood Cancer Research, and grants from the Pediatric Brain Tumour Foundation, Grand Challenge Award from CureSearch for Children’s Cancer, the National Institutes of Health (R01CA148699 R01CA159859), The Terry Fox Research Institute, and Brainchild. MDT is also supported by a Stand Up To Cancer St. Baldrick’s Pediatric Dream Team Translational Research Grant (SU2C-AACR-DT1113). Stand Up To Cancer is a program of the Entertainment Industry Foundation administered by the American Association for Cancer Research. We thank Susan Archer and Natalie DeWitt for technical writing and editing expertise. In addition, we thank the High-Throughput Sequencing Unit of the DKFZ Genomics and Proteomics Core Facility for excellent technical support and gratefully acknowledge technical assistance by Monika Mauermann, Tatjana Wedig, Andrea Wittmann and Laura Siebert. Additional support came from the ICGC DE-Mining grant (#01KU1505). We thank The Children’s Hospital at Westmead (CHW) Tumour Bank for support of tumour samples. We thank Dave Schumick (Cleveland Clinic Art Department) and Grace Hsu (www.hsubiomedicalvisual.com) for their assistance with creative artwork.
Footnotes
AUTHOR CONTRIBUTIONS
S.C.M., K.W.P., and L.C. designed, performed, and analysed the majority of the experiments in this study. Q.W. performed genetic knockdown experiments along with in vivo drug studies. K.C.B. performed all of the ChIP QC including library preparations and pre- and post- QPCR for the entire cohort. A.F., K.O., and S.E. performed the transcription factor network mapping of the SE data. J.M. and T.E.M. assisted with SE analysis and overall interpretation of data and analysis. X.W., L.M., and I.S., led all of the zebrafish experiments in terms of establishment, interpretation, and analysis. L.G., A.M., Y.T., and F.D.B.L.H performed timed mating and tissue isolation in developing mouse embryos. J.R. assisted with pathway analysis of SEs. J.L. assisted with ChIP experiments and library preparations. A.S. guided analysis of SE subgroup stratification. D.F. performed RNA-seq pre-processing and analysis. B.L. helped with tissue isolation, preparation, and submission for ChIP sequencing and DNA methylation analysis. Xiaochong W. directed breeding and establishment of meis1-GFP mice. C.L.V., R.G., A.T., performed data integration and mining of drug databases and identification of lead therapeutic compounds. A.M. performed SE saturation analysis. P.S. assisted with study design, data analysis interpretation, and manuscript review. S.K., J.Z., V.M., and S.L., assisted with qPCR of numerous targets in genetic knockdown and differentiation experiments. P.J.H, T.M., and S.K. provided ependymoma models, controls, and helped design the study. Xiuxing W., L.D., S.D., L.K., and B.C.P., assisted with normal NSC drug treatments with drug inhibitors used in this study. C.G.H., M.R., S.D., S.V., S.N.G., H.W., D.T.W.J., P.A.N., P.L., A.K., N.J., J.T.R., E.B., A.H., K.D.A., P.B.D., Y.L., M.L., Z.H., M.Z., V.R., J.E.B, S.M.P., and P.C.S., assisted with data interpretation, manuscript preparation and review. M.D.T., J.N.R., and M.K. conceived, designed, interpreted, and funded the study.
AUTHOR INFORMATION
All raw data files were deposited to the European Genome Phenome archive under the accession number: EGAS00001002696.
The authors have no financial conflicts of interest regarding this manuscript.
References
- 1.Pajtler KW, et al. Molecular Classification of Ependymal Tumors across All CNS Compartments, Histopathological Grades, and Age Groups. Cancer Cell. 2015;27:728–743. doi: 10.1016/j.ccell.2015.04.002. [DOI] [PMC free article] [PubMed] [Google Scholar]
- 2.Mack SC, et al. Epigenomic alterations define lethal CIMP-positive ependymomas of infancy. Nature. 2014 doi: 10.1038/nature13108. [DOI] [PMC free article] [PubMed] [Google Scholar]
- 3.Witt H, et al. Delineation of two clinically and molecularly distinct subgroups of posterior fossa ependymoma. Cancer Cell. 2011;20:143–157. doi: 10.1016/j.ccr.2011.07.007. [DOI] [PMC free article] [PubMed] [Google Scholar]
- 4.Parker M, et al. C11orf95-RELA fusions drive oncogenic NF-kappaB signalling in ependymoma. Nature. 2014;506:451–455. doi: 10.1038/nature13109. [DOI] [PMC free article] [PubMed] [Google Scholar]
- 5.Kundaje A, et al. Integrative analysis of 111 reference human epigenomes. Nature. 2015;518:317–330. doi: 10.1038/nature14248. [DOI] [PMC free article] [PubMed] [Google Scholar]
- 6.Hnisz D, et al. Super-enhancers in the control of cell identity and disease. Cell. 2013;155:934–947. doi: 10.1016/j.cell.2013.09.053. [DOI] [PMC free article] [PubMed] [Google Scholar]
- 7.Hnisz D, et al. Convergence of developmental and oncogenic signaling pathways at transcriptional super-enhancers. Cancer cell. 2015;58:362–370. doi: 10.1016/j.molcel.2015.02.014. [DOI] [PMC free article] [PubMed] [Google Scholar]
- 8.Lin CY, et al. Active medulloblastoma enhancers reveal subgroup-specific cellular origins. Nature. 2016;530:57–62. doi: 10.1038/nature16546. [DOI] [PMC free article] [PubMed] [Google Scholar]
- 9.Loven J, et al. Selective inhibition of tumor oncogenes by disruption of super-enhancers. Cell. 2013;153:320–334. doi: 10.1016/j.cell.2013.03.036. [DOI] [PMC free article] [PubMed] [Google Scholar]
- 10.Taylor MD, et al. Radial glia cells are candidate stem cells of ependymoma. Cancer cell. 2005;8:323–335. doi: 10.1016/j.ccr.2005.09.001. [DOI] [PubMed] [Google Scholar]
- 11.Johnson RA, et al. Cross-species genomics matches driver mutations and cell compartments to model ependymoma. Nature. 2010;466:632–636. doi: 10.1038/nature09173. [DOI] [PMC free article] [PubMed] [Google Scholar]
- 12.Mohankumar KM, et al. An in vivo screen identifies ependymoma oncogenes and tumor-suppressor genes. 2015;47:878–887. doi: 10.1038/ng.3323. [DOI] [PMC free article] [PubMed] [Google Scholar]
- 13.Ramsey SA, et al. Genome-wide histone acetylation data improve prediction of mammalian transcription factor binding sites. Bioinformatics. 2010;26:2071–2075. doi: 10.1093/bioinformatics/btq405. [DOI] [PMC free article] [PubMed] [Google Scholar]
- 14.Saint-Andre V, et al. Models of human core transcriptional regulatory circuitries. Genome research. 2016;26:385–396. doi: 10.1101/gr.197590.115. [DOI] [PMC free article] [PubMed] [Google Scholar]
- 15.Pope BD, et al. Topologically associating domains are stable units of replication-timing regulation. Nature. 2014;515:402–405. doi: 10.1038/nature13986. [DOI] [PMC free article] [PubMed] [Google Scholar]
- 16.Abedalthagafi MS, et al. Decreased FOXJ1 expression and its ciliogenesis programme in aggressive ependymoma and choroid plexus tumours. The Journal of pathology. 2016;238:584–597. doi: 10.1002/path.4682. [DOI] [PMC free article] [PubMed] [Google Scholar]
- 17.Griffith M, et al. DGIdb: mining the druggable genome. Nature methods. 2013;10:1209–1210. doi: 10.1038/nmeth.2689. [DOI] [PMC free article] [PubMed] [Google Scholar]
- 18.Stein LD, Knoppers BM, Campbell P, Getz G, Korbel JO. Data analysis: Create a cloud commons. Nature. 2015;523:149–151. doi: 10.1038/523149a. [DOI] [PubMed] [Google Scholar]
- 19.Dobin A, et al. STAR: ultrafast universal RNA-seq aligner. Bioinformatics (Oxford, England) 2013;29:15–21. doi: 10.1093/bioinformatics/bts635. [DOI] [PMC free article] [PubMed] [Google Scholar]
- 20.Okonechnikov K, Imai-Matsushima A, Paul L. InFusion: Advancing Discovery of Fusion Genes and Chimeric Transcripts from Deep RNA-Sequencing Data. 2016;11:e0167417. doi: 10.1371/journal.pone.0167417. [DOI] [PMC free article] [PubMed] [Google Scholar]
- 21.Hovestadt V, et al. Decoding the regulatory landscape of medulloblastoma using DNA methylation sequencing. Nature. 2014;510:537–541. doi: 10.1038/nature13268. [DOI] [PubMed] [Google Scholar]
- 22.Reimand J, Kull M, Peterson H, Hansen J, Vilo J. g:Profiler–a web-based toolset for functional profiling of gene lists from large-scale experiments. Nucleic acids research. 2007;35:W193–200. doi: 10.1093/nar/gkm226. [DOI] [PMC free article] [PubMed] [Google Scholar]
- 23.Lienhard M, et al. QSEA-modelling of genome-wide DNA methylation from sequencing enrichment experiments. Nucleic acids research. 2016 doi: 10.1093/nar/gkw1193. [DOI] [PMC free article] [PubMed] [Google Scholar]
- 24.Matys V, et al. TRANSFAC and its module TRANSCompel: transcriptional gene regulation in eukaryotes. Nucleic acids research. 2006;34:D108–110. doi: 10.1093/nar/gkj143. [DOI] [PMC free article] [PubMed] [Google Scholar]
- 25.Johann PD, et al. Atypical Teratoid/Rhabdoid Tumors Are Comprised of Three Epigenetic Subgroups with Distinct Enhancer Landscapes. Cancer cell. 2016;29:379–393. doi: 10.1016/j.ccell.2016.02.001. [DOI] [PubMed] [Google Scholar]
- 26.Heinz S, et al. Simple combinations of lineage-determining transcription factors prime cis-regulatory elements required for macrophage and B cell identities. Molecular cell. 2010;38:576–589. doi: 10.1016/j.molcel.2010.05.004. [DOI] [PMC free article] [PubMed] [Google Scholar]
- 27.Buenrostro JD, Giresi PG, Zaba LC, Chang HY, Greenleaf WJ. Transposition of native chromatin for fast and sensitive epigenomic profiling of open chromatin, DNA-binding proteins and nucleosome position. Nature methods. 2013;10:1213–1218. doi: 10.1038/nmeth.2688. [DOI] [PMC free article] [PubMed] [Google Scholar]
- 28.Zhang X, et al. Identification of focally amplified lineage-specific super-enhancers in human epithelial cancers. 2016;48:176–182. doi: 10.1038/ng.3470. [DOI] [PMC free article] [PubMed] [Google Scholar]
- 29.Forbes SA, et al. COSMIC: somatic cancer genetics at high-resolution. Nucleic acids research. 2017;45:D777–d783. doi: 10.1093/nar/gkw1121. [DOI] [PMC free article] [PubMed] [Google Scholar]
- 30.Subramanian A, et al. Gene set enrichment analysis: a knowledge-based approach for interpreting genome-wide expression profiles. Proc Natl Acad Sci U S A. 2005;102:15545–15550. doi: 10.1073/pnas.0506580102. [DOI] [PMC free article] [PubMed] [Google Scholar]
Associated Data
This section collects any data citations, data availability statements, or supplementary materials included in this article.
Supplementary Materials
Supplementary Table 1 Heidelberg Sample Information
Sample identifiers for each genomic platform in the Heidelberg cohort
Supplementary Table 2 Toronto Sample Information
Sample identifiers for each genomic platform in the Toronto cohort
Supplementary Table 3 Heidelberg ChIP-seq statistics
ChIP sequencing summary statistics from the Heidelberg cohort
Supplementary Table 4 Toronto ChIP-seq statistics
ChIP sequencing summary statistics from the Toronto cohort
Supplementary Table 5 WGS statistics
Whole genome sequencing summary statistics from the Heidelberg cohort
Supplementary Table 6 WES statistics
Whole exome sequencing summary statistics from the Heidelberg cohort
Supplementary Table 7 SNVs INDELS
Summary of somatic nucleotide variants and insertion-deletions identified in the Heidelberg cohort
Supplementary Table 8 Heidelberg SEs
Summarized super enhancers detected in the Heidelberg cohort
Supplementary Table 9 Toronto SEs
Summarized super enhancers detected in the Toronto cohort
Supplementary Table 10 Confirmed SEs both cohorts
Super enhancers detected in both the Heidelberg and Toronto cohorts
Supplementary Table 11 PFA-EnhancerAssociatedGene
Subgroup specific enhancers and super enhancers detected in PF-EPN-A ependymoma
Supplementary Table 12 PFB-EnhancerAssociatedGene
Subgroup specific enhancers and super enhancers detected in PF-EPN-B ependymoma
Supplementary Table 13 PFSE-EnhancerAssociatedGene
Subgroup specific enhancers and super enhancers detected in PF-EPN-SE ependymoma
Supplementary Table 14 RELA-EnhancerAssociatedGene
Subgroup specific enhancers and super enhancers detected in ST-EPN-RELA ependymoma
Supplementary Table 15 YAP1-EnhancerAssociatedGene
Subgroup specific enhancers and super enhancers detected in ST-EPN-YAP1 ependymoma
Supplementary Table 16 STSE-EnhancerAssociatedGene
Subgroup specific enhancers and super enhancers detected in ST-EPN-SE ependymoma
Supplementary Table 17 SE-pathway-analysis
Significant SE driven pathways enrichment in each molecular subgroup of ependymoma
Supplementary Table 18 Motif Analysis
Significant known DNA motifs identified in regions of open chromatin within shared ependymoma typical enhancers
Supplementary Table 19 Core TF network
List of ependymoma transcription factors (TF) and overall TF connectivity
Supplementary Table 20 Subgroup Specific TF network
List of ependymoma transcription factors (TF) with subgroup specific activity
Supplementary Table 21 SE Drug Gene Integration
Drugs predicted by integration of ependymoma tumor specific genes with the WashU drug gene interaction database
Supplementary Table 22 Subtype SE drug-gene
Drugs predicted by integration of ependymoma subgroup-specific genes with the WashU drug gene interaction database
Supplementary Table 23 shRNA sgRNA construct details
List of shRNA and sgRNA sequences used and their targets in the manuscript
Data Availability Statement
All raw data files were deposited to the European Genome Phenome archive under the accession number: EGAS00001002696.