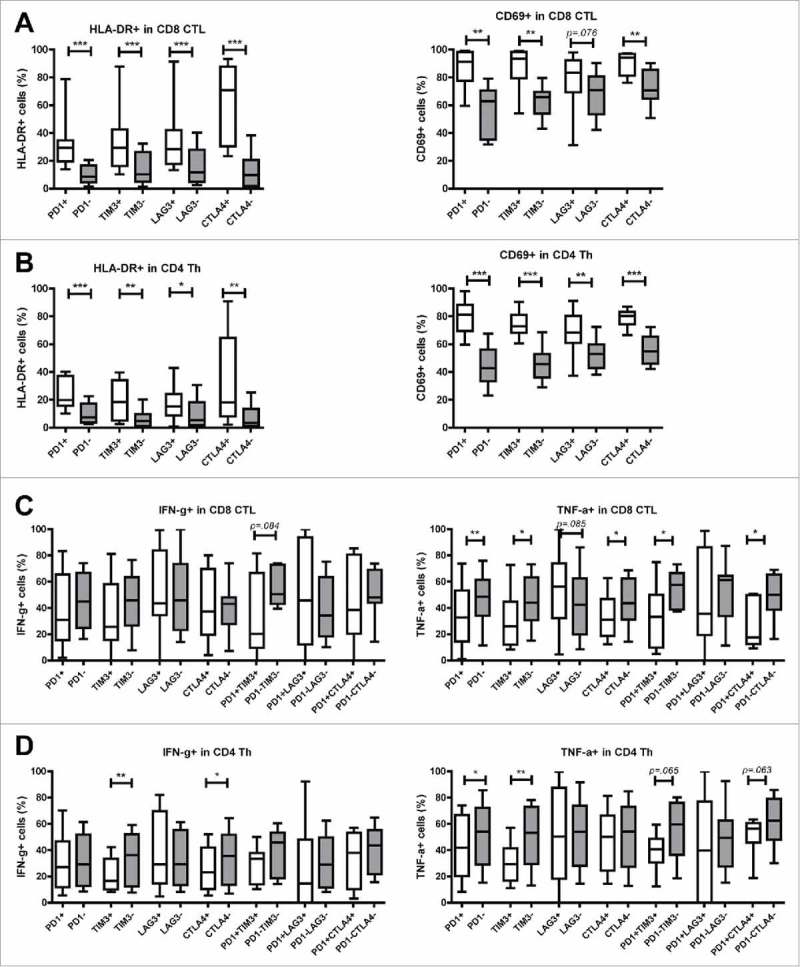
Figure 4.

Tumor-infiltrating T cells expressing inhibitory receptors show increased expression of activation markers. TIL from MMR-proficient LM-CRC were stained ex vivo with antibodies against surface activation markers HLA-DR and CD69. (A) (B) The frequencies of HLA-DR+ or CD69+ cells in (A) CD8+ CTL and (B) CD4+ Th that do or do not express PD-1, TIM3, LAG3, or CTLA4 are presented (n = 9–11). Lines show medians, whiskers depict minimum to maximum. Differences were analyzed by paired t test or Wilcoxon matched pairs test. (C) (D) TIL from MMR-proficient LM-CRC were stimulated with PMA and ionomycin at 37°C for five hours, in the presence of protein transport inhibitor brefeldin for the last four hours, followed by intracellular cytokine staining. The frequencies of cytokine-producing cells in (C) CD8+ CTL and (D) CD4+ Th that do or do not express inhibitory receptors are presented (n = 7–12). Lines show medians, whiskers depict Min to Max, boxes indicate the 25th to 75th percentiles. Differences were analyzed by paired t test or Wilcoxon matched pairs test; *p < 0.05, **p < 0.01, ***p < 0.001.
