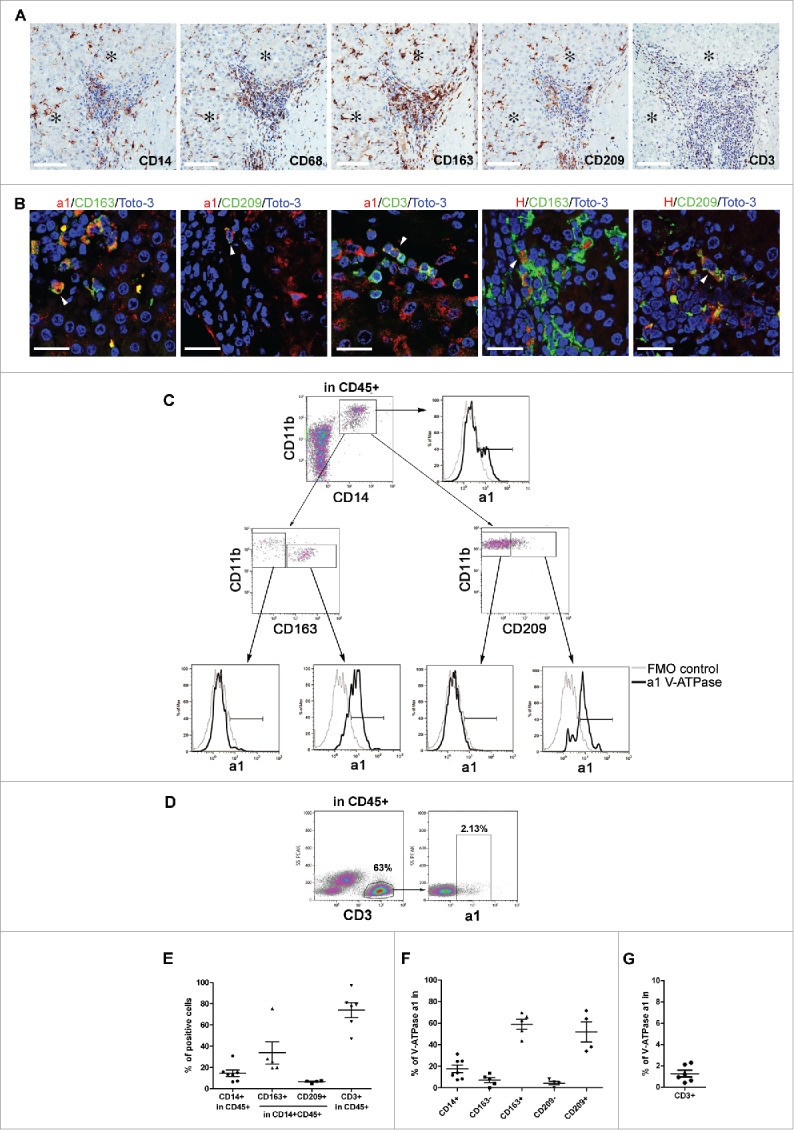
Figure 5.

Expression of V-ATPase in immune cells infiltrating HCC tissues. (A) Representative images of immunohistochemical staining for the myeloid-associated markers CD14, CD68, CD163, CD209 and the CD3 T cell marker in HCC tissues. Scale bars = 100 μm are shown. *Identifies the tumor area. (B) Triple-labeled immunofluorescence staining for a1 and H1 subunits of the V-ATPase complex (red) and CD163 (green), CD209 (green) or CD3 (green) in HCC tissues. Nuclei were stained with Toto-3 (blue). White triangles indicate the co-expression of the analyzed markers. Representative images with scale bars = 25 μm. No co-staining was found for CD3 and V-ATPase H1 (data not shown). (C) Multiparametric flow cytometry analysis of live myeloid cells in cell suspensions of freshly dissociated HCC surgical specimens. The CD209 and CD163 positive population has been defined by setting the marker on the corresponding FMO control. The cell surface expression of V-ATPase a1 was evaluated within the CD14+CD11b+, CD11b+CD163−, CD11b+CD163+ CD11b+CD209− and CD11b+CD209+ cell populations and the corresponding histograms are reported (black line). FMO control is shown (gray line). (D) Multiparametric flow cytometry analysis of cell surface V-ATPase a1 expression in live CD3 cells in cell suspensions of freshly dissociated HCC tumors. V-ATPase a1 positive cells have been defined using the FMO control. (E) The graph summarizes the percentages of CD14+, CD163+, CD209+ and CD3+ cells found in the analyzed HCC samples. (F-G) The percentages of V-ATPase a1-positive cells assessed in the indicated myeloid cell populations and within the CD3+ cells for all the analyzed samples.
