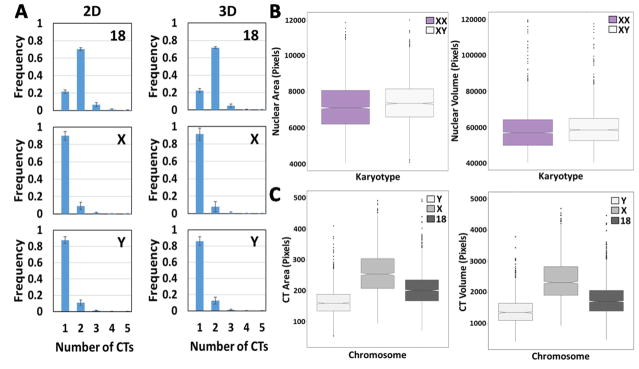
Fig. 2.
2D vs. 3D image analysis of segmented CTs and nuclei. (A) Histograms showing the number of chromosomes HSA-18, -X and -Y per nucleus in XY cells using 2D or 3D analysis. Values represent averages from three experiments ± SD. (B) Top left: Box plots of measured nuclear area of XX and XY cells using 2D nuclear segmentation. Top right: Box plots of measured nuclear volume of XX and XY cells using 3D nuclear segmentation. (C) Bottom left: Box plots of measured CT area of chromosomes HSA-18, -X and -Y in XY cells using 2D CT segmentation. Bottom right: Box plot of measured CT volume of chromosomes HSA-18, -X and -Y in XY cells using 3D CT segmentation method. Boxes show the 25th, 50th (median) and 75th percentile of the distributions and whiskers extend to 1.5 x inter-quantile range (IQR), outliers are represented as dots. Notches indicate the estimated 95% confidence interval of the median (CI). Distributions represent data from approximately 5000 nuclei.

