MicroRNA-21 (miR-21) is one of the most abundant microRNAs in mammalian cells. It has been intensively studied for its role in regulating apoptosis and oncogenic transformation. However, the impact of miR-21 on host anti-tumor immunity remains unknown. Tumor-associated macrophages are a major leukocyte type that infiltrates tumors and predominantly develops into immunosuppressive, tumor-promoting M2-like macrophages. In contrast, the pro-inflammatory M1-like macrophages have tumoricidal activity. In this study, we show that genetic deficiency of miR-21 promotes the polarization of macrophages toward an M1-like phenotype in vivo and in vitro in the presence of tumor cells; thus it confers host mice with enhanced anti-tumor immunity. By downregulating JAK2 and STAT1, miR-21 inhibits the IFN-γ-induced STAT1 signaling pathway, which is required for macrophage M1 polarization. We also show that the expression of miR-21 in macrophages is regulated upon polarization stimuli as well as upon macrophages co-culturing with tumor cells. Thus, tumor cells may stimulate miR-21 expression in tumor-associated macrophages to prevent tumoricidal M1 polarization. However, augmented STAT1 signaling mediated by miR-21 deficiency upregulates PD-L1 expression in macrophages, which is known to inhibit phagocytic anti-tumor activity. This adverse effect can be alleviated by PD-1 blockade; indeed, miR-21 depletion in macrophages and PD-1 antibody treatment offer superior anti-tumor activity than either agent alone. These studies shed lights on potential application of the combination of miR-21 inhibition and immune checkpoint blockade to target the tumor microenvironment.
Introduction
MicroRNAs (miRNAs) are naturally occurring noncoding RNAs about 22 nucleotides in length that negatively regulate gene expression at the post-transcriptional level 1, 2. Mature miRNAs pair with a stretch of sequence in the 3′ untranslated region (3′UTR) of target mRNAs, causing their degradation or otherwise inhibiting protein translation 2–5. Extensive studies have revealed that miRNAs participate in a variety of biological processes, many of which are central to cancer, including cell proliferation and death, cell differentiation, and maintenance of stem cell potency 1, 2, 6, 7. miRNA-based cancer therapies are under development 2, 8, 9.
miR-21 is one of the most abundant miRNAs in mammalian tissues and makes up about 10% of total miRNAs in several types of tumor cells 10, 11. miR-21 regulates apoptosis in tumor cells as well as regulated necrosis in mouse embryonic fibroblast and pancreas acinar cells 12–15. Generally, miR-21 exerts oncogenic function through inhibiting apoptosis as it suppresses the expression of the pro-apoptosis proteins PDCD4, PTEN, and many others 12, 13, 16. In addition, miR-21 promotes RIP3-mediated necroptosis in mice during acute pancreatitis by targeting Spry2 and PTEN 15. miR-21 also appears to regulate the polarization of cultured bone marrow-derived macrophages (BMDMs) 15, 17. However, the role of miR-21 in the tumor microenvironment remains elusive.
Tumor-associated macrophages (TAMs) constitute a major leukocytic infiltrate within the stroma of many tumor types. In contrast to macrophage function in normal tissue, TAMs appear to have two major distinctive phenotypes: the pro-inflammatory and tumoricidal “M1” macrophage and immunosuppressive, tumor-promoting “M2” macrophage 18–20. The M1–M2 classification was originally reported when gene expression was profiled in macrophages stimulated with either the TH-1 cytokine, interferon γ (IFN-γ) with or without lipopolysaccharide [LPS] or the TH-2 cytokine interleukin-4 (IL-4) 20–23. Pro-inflammatory M1 macrophages display elevated expression of tumor necrosis factor α (TNF-α), interleukin-6 (IL-6), major histocompatibility complex class II, inducible nitric oxide synthase 2 (iNOS/NOS2), and the TH-1 cell-attracting chemokine CXCL9 24. M2 macrophages have elevated expression of mannose receptor 1 (MRC1/CD206), interleukin-4 receptor α subunit (IL-4Rα), and arginase 1 (Arg1) 17, 20. In mouse models of tumorigenesis, high expression of CD206 and low expression of integrin α X (CD11c) marks M2 TAMs (MRC+CD11clow), whereas CD11c+MRClow marks the pro-inflammatory M1 TAMs 25–28. Extensive studies have established that signaling via the JAK1/JAK2- STAT1 pathway and the JAK1/JAK3-STAT6 pathway is responsible for activating genes induced by IFN-γ and IL-4, respectively 22, 29–32.
In this study, we report that in syngeneic models, mouse melanoma B16 and Lewis lung carcinoma (LLC1) tumor growth was significantly inhibited in miR-21-deficient mice. Mice receiving miR-21-deficient bone marrow cells had higher numbers of M1 TAMs in the tumor microenvironment and a stronger immune response to B16 tumors. We found miR-21 negatively regulated JAK2 and STAT1 protein expression and inhibited the JAK-STAT signaling pathway upon IFN-γ stimulation. In miR-21-deficient BMDMs, the expression of M1 signature genes was elevated when the cells were co-cultured with B16 tumor cells. Moreover, we found that PD-L1 expression was elevated in miR-21-deficient macrophages, which would inhibit phagocytic anti-tumor immunity. Yet the combination with PD-1 antibodies and miR-21-deficient macrophages offered anti-tumor activity superior to either agent alone. Our study suggests that miR-21 depletion enhances host immune system against tumor development through M1 polarization of TAMs.
Materials and Methods
miR-21 and cancer patient survival analysis using data from The Cancer Genome Atlas (TCGA)
Among 33 TCGA cancer cohorts, there were 21 of them having miRNA expression results. We downloaded miR-21 expression data of these 21 cohorts of cancer patients from http://www.oncolnc.org/ 33 and analyzed the association between miR-21 expression level and 5-year overall survival. The median value of miR-21 expression levels was used the cutoff to classify patients two groups (miR-21high and miR-21low). The follow-up time was 30 days to 5 years. A log-rank test was performed for each cohort comparing a miR-21high and a miR-21low group.
Reagents
For immunoblotting analysis, the antibodies against phospho-STAT1 (at residue Y701) (58D6), JAK2 (D2E12), PDCD4 (D29C6), IκBα (L35A5), phospho-p65 (at residue S536) (93H1), phospho-IκBα (at residues S32 and S36)(5A5), phospho-IKKα/β (93H1), HRP-linked anti-rabbit IgG (7074), and HRP linked anti-mouse IgG (7076) were purchased from Cell Signaling Technology (Danvers, MA); antibodies against STAT1 (E-23) and JAK1 (B-3) were from Santa Cruz (Dallas, TX), the antibody against β-actin was from Sigma-Aldrich (St. Louis, MO).
For flow cytometry analysis, antibodies against CD16/CD32, CD3ε (145-2C11), CD4 (RM4-5), CD8 (53-6.7), CD11b (M1/70), Gr-1 (RB6-8C5), CD11c (N418), F4-80 (BM8), GzmB (NGZB), TNF-α (MP6-XT22), IFN-γ (XMG1.2), and PD-L1 (M1H5) were obtained from ThermoFisher Scientific (Waltham, MA), and antibodies against CD206 (C068C2) and CD45 (30-F11) and fixable viability dye (to detect live vs. dead cells) were from BioLegend (San Diego, CA).
For activated T cells, antibodies against CD3ε (17A2), CD28 (37.51) were from ThermoFisher Scientific. To stimulate MEFs and BMDMs, LPS was purchased from Sigma-Aldrich, recombinant murine IFN-γ was from Gold Biotechnology (St. Louis, MO), and recombinant murine IL-4 and recombinant M-CSF were from Peprotech (Rocky Hill, NJ). A locked nucleic acid-modified miR-21 inhibitor and its control were purchased from Exiqon (Denmark). Fetal bovine serum (FBS) and antibiotics for cell culture were from ThermoFisher Scientific. Dulbecco’s modified Eagle’s medium (DMEM) and RPMI-1640 medium were produced by the cell culture core of the Lerner Research Institute, Cleveland Clinic (Cleveland, OH). β-mercaptoethanol was obtained from Sigma-Aldrich. T cells were isolated using the EasySep Mouse T cell isolation kit from StemCell Technologies (Vancouver, Canada). Luciferase activity was measured with the Dual-Glo Luciferase Kit purchased from Promega (Madison, WI).
Mice
The miR-21 knockout mouse line (miR-21−/−) in the C57bl/6 genetic background was generated previously 13, 15. WT mice and miR-21−/− mice were obtained from interbreeding miR-21+/− mice. All mice used in this study were maintained in pathogen-free barrier animal facilities in the Biological Resources Unit, Lerner Research Institute, Cleveland Clinic. Animals were arbitrarily allocated to experimental groups matched on body weight, age, and sex. All animal experimental procedures were approved by Institutional Animal Care and Use Committee of the Cleveland Clinic.
Tissue culture and transfection
WT and miR-21−/− MEFs and WT and miR-21−/− BMDMs were prepared as described previously 15. B16-F10 (B16) melanoma and LCC1 cells were obtained from American Type Culture Collection (Manassas, VA). B16 cells, LLC1 cells, WT and miR-21−/− MEFs were cultured in DMEM supplemented with 10% FBS, 100 U/mL penicillin and 100 μg/mL streptomycin. WT and miR-21−/− BMDMs were cultured in DMEM supplemented with 10% FBS, 100 U/mL penicillin, 100 μg/mL streptomycin, 50 μM β-mercaptoethanol and 10 μg/mL M-CSF for 7 days followed by IFN-γ treatment for 0 to 40 h (for immunoblotting analysis) or for 12 to 48 h (for quantitative reverse transcription real-time PCR [qPCR] analysis), or co-cultured with 1×10⁷ B16 cells alone or in combination with IFN-γ for 48 h. WT and miR-21−/− CD8+ T cells and CD4+ T cells were isolated from mouse spleens using the EasySep Mouse T cell isolation kit and were cultured in RPMI-1640 media supplemented with 10% FBS, 100 U/mL penicillin, 100 μg/mL streptomycin, and 50 μM β--mercaptoethanol. T cells were stimulated with plate-bound antibodies against CD3 (1 μg/mL) and CD28 (2 μg/mL) for 24 h in the presence of brefeldin A (5 μg/mL, ThermoFisher Scientific). For transfection, 2×10⁵ WT and miR-21−/− MEF cells were seeded in 6-well plates and transfected with 40 pmole of miRNAs or locked nucleic acid- modified miRNA inhibitors (Exiqon) using lipofectamine RNAiMAX Reagent (ThermoFisher Scientific). At 60 h after transfection, cells were collected and total proteins extracted for immunoblotting. For a dual luciferase reporter assay, miR-21−/− MEFs were transfected with miR-21 and pmirGLO Dual Luciferase Vector harboring either WT 3′UTR or mutant 3′UTR of the STAT1 or JAK2 gene using Lipofectamine 3000 (ThermoFisher Scientific); 60 h post transfection, the luciferase activity of cell lysates were measured using the Dual-Glo Luciferase Kit (Promega) according to the manufacturer’s instructions.
Immunoblotting
WT and miR-21−/− BMDM or WT and miR-21−/− MEF cells were stimulated with LPS (50 ng/mL), mouse IFN-γ (200U/mL) or mouse IL-4 (10 ng/mL) for the indicated times. Cells were then lysed with RIPA buffer (ThermoFisher Scientific) containing protease and phosphatase inhibitor cocktail (ThermoFisher Scientific), and protein concentration was measured with a BCA protein assay kit (ThermoFisher Scientific). After mixing with Laemmli sample buffer (Bio-Rad Laboratories; Hercules, CA) containing 10% β-mercaptoethanol, the cell lysates were denatured at 95°C for 5 min and 20 μg of each was subjected to SDS-PAGE and electro-transferred onto PVDF membrane (0.45 μm, ThermoFisher Scientific). The membranes were blocked in 5% non-fat dry milk in TBS-T for 1 h at room temperature. Target proteins were detected with 1:1000 diluted primary antibodies and the corresponding secondary antibodies linked with horseradish peroxidase in blocking buffer. The target proteins were visualized with enhanced chemiluminesence western blotting substrate (ThermoFisher Scientific) and exposed to film (Bioblot BXR film, Laboratory Products Sales; Rochester, NY). For rebprobing, the membranes were stripped in 1×stripping buffer (ThermoFisher Scientific).
Plasmid construction and quantitative reverse transcription PCR
The 3′UTR region containing 958 nucleotides between ATTTAATATAAAGATATTTA and CTAATAAAAGAAATGC (5′-3′) of STAT1 transcript variant 1 (NCBI accession ID: NM_001205313.1) was synthesized and cloned into the pmirGLO dual luciferase reporter vector (Promega) as the WT STAT1 or JAK2 3′UTR reporter. In the mutant STAT1 3′UTR reporter, the 8-bp sequence complementary to the miR-21 seed sequence (5′GAUAAGCU3′) was deleted. For qPCR, cells were harvested with Trizol (ThermoFisher Scientific) and RNA was extracted using the RNeasy mini kit (Qiagen; Hilden, Germany) according to the manufacturer’s instructions. Total RNA was reverse transcribed with a kit (iScript Selective Reverse Transcription Supermix Kit, Bio-Rad Laboratories) and quantitative PCR performed using iQ SYBR Green Supermix (Bio-Rad Laboratories). The specific primers (5′-3′) sequences are listed in Supplemental Table 1.
Murine syngeneic xenograft models
B16 melanoma cells (2 × 10⁵) were subcutaneously injected to the right flank of 8- to 10-week-old mice; for the LLC1 subcutaneous tumor model, 1 × 10⁶ LLC1 cells were injected. In both models, tumor size was measured every other day with calipers, and tumor volume was calculated as π/6 × length × (width)2. Mice were euthanized 16 days post-injection to analyze immune cell infiltration in tumors. Tumors were blotted dry before weighted. To understand the impact of miR-21 deficiency in immune cells, bone marrow transplantation was performed as described previously 15; 4 weeks later, animals were inoculated with B16 cells (2 × 10⁵) subcutaneously. For macrophage adaptive transfer therapy, WT and miR-21−/− BMDMs were co-cultured with B16 cells for 48 h in an insert system with cell culture-treated polycarbonate 0.4-micron porous membranes, allowing exchanges of biomolecules but not cells between the insert and the 6-well plate (Nunc Cell Culture insert, ThermoFisher Scientific); 4 × 10⁶ BMDMs were seeded in 6-well plates with 1 × 10⁷ B16 tumor cells seeded in the insert. These in vitro-trained BMDMs were mixed with fresh B16 cells at 1:1 ratio (2×10⁵ each) and injected into the flank of WT C57BL/6 mice. For PD-1 antibody treatment, WT mice bearing tumors developed from B16 or BMDM cells were given PD-1 antibody (RMP1-14, Bioxcell; West Lebanon, NH) at 10 mg/kg every 3 days starting 8 days after tumor inoculation (when average tumor volume was ~ 100 mm3); mice were euthanized at 16 days post-inoculation and tumors collected and analyzed.
Isolation of tumor-associated cells and flow cytometry
Excised tumors were cut into ~2 mm3 blocks and digested into single-cell suspensions by incubation with collagenase IV (1 mg/mL, Worthington Biochemical Corporation; Lakewood, NJ), β-mercaptoethanol, and DNase I (10 μg/mL, Worthington Biochemical Corporation) in HEPEs (pH7.4) buffer at 37°C for 30 min. The cell suspension was then centrifuged at 400g for 10 min, rinsed with PBS, and filtered through a 70-μm cell strainer. Cells were then suspended and incubated for 15 min with antibodies against CD16 and CD32 (10 μg/mL, final concentration), and subjected to staining. Immune-cell types and subsets in tumors were identified using the following cell surface markers: total TAMs, CD45+CD11b+Gr1−F4/80+; M1-like TAMs, CD45+CD11b+Gr1−F4/80+MRC1−/lowCD11c+; M2-like TAM, CD45+CD11b+Gr1−F4/80+CD11c−/lowMRC1+; neutrophils, CD45+CD11b+Gr1+; CD8+ T cells, CD45+NK1.1−CD11b−B220−CD19−CD8+; and CD4+ T cells, CD45+NK1.1−CD11b−B220−CD19−CD4+.
Statistical analysis
Data were presented as mean ± standard error of the mean (s.e.m.). SPSS16.0 software (SPSS Inc. Chicago, IL) was used for all statistical analyses. Comparisons between two groups were analyzed with a two-tailed unpaired t test. For three or more group comparisons, one-way analysis of variance (ANOVA) was used. Statistical significance was set at P ≤ 0.05.
Results
miR-21 expression was associated with shorter survival in patients with specific cancers
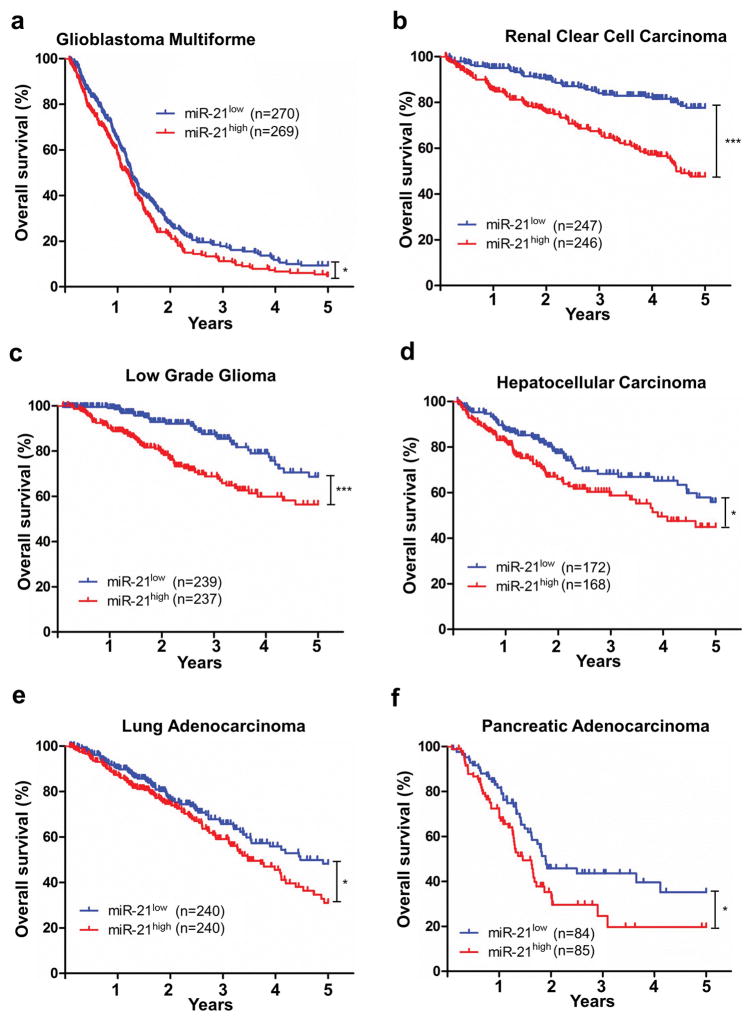
Analysis of the 21 cancer patient cohorts from the TCGA database revealed that in 6 cohorts, miR-21 expression level was inversely associated with patient survival (Supplemental Table 2). These cancers are glioblastoma multiforme, renal clear cell carcinoma, low grade glioma, hepatocellular carcinoma, lung adenocarcinoma, and pancreatic adenocarcinoma (Figure 1a–1d). The differential associations between miR-21 and patient survival in various types of cancers, particularly a positive association in rectum adenocarcinomas and no association in melanoma, were notable (Supplemental Table 2). There are many factors that could confound patient survival: miR-21 expression in tumor cells versus in stroma, compositions of immune cells within the tumor, miR-21 target gene expression, and treatments, etc.
Figure 1. miR-21 expression is associated with decreased survival in 6 patient cohorts identified in the TCGA database.
(a) Glioblastoma multiforme; (b) Renal clear cell carcinoma; (c) Low grade glioma; (d) Hepatocellular carcinoma; (e) Lung adenocarcinoma; (f) Pancreatic adenocarcinoma. Kaplan–Meier results were analyzed by log-rank test. *P ≤ 0.05, ***P ≤ 0.001.
miR-21-deficient mice developed smaller B16 and LLC1 tumors
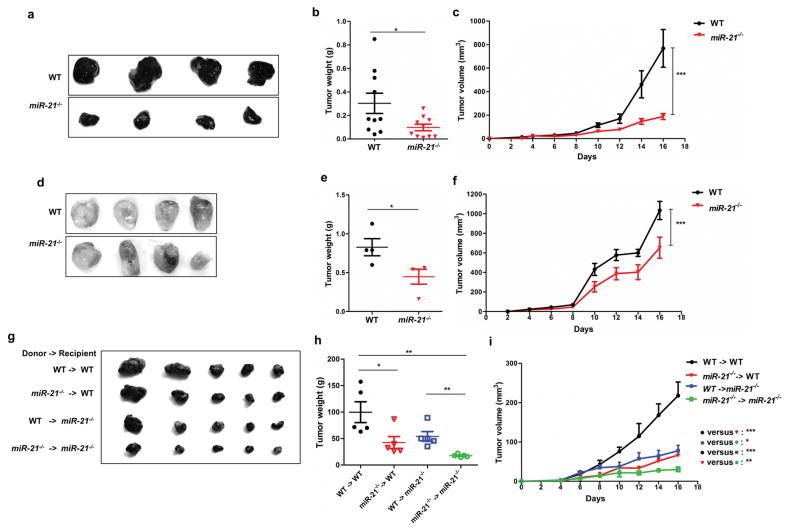
We employed syngeneic tumor models to evaluate the role of miR-21 in the tumor microenvironment. We injected miR-21 deficient (miR-21−/−) mice and WT mice with melanoma B16 cells and found that miR-21−/− mice developed smaller tumors than the WT control (Figure 2a–2c). Injection of LLC1 cells produced similar results (Figure 2d–2f). These data imply that miR-21-deficient mice as a syngeneic host have enhanced anti-tumor activity. We noted that in cutaneous melanoma, there was no association between patient survival and miR-21 expression (Supplemental Table 2), yet we decided to use B16 melanoma mouse models in ensuing experiments: (1) the impact of miR-21 deficiency appears greater in B16 tumors than LLC1 tumors; and (2) B16 is the most widely used mouse cell models in immunotherapy research.
Figure 2. miR-21-deficient mice develop smaller tumors in syngeneic xenograft models.
WT and miR-21-deficient mice (n = 10 per group) were implanted with B16 (a–c) or LLC1 (d–f) tumor cells. For panels g-i, WT and miR-21−/− recipient mice (n = 5 per group) received either WT or miR-21−/− bone marrow (donor) and underwent subcutaneous syngeneic B16 tumor cell xenografting. (a, d, g) images of representative tumors; (b, e, h) tumor weights; and (c, f, i) tumor volumes. Data were analyzed by one-way ANOVA for tumor volumes and by a two-tailed unpaired-t test for tumor weights. *P ≤ 0.05, **P ≤ 0.01, ***P ≤ 0.001.
To dissect the impact of miR-21 deficiency in immune cells, we performed reciprocal bone marrow transplantation between WT and miR-21−/− mice. At 4 weeks after bone marrow transplantation, mice were subcutaneously inoculated with B16 tumor cells. As shown in Figure 2g–2i, both WT and miR-21−/− recipients receiving miR-21−/− bone marrow had smaller tumors than their counterparts receiving WT bone marrow. These data indicate that miR-21 deficiency in hematopoietic cells, at least partially, equips recipient mice with enhanced anti-tumor immunity. We also noted that among the four groups, miR-21−/− mice that received miR-21−/− bone marrow had the slowest tumor growth with lowest tumor weight and smallest tumor size at sacrifice (Figure 2i), indicating that other parts of the miR-21 depleted environment is refractory to tumor growth than immune cells; this is out of the scope of the current study.
miR-21 deficiency prompted M1 polarization in TAMs
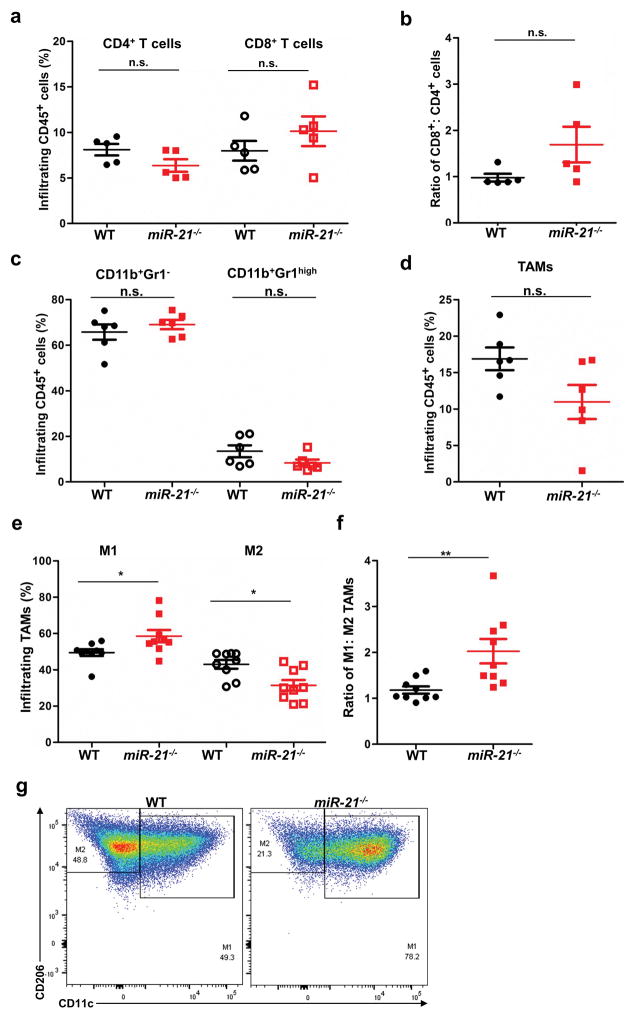
To identify the cause of enhanced tumor resistance in miR-21 deficient mice, we analyzed immune cell infiltration in tumors using flow cytometry (Figure 3a–3g). We found that the number of infiltrating CD4+ T cells, CD8+ T cells, and as well as the CD8+ T : CD4+ T ratio in B16 xenograft tumors was comparable between WT and miR-21−/− mice (Figure 3a–3c). Concerning myeloid cells, neutrophils and TAMs were also present at similar levels in tumors from WT and miR-21−/− mice (Figure 3c–3d). However, tumors from miR-21-deficient mice had a greater proportion of M1 TAMs (Figure 3e–3g), suggesting that M1 polarization of miR-21-deficient TAMs enhanced the anti-tumor immunity of miR-21−/− mice.
Figure 3. miR-21−/− mice develop tumors with a greater number of infiltrating M1 TAMs.
Infiltrating leukocytes isolated from B16 tumors developed in WT and miR-21−/− mice were analyzed by flow cytometry. (a) Infiltrating CD8+ T cells and CD4+ T cells (n = 5 tumors for T cells); (b) CD8+: CD4+ T cell ratio; (c) CD11b+Gr1− subgroup and CD11b+Gr1high (neutrophils) subgroup (n = 6 tumors); (d) TAMs (n = 6 tumors); (e) M1 and M2 TAM subtypes (n = 9 tumors); and (f) M1/M2 ratio of TAMs. (g) Representative flow cytometry graphs of M1 and M2 gating of cells isolated from tumors. *P ≤ 0.05, **P ≤ 0.01.
miR-21 and T cell activity in vitro
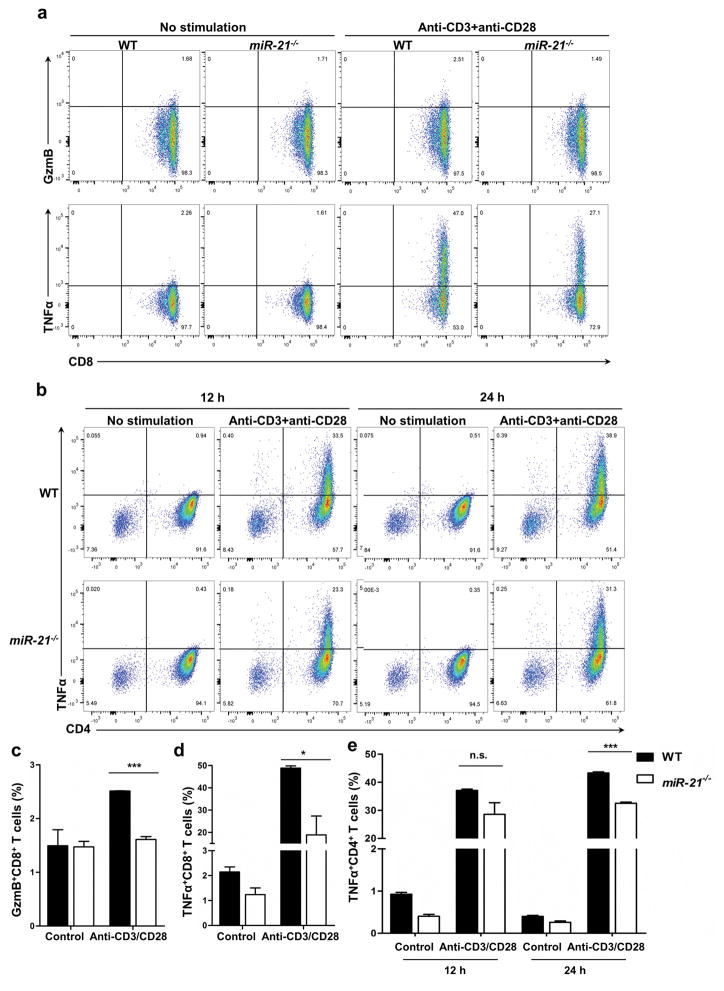
miR-21 has been reported to have a negative role in T cell development and activity 34, 35. To examine the possibility of enhanced T cell activity in miR-21−/− mice, we measured production of TNFα and cytolytic granules (as represented by protease granzyme B) in miR-21−/− and WT T cells using flow cytometry. Compared with WT counterparts, production of TNFα and granzyme B in miR-21−/− CD8+ T cells was lower in vitro (Figure 4a–4d). In CD4+ T cells, miR-21−/− also resulted in reduced production of TNFα (Figure 4b and 4e). These data imply that miR-21 deficiency impaired T cell ability to produce pro-inflammatory cytokines and cytolytic granules and thus indicate that miR-21 deficiency in T cells is unlikely to be the underlying cause for the enhanced anti-tumor activity seen in miR-21−/− mice.
Figure 4. miR-21 in CD8+ T cells and CD4+ T cells.
CD8+ T cells and CD4+ T cells were treated with antibodies against CD3 and CD28 for cytokine and cytolytic granzyme B (GzmB) production. (a and b) Representative graphs of flow cytometry analyses of CD8+ T cells with 24 h treatment (a) and CD4+ T cells with 12 h or 24 h treatment (b) treated with antibodies against CD3 and CD28. (c, d, e) Fractions of GzmB-positive CD8+ T cells (c), TNF-α-positive CD8+ T cells (d), and TNFα-positive CD4+ T cells (e). n = 3 biological isolates for both WT and miR-21−/− groups. *P ≤ 0.05, ***P ≤ 0.001.
miR-21 was required to balance macrophage polarization upon cytokine treatment in the presence of tumor cells
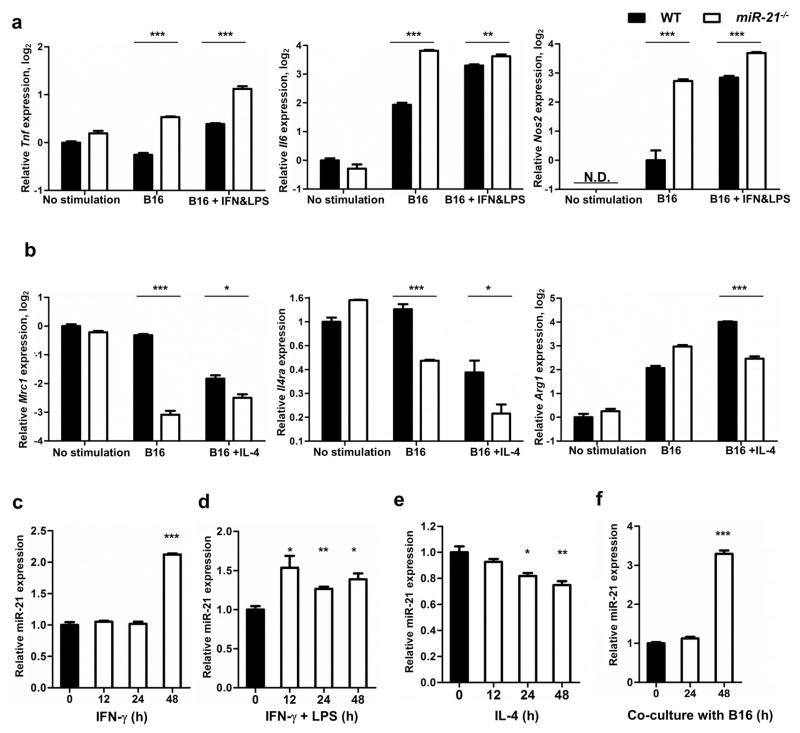
Given the altered M1: M2 TAM ratio in B16 tumors from miR-21−/− mice, we next determined the role of miR-21 in macrophage polarization. To this end, we co-cultured WT or miR-21−/− BMDMs with B16 tumor cells alone or in combination with stimulating cytokines. In the presence of B16 tumor cells, the expression of M1 markers (Tnf, Nos2, and Il6) was significantly higher in miR-21−/− BMDMs than in their WT counterparts as measured by qPCR, whereas that of M2 markers (including Mrc1, Il4ra, and Arg1) was lower (Figure 5a–b). This difference suggests that miR-21 deficiency potentiates TAMs toward an M1-like phenotype. We also determined the level of mature miR-21 during macrophage polarization. When WT BMDMs were stimulated with IFN-γ alone or in combination with LPS, miR-21 was markedly upregulated. WT BMDMs stimulated with IL-4 (which stimulates M2 cells), however, displayed reduced miR-21 expression (Figure 5c–5e). In addition, the level of mature miR-21 increased when BMDMs were co-cultured with B16 cells (Figure 5f). These data support that miR-21 in macrophages is precisely up- or down-regulated during polarization toward either the M1 or M2 phenotype, whereas it is elevated in the presence of tumor cells.
Figure 5. miR-21 in macrophages.
(a, b) qPCR measurement of (a) Tnf, Il6, and Nos2 and (b) Argc1, Mrc1, and Il4ra gene transcripts in WT and miR-21−/− bone marrow-derived macrophages at resting conditions, co-cultured with B16 cells, or co-cultured with B16 cells in addition to IFN-γ and LPS or IL-4 treatment. Y axis denotes log2 values of the relative expression levels of genes (except for Il4ra, which was the relative level of Il4ra) normalized to Gapdh. NOS2 was undetectable (N.D.) without stimulation. (c–f) Mature miR-21 was measured by qPCR in WT BMDMs upon stimulation with IFN-γ, IFN-γ and LPS, IL-4, or co-culture with B16 cells. Y axis denotes the relative expression levels of miR-21 using snoRNA-153 as a reference. Values are mean ± s.e.m.; *P ≤ 0.05, **P ≤ 0.01, ***P ≤ 0.001.
miR-21 regulates the IFN-γ pathway by targeting STAT1
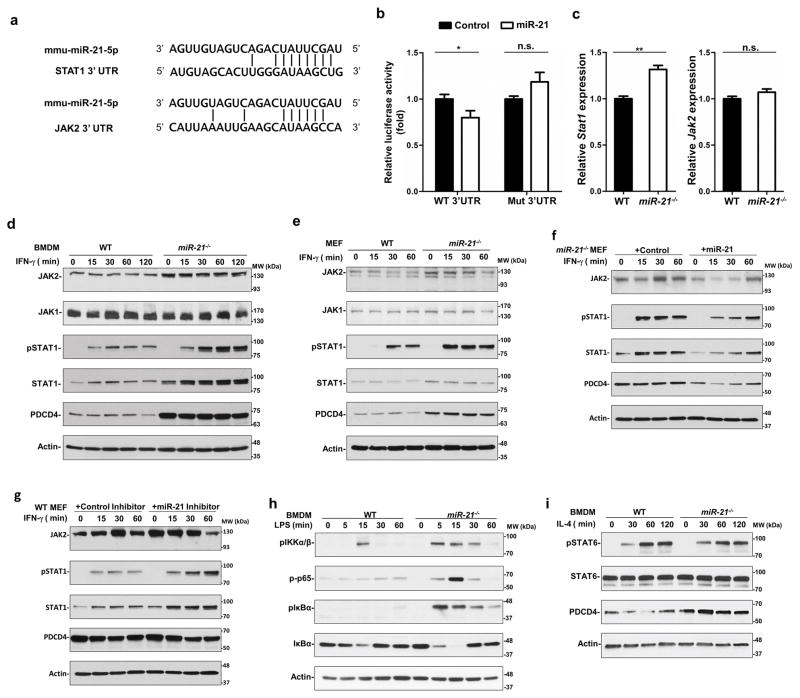
To elucidate the mechanism by which miR-21 mediated M1 polarization, we searched for potential miR-21 targets using the computational prediction program TargetScan 36. Noting that the JAK-STAT1 pathway is predominantly involved in M1 polarization, we focused on STAT1 and JAK2, two predicted miR-21 target genes (Figure 6a). We cloned the STAT1 and JAK2 3′UTRs downstream of a firefly luciferase reporter and found that intact miR-21 down-regulated the activity of the reporter with the STAT1 3′UTR (Figure 6b), but not the JAK2 3′UTR. When a mutant STAT1 3′UTR disrupting the miR-21 binding site was introduced, such down-regulation was reversed. We also determined the mRNA levels of STAT1 and JAK2 using qPCR and found that the mRNA level of STAT1, but not that of JAK2, in miR-21-deficient BMDMs was higher than in WT BMDMs (Figure 6c). We next determined JAK-STAT1 signaling in WT and miR-21−/− BMDMs. The expression of STAT1 and JAK2 in miR-21 deficient cells was greater than in WT BMDMs (Figure 6d). PDCD4, a well-known miR-21 target, was also expressed at a higher level in miR-21−/− BMDMs than in the WT control. Upon IFN-γ stimulation, phosphorylation of STAT1 at tyrosine 701 was induced in miR-21−/− BMDMs at a higher level than in WT BMDMs. The expression of JAK1, which was not predicted to be a miR-21 target, remained comparable between WT and miR-21−/− BMDMs. Similar results were observed in WT and miR-21−/− MEFs (Figure 6e). In miR-21−/− MEFs, introduction of miR-21 mimics suppressed STAT1 protein expression and IFN-γ-induced STAT1 phosphorylation (Figure 6f). In WT MEFs, a locked nucleic acid inhibitor of miR-21 enhanced STAT1 expression and phosphorylation (Figure 6g). Consistent with a previous report 37, miR-21 deficiency in BMDMs resulted in elevated LPS-induced NF-κB activation (Figure 6h), which contributed to M1 polarization. On the other hand, IL-4-induced STAT6 signaling, which regulated M2 macrophage polarization, was not affected in miR-21-deficient BMDMs (Figure 6i). Taken together, these data suggested that miR-21 downregulates STAT1 directly and JAK2 indirectly to inhibit the activity of IFN-γ-induced STAT1 signaling.
Figure 6. miR-21 downregulates JAK2 and STAT1 to suppress IFN-γ-mediated STAT1 signaling.
(a) Putative miR-21 binding sites within the 3′UTRs of STAT1 and JAK2. The matching sites are indicated by the vertical lines. (b) Activity of luciferase reporters containing wild type (WT) or mutant (Mut) miR-21 target sites in the STAT1 3′UTR. (c) mRNA levels of Stat1 and Jak2 in WT and miR-21−/− BMDMs. *P ≤ 0.05, **P ≤ 0.01, n.s., not significant. (d and e) Immunoblotting analysis of protein levels of JAK1, JAK2, phosphorylation of STAT1 on tyrosine 701 (pSTAT1), STAT1, PDCD4, and actin in BMDMs (d) and MEFs (e). (f and g) Immunoblotting analysis of protein levels of pSTAT1, STAT1, PDCD4 and actin in miR-21−/− MEFs transfected with miR-21 (f) or in WT MEFs transfected with a locked nucleic acid miR-21 inhibitor (g) and treated with IFN-γ (20 ng/mL) for up to 60 min. (h) Immunoblotting analysis of protein levels of phospho-IKKα/β, phospho-p65, phospho-IκB, and total IκB in WT and miR-21−/− BMDMs upon LPS (50 ng/mL) stimulation for the indicated times. (i) Immunoblotting analysis of protein levels of pSTAT6, STAT6, PDCD4, and actin in WT and miR-21−/− BMDMs upon stimulation with IL-4 (10 ng/mL) for indicated times.
Tumor cell-trained miR-21−/− macrophages suppressed tumor growth
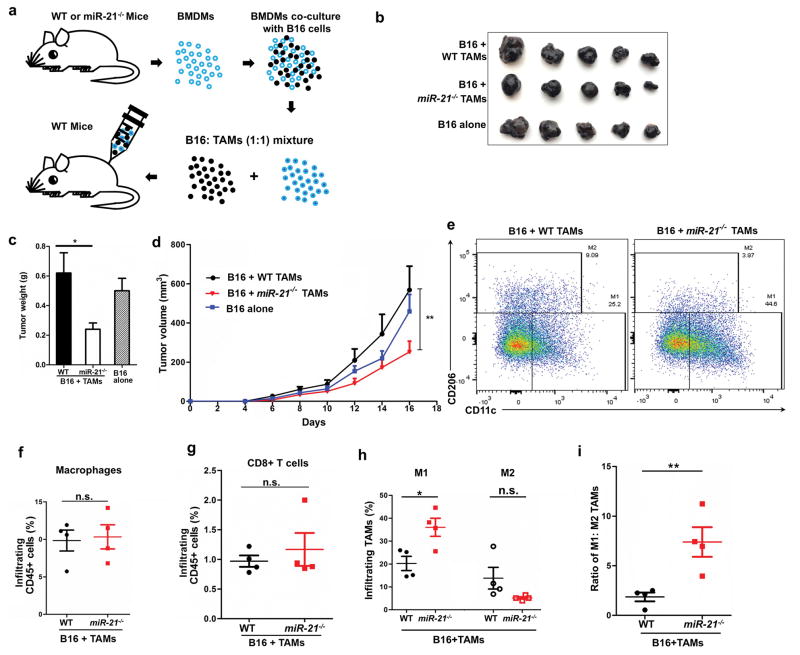
To determine whether miR-21 depletion has potential therapeutic impact, we introduced in vitro trained BMDMs into B16 xenografts. BMDMs were co-cultured with B16 tumor cells in vitro for 48 h and subsequently mixed with fresh B16 cells at a 1:1 ratio before being injected into WT mice (Figure 7a). Introduction of in vitro-trained WT BMDMs did not affect tumor growth, yet tumor cell-trained miR-21−/− BMDMs showed anti-tumor activity compared to the WT control, as judged by reduced tumor volume, smaller tumor size, and lower tumor weight (Figure 7b–7d). We next analyzed tumor-infiltrating immune cells and found that the total number of intratumoral macrophages and CD8+T cells were comparable between the WT and miR21−/− groups (Figure 7d–7g). However, due to the greater number of M1 cells, the ratio of M1: M2 in the miR-21−/− BMDM-containing tumors was significantly lower than the WT control (Figure 7h–7i).
Figure 7. miR-21−/− macrophages exerted stronger anti-tumor effects than their WT counterparts after co-culture with B16 cells.
(a) Schematic representation of in vitro macrophage cultivation and implantation with B16 tumor cells. (b) Representative images of B16 tumors 16 days post-inoculation; n = 5 for each group. (c) Tumor weights. (d) Tumor volumes; data were analyzed with one-way ANOVA. (e) Representative graphs of flow cytometry analysis of infiltrating M1 and M2 TAMs within tumors. (f, g, h, i) Infiltrating TAMs, CD8+ T cells, M1 and M2 TAM fractions and the M1: M2 ratio; n = 4 for each group. *P ≤ 0.05, **P ≤ 0.01, n.s., not significant.
The combination of miR-21−/− BMDMs and PD-1 antibody conferred superior anti-tumor activity
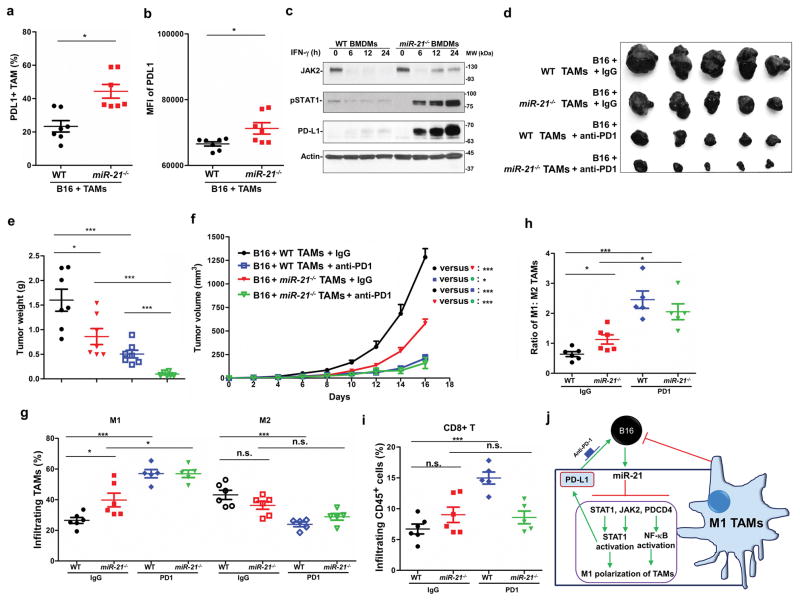
It was reported that STAT1 signaling is a major common regulator of PD-L1 transcription driven by IFN-γ 38. We determined PD-L1 expression in TAMs from the above experiments using flow cytometry and found that more PD-L1-positive TAMs were present in tumors with trained miR-21−/− BMDMs than WT control tumors (Figure 8a). In addition, the mean signal intensity for PD-L1 was stronger in miR-21−/− TAMs compared to the WT control (Figure 8b). We noted that immortalized miR-21−/− BMDMs also expressed higher levels of PD-L1 than WT cells upon prolonged treatment with IFN-γ (Figure 8c).
Figure 8. Combination of miR-21−/− macrophages and PD-1 antibody confers superior anti-tumor efficiency.
(a, b) Flow cytometry analysis of PD-L1 expression in TAMs isolated from tumors as described in Figure 7a. (a) The portion of PD-L1-positive TAMs in total macrophages. (b) Mean fluorescence intensity (MFI) of the PD-L1 signal from TAMs. (c) Immunoblotting analysis of the protein levels of JAK2, pSTAT1, and PD-L1 in immortalized WT and miR-21−/− BMDMs treated with IFN-γ. (d–i) Mice implanted with B16 and macrophages as described in Figure 7a were treated with IgG or antibodies against PD-1. N = 6–7 per group. (d) Representative images of tumors at 16 days post inoculation. (e) Tumor weights. (f) Tumor volumes. Cell populations within tumors were analyzed by flow cytometry analysis; (g) M1 and M2 TAMs; (h) M1:M2 ratio; and (i) CD8+ T cells within tumors. (j) The role of miR-21 in macrophage polarization of TAMs. miR-21 suppresses the expression of STAT1, JAK2, and PDCD4 to inhibit STAT1 and NF-κB activation and prevent TAMs towards M1 polarization. Yet elevated STAT1 activation mediated by miR-21 deficiency promotes PD-L1 expression in TAMs, which can be mitigated by PD-1 antibody blockade. *P ≤ 0.05, ***P ≤ 0.001; n.s., not significant.
To determine whether in vitro-trained miR-21−/− macrophages offer added anti-tumor activity in combination with PD-1 immune checkpoint inhibition, we administered PD-1 antibodies to mice injected with B16 tumor cells and in vitro-trained BMDMs. The combination of anti-PD-1 with in vitro-trained miR-21−/− BMDMs provided the strongest tumor inhibition among 4 treatment groups based on tumor volume and tumor weight (Figure 8d–8f). PD-1 antibody treatment enhanced M1 polarization of TAMs in tumors with both WT and miR-21−/− BMDMs (Figure 8g–8h). In tumors developed from B16 cells in combination with trained WT BMDMs, but not those with trained miR-21−/− BMDMs, PD-1 antibody treatment reduced the number of M2 TAMs and increased CD8+ T cell infiltration (Figure 8g, 8i). These data underscore the potential of miR-21-depleted macrophages alone or in combination with PD-1 immune checkpoint inhibitors in cancer therapy.
Discussion
As one of the most abundant miRNAs, miR-21 function in regulating apoptosis and necroptosis and in the inflammatory response has been thoroughly studied. In this work, we investigated the role of miR-21 in the tumor microenvironment. Our TCGA data analyses reveal that miR-21 levels are negatively correlated with patient survival in 6 patient cohorts. TAM populations often account a large portion of tumor mass, e.g., TAMs comprise as much as 30% to 50% of all cells in human glioblastoma multiforme 39. Thus, in these tumors, the source of miR-21 could be tumor tissues or resident TAMs. We employed the B16 syngeneic mouse xenograft model to determine the role of miR-21 in macrophages during tumor development and found M1 programming in miR-21 deficient TAMs is a contributor to the observed stronger anti-tumor immune response seen in miR-21−/− mice. We found that miR-21 suppresses the expression of STAT1 and, albeit indirectly, JAK2, two key players in M1 polarization. miR-21−/− BMDMs express higher levels of JAK2 and STAT1 than WT cells and when stimulated by IFN-γ, have greater STAT1 phosphorylation. The interplay of miR-21 and STAT3 has been well reported with STAT3 transactivating miR-21 and miR-21 overexpression leading to STAT3 activation through its target genes 40–45. However, this study is the first to demonstrate the role of miR-21 in STAT1 signaling.
In addition, LPS-induced NF-κB activation (p65 phosphorylation) was enhanced in miR-21−/− BMDMs as miR-21 suppresses PDCD4 expression to negatively regulate NF-κB activation, consistent with previous reports 17, 37, 46. Given activation of NF-κB and STAT1 leads to the transcription of M1 genes, these data support that miR-21 down-regulates its target genes (PDCD4 and STAT1) and JAK2 to repress NF-κB and STAT1 signaling and inhibit M1 polarization. In addition, macrophages express higher levels of miR-21 upon co-culture with B16 tumor cells. Therefore, there is a miR-21-mediated tumor: macrophage circuit (Figure 8g): tumor cells stimulate the expression of miR-21 in macrophages, which suppresses the activation of STAT1 and NF-κB by inhibiting STAT1, JAK2, and PDCD4 expression, and prevents anti-tumoral M1 polarization; in the absence of miR-21, both STAT1 and NF-κB are activated in TAMs to drive tumoricidal M1 polarization.
PD-1 blocking antibodies enhance CD8+ T cell-mediated killing of tumor cells by removing T-cell suppressive signals from various tumor-associated cells 47. Because PD-L1 expression is regulated by IFN-γ-mediated STAT1 activation 38, PD-L1 expression is significantly upregulated by miR-21 depletion and subsequent STAT1 activation in cultured BMDMs and in TAMs residing in B16 tumors. The elevation of PD-L1 in miR-21-deficient TAMs could promote an immunosuppressive tumor microenvironment, partially offsetting the immunostimulatory M1 polarization brought by miR-21 depletion (Figure 8g). We found that addition of PD-1 antibodies in the presence of miR-21-deficient macrophages resulted in smaller B16 tumors compared to the regimen of either miR-21-deficient macrophages alone or anti-PD-1 alone. The combination did not increase the number of M1 TAMs or CD8+ T cells more than anti-PD-1 treatment. A possible explanation for the elevated anti-tumor activity of the combination regimen is that it increases the phagocytosis and anti-tumor immunity, but not the number, of TAMs 48.
It is reported that genetic depletion of DICER, a key enzyme processing all hairpin precursor miRNAs into mature miRNA, in TAMs enables tumor eradication by PD-1 checkpoint blockade 26. DICER-deficient TAMs from tumors grown in mice implanted with MC38 mouse colon carcinoma cells also display higher PD-L1 expression than the WT control 26. Given that miR-21-deficient mice are developmentally normal and DICER is essential to mouse earlier development 49, miR-21 inhibition may offer advantages over DICER inhibition in an adjunct cancer therapy with PD-1 checkpoint blockade.
Supplementary Material
Significant Statement.
As one of the most-studied microRNA, miR-21 is overexpressed in virtually all cancers, yet its function in tumor-infiltrating immune cells remains elusive. In this work, we use mouse syngeneic xenograft models to determine whether miR-21 in immune cells contributes to tumorigenesis. We showed that genetic deficiency of miR-21 promotes the polarization of macrophages towards M1-like phenotype, thus conferring host mice with enhanced anti-tumor immunity. By targeting JAK2 and STAT1, miR-21 inhibits the STAT1 signaling pathway, which plays a dominant role in macrophage M1 polarization. Most importantly, miR-21-depleted macrophages enhances PD-1 antibody immunotherapy. These data call for a novel combinatorial cancer treatment with miR-21 inhibition and immune checkpoint blockade to target tumor microenvironment.
Acknowledgments
The authors are grateful to Dr. Cassandra Talerico for editing the manuscript and providing critical comments.
Funding
This study is supported by NIH R01 grants (CA138688 and CA177810) and Natural Science Foundation of China (No. 81528019).
Footnotes
Authors’ contributions
JX, QH, LW, and YL designed the research and performed experiments. All authors contributed to research and data analyses. JX, QH, LW, and YL wrote the manuscript, and all authors approved the final version of the manuscript.
Conflicts of Interest
The authors declare that they have no conflicts of interest.
Supplementary Information accompanies the paper on the Oncogene website (http://www.nature.com/onc).
References
- 1.Medina PP, Nolde M, Slack FJ. OncomiR addiction in an in vivo model of microRNA-21-induced pre-B-cell lymphoma. Nature. 2010;467:86–90. doi: 10.1038/nature09284. [DOI] [PubMed] [Google Scholar]
- 2.Medina PP, Slack FJ. microRNAs and cancer: an overview. Cell Cycle. 2008;7:2485–2492. doi: 10.4161/cc.7.16.6453. [DOI] [PubMed] [Google Scholar]
- 3.Lau NC, Lim LP, Weinstein EG, Bartel DP. An abundant class of tiny RNAs with probable regulatory roles in Caenorhabditis elegans. Science. 2001;294:858–862. doi: 10.1126/science.1065062. [DOI] [PubMed] [Google Scholar]
- 4.Yekta S, Shih IH, Bartel DP. MicroRNA-directed cleavage of HOXB8 mRNA. Science. 2004;304:594–596. doi: 10.1126/science.1097434. [DOI] [PubMed] [Google Scholar]
- 5.Lai EC. Micro RNAs are complementary to 3′ UTR sequence motifs that mediate negative post-transcriptional regulation. Nat Genet. 2002;30:363–364. doi: 10.1038/ng865. [DOI] [PubMed] [Google Scholar]
- 6.Cheng AM, Byrom MW, Shelton J, Ford LP. Antisense inhibition of human miRNAs and indications for an involvement of miRNA in cell growth and apoptosis. Nucleic Acids Res. 2005;33:1290–1297. doi: 10.1093/nar/gki200. [DOI] [PMC free article] [PubMed] [Google Scholar]
- 7.Chen CZ, Li L, Lodish HF, Bartel DP. MicroRNAs modulate hematopoietic lineage differentiation. Science. 2004;303:83–86. doi: 10.1126/science.1091903. [DOI] [PubMed] [Google Scholar]
- 8.Yang CH, Yue J, Pfeffer SR, Handorf CR, Pfeffer LM. MicroRNA miR-21 regulates the metastatic behavior of B16 melanoma cells. J Biol Chem. 2011;286:39172–39178. doi: 10.1074/jbc.M111.285098. [DOI] [PMC free article] [PubMed] [Google Scholar]
- 9.Duchaine TF, Slack FJ. RNA interference and micro RNA-oriented therapy in cancer: rationales, promises, and challenges. Curr Oncol. 2009;16:61–66. doi: 10.3747/co.v16i4.486. [DOI] [PMC free article] [PubMed] [Google Scholar]
- 10.Lagos-Quintana M, Rauhut R, Lendeckel W, Tuschl T. Identification of novel genes coding for small expressed RNAs. Science. 2001;294:853–858. doi: 10.1126/science.1064921. [DOI] [PubMed] [Google Scholar]
- 11.Lagos-Quintana M, Rauhut R, Yalcin A, Meyer J, Lendeckel W, Tuschl T. Identification of tissue-specific microRNAs from mouse. Curr Biol. 2002;12:735–739. doi: 10.1016/s0960-9822(02)00809-6. [DOI] [PubMed] [Google Scholar]
- 12.Lu Z, Liu M, Stribinskis V, Klinge CM, Ramos KS, Colburn NH, et al. MicroRNA-21 promotes cell transformation by targeting the programmed cell death 4 gene. Oncogene. 2008;27:4373–4379. doi: 10.1038/onc.2008.72. [DOI] [PubMed] [Google Scholar]
- 13.Ma X, Kumar M, Choudhury SN, Becker Buscaglia LE, Barker JR, Kanakamedala K, et al. Loss of the miR-21 allele elevates the expression of its target genes and reduces tumorigenesis. Proc Natl Acad Sci U S A. 2011;108:10144–10149. doi: 10.1073/pnas.1103735108. [DOI] [PMC free article] [PubMed] [Google Scholar]
- 14.Ma X, Choudhury SN, Hua X, Dai Z, Li Y. Interaction of the oncogenic miR-21 microRNA and the p53 tumor suppressor pathway. Carcinogenesis. 2013;34:1216–1223. doi: 10.1093/carcin/bgt044. [DOI] [PMC free article] [PubMed] [Google Scholar]
- 15.Ma X, Conklin DJ, Li F, Dai Z, Hua X, Li Y, et al. The oncogenic microRNA miR-21 promotes regulated necrosis in mice. Nat Commun. 2015;6:7151. doi: 10.1038/ncomms8151. [DOI] [PMC free article] [PubMed] [Google Scholar]
- 16.Buscaglia LE, Li Y. Apoptosis and the target genes of microRNA-21. Chin J Cancer. 2011;30:371–380. doi: 10.5732/cjc.011.10132. [DOI] [PMC free article] [PubMed] [Google Scholar]
- 17.Caescu CI, Guo X, Tesfa L, Bhagat TD, Verma A, Zheng D, et al. Colony stimulating factor-1 receptor signaling networks inhibit mouse macrophage inflammatory responses by induction of microRNA-21. Blood. 2015;125:e1–13. doi: 10.1182/blood-2014-10-608000. [DOI] [PMC free article] [PubMed] [Google Scholar]
- 18.Rivera LB, Bergers G. Location, location, location: macrophage positioning within tumors determines pro- or antitumor activity. Cancer Cell. 2013;24:687–689. doi: 10.1016/j.ccr.2013.11.014. [DOI] [PMC free article] [PubMed] [Google Scholar]
- 19.Jahangiri A, De Lay M, Miller LM, Carbonell WS, Hu YL, Lu K, et al. Gene expression profile identifies tyrosine kinase c-Met as a targetable mediator of antiangiogenic therapy resistance. Clin Cancer Res. 2013;19:1773–1783. doi: 10.1158/1078-0432.CCR-12-1281. [DOI] [PMC free article] [PubMed] [Google Scholar]
- 20.Biswas SK, Mantovani A. Macrophage plasticity and interaction with lymphocyte subsets: cancer as a paradigm. Nat Immunol. 2010;11:889–896. doi: 10.1038/ni.1937. [DOI] [PubMed] [Google Scholar]
- 21.Stein M, Keshav S, Harris N, Gordon S. Interleukin 4 potently enhances murine macrophage mannose receptor activity: a marker of alternative immunologic macrophage activation. J Exp Med. 1992;176:287–292. doi: 10.1084/jem.176.1.287. [DOI] [PMC free article] [PubMed] [Google Scholar]
- 22.Haverkamp JM, Smith AM, Weinlich R, Dillon CP, Qualls JE, Neale G, et al. Myeloid-derived suppressor activity is mediated by monocytic lineages maintained by continuous inhibition of extrinsic and intrinsic death pathways. Immunity. 2014;41:947–959. doi: 10.1016/j.immuni.2014.10.020. [DOI] [PMC free article] [PubMed] [Google Scholar]
- 23.Paludan SR. Interleukin-4 and interferon-gamma: the quintessence of a mutual antagonistic relationship. Scand J Immunol. 1998;48:459–468. doi: 10.1046/j.1365-3083.1998.00435.x. [DOI] [PubMed] [Google Scholar]
- 24.Schroder K, Hertzog PJ, Ravasi T, Hume DA. Interferon-gamma: an overview of signals, mechanisms and functions. J Leukoc Biol. 2004;75:163–189. doi: 10.1189/jlb.0603252. [DOI] [PubMed] [Google Scholar]
- 25.Squadrito ML, Pucci F, Magri L, Moi D, Gilfillan GD, Ranghetti A, et al. miR-511-3p modulates genetic programs of tumor-associated macrophages. Cell Rep. 2012;1:141–154. doi: 10.1016/j.celrep.2011.12.005. [DOI] [PubMed] [Google Scholar]
- 26.Baer C, Squadrito ML, Laoui D, Thompson D, Hansen SK, Kiialainen A, et al. Suppression of microRNA activity amplifies IFN-gamma-induced macrophage activation and promotes anti-tumour immunity. Nature cell biology. 2016;18:790–802. doi: 10.1038/ncb3371. [DOI] [PubMed] [Google Scholar]
- 27.Amendola M, Passerini L, Pucci F, Gentner B, Bacchetta R, Naldini L. Regulated and multiple miRNA and siRNA delivery into primary cells by a lentiviral platform. Mol Ther. 2009;17:1039–1052. doi: 10.1038/mt.2009.48. [DOI] [PMC free article] [PubMed] [Google Scholar]
- 28.Zhou W, Ke SQ, Huang Z, Flavahan W, Fang X, Paul J, et al. Periostin secreted by glioblastoma stem cells recruits M2 tumour-associated macrophages and promotes malignant growth. Nature cell biology. 2015;17:170–182. doi: 10.1038/ncb3090. [DOI] [PMC free article] [PubMed] [Google Scholar]
- 29.Rutschman R, Lang R, Hesse M, Ihle JN, Wynn TA, Murray PJ. Cutting edge: Stat6-dependent substrate depletion regulates nitric oxide production. J Immunol. 2001;166:2173–2177. doi: 10.4049/jimmunol.166.4.2173. [DOI] [PubMed] [Google Scholar]
- 30.Taub DD, Cox GW. Murine Th1 and Th2 cell clones differentially regulate macrophage nitric oxide production. J Leukoc Biol. 1995;58:80–89. doi: 10.1002/jlb.58.1.80. [DOI] [PubMed] [Google Scholar]
- 31.Hou J, Schindler U, Henzel WJ, Ho TC, Brasseur M, McKnight SL. An interleukin-4-induced transcription factor: IL-4 Stat. Science. 1994;265:1701–1706. doi: 10.1126/science.8085155. [DOI] [PubMed] [Google Scholar]
- 32.Muller M, Briscoe J, Laxton C, Guschin D, Ziemiecki A, Silvennoinen O, et al. The protein tyrosine kinase JAK1 complements defects in interferon-alpha/beta and -gamma signal transduction. Nature. 1993;366:129–135. doi: 10.1038/366129a0. [DOI] [PubMed] [Google Scholar]
- 33.Anaya J. OncoLnc: Linking TCGA survival data to mRNAs, miRNAs and lncRNAs. PeerJ Computer Science. 2016 Jun 13;:2. [Google Scholar]
- 34.Carissimi C, Carucci N, Colombo T, Piconese S, Azzalin G, Cipolletta E, et al. miR-21 is a negative modulator of T-cell activation. Biochimie. 2014;107(Pt B):319–326. doi: 10.1016/j.biochi.2014.09.021. [DOI] [PubMed] [Google Scholar]
- 35.Wu H, Neilson JR, Kumar P, Manocha M, Shankar P, Sharp PA, et al. miRNA profiling of naive, effector and memory CD8 T cells. PLoS One. 2007;2:e1020. doi: 10.1371/journal.pone.0001020. [DOI] [PMC free article] [PubMed] [Google Scholar]
- 36.Friedman RC, Farh KK-H, Burge CB, Bartel DP. Most mammalian mRNAs are conserved targets of microRNAs. Genome Research. 2009;19:92–105. doi: 10.1101/gr.082701.108. [DOI] [PMC free article] [PubMed] [Google Scholar]
- 37.Sheedy FJ, Palsson-McDermott E, Hennessy EJ, Martin C, O’Leary JJ, Ruan Q, et al. Negative regulation of TLR4 via targeting of the proinflammatory tumor suppressor PDCD4 by the microRNA miR-21. Nature immunology. 2010;11:141–147. doi: 10.1038/ni.1828. [DOI] [PubMed] [Google Scholar]
- 38.Concha-Benavente F, Srivastava RM, Trivedi S, Lei Y, Chandran U, Seethala RR, et al. Identification of the Cell-Intrinsic and -Extrinsic Pathways Downstream of EGFR and IFNgamma That Induce PD-L1 Expression in Head and Neck Cancer. Cancer research. 2016;76:1031–1043. doi: 10.1158/0008-5472.CAN-15-2001. [DOI] [PMC free article] [PubMed] [Google Scholar]
- 39.Charles NA, Holland EC, Gilbertson R, Glass R, Kettenmann H. The brain tumor microenvironment. Glia. 2012;60:502–514. doi: 10.1002/glia.21264. [DOI] [PubMed] [Google Scholar]
- 40.Loffler D, Brocke-Heidrich K, Pfeifer G, Stocsits C, Hackermuller J, Kretzschmar AK, et al. Interleukin-6 dependent survival of multiple myeloma cells involves the Stat3-mediated induction of microRNA-21 through a highly conserved enhancer. Blood. 2007;110:1330–1333. doi: 10.1182/blood-2007-03-081133. [DOI] [PubMed] [Google Scholar]
- 41.Liu Y, Luo F, Wang B, Li H, Xu Y, Liu X, et al. STAT3-regulated exosomal miR-21 promotes angiogenesis and is involved in neoplastic processes of transformed human bronchial epithelial cells. Cancer letters. 2016;370:125–135. doi: 10.1016/j.canlet.2015.10.011. [DOI] [PubMed] [Google Scholar]
- 42.Li L, Zhang J, Diao W, Wang D, Wei Y, Zhang CY, et al. MicroRNA-155 and MicroRNA-21 promote the expansion of functional myeloid-derived suppressor cells. Journal of immunology. 2014;192:1034–1043. doi: 10.4049/jimmunol.1301309. [DOI] [PubMed] [Google Scholar]
- 43.Pratheeshkumar P, Son YO, Divya SP, Wang L, Zhang Z, Shi X. Oncogenic transformation of human lung bronchial epithelial cells induced by arsenic involves ROS-dependent activation of STAT3-miR-21-PDCD4 mechanism. Scientific reports. 2016;6:37227. doi: 10.1038/srep37227. [DOI] [PMC free article] [PubMed] [Google Scholar] [Retracted]
- 44.Venturutti L, Romero LV, Urtreger AJ, Chervo MF, Cordo Russo RI, Mercogliano MF, et al. Stat3 regulates ErbB-2 expression and co-opts ErbB-2 nuclear function to induce miR-21 expression, PDCD4 downregulation and breast cancer metastasis. Oncogene. 2016;35:2208–2222. doi: 10.1038/onc.2015.281. [DOI] [PubMed] [Google Scholar]
- 45.Iliopoulos D, Jaeger SA, Hirsch HA, Bulyk ML, Struhl K. STAT3 activation of miR-21 and miR-181b-1 via PTEN and CYLD are part of the epigenetic switch linking inflammation to cancer. Molecular cell. 2010;39:493–506. doi: 10.1016/j.molcel.2010.07.023. [DOI] [PMC free article] [PubMed] [Google Scholar]
- 46.Ma X, Becker Buscaglia LE, Barker JR, Li Y. MicroRNAs in NF-kappaB signaling. J Mol Cell Biol. 2011;3:159–166. doi: 10.1093/jmcb/mjr007. [DOI] [PMC free article] [PubMed] [Google Scholar]
- 47.Topalian SL, Hodi FS, Brahmer JR, Gettinger SN, Smith DC, McDermott DF, et al. Safety, activity, and immune correlates of anti-PD-1 antibody in cancer. The New England journal of medicine. 2012;366:2443–2454. doi: 10.1056/NEJMoa1200690. [DOI] [PMC free article] [PubMed] [Google Scholar]
- 48.Gordon SR, Maute RL, Dulken BW, Hutter G, George BM, McCracken MN, et al. PD-1 expression by tumour-associated macrophages inhibits phagocytosis and tumour immunity. Nature. 2017;545:495–499. doi: 10.1038/nature22396. [DOI] [PMC free article] [PubMed] [Google Scholar]
- 49.Bernstein E, Kim SY, Carmell MA, Murchison EP, Alcorn H, Li MZ, et al. Dicer is essential for mouse development. Nat Genet. 2003;35:215–217. doi: 10.1038/ng1253. [DOI] [PubMed] [Google Scholar]
Associated Data
This section collects any data citations, data availability statements, or supplementary materials included in this article.


