Abstract
Non-muscle caldesmon (l-CaD) is involved in the regulation of actin cytoskeletal remodeling in the podosome formation, but its function in osteoclastogenesis remains to be determined. In this study, RANKL-induced differentiation of RAW264.7 murine macrophages to osteoclast-like cells (OCs) was used as a model to determine the physiological role of l-CaD and its phosphorylation in osteoclastogenesis. Upon RANKL treatment, RAW264.7 cells undergo cell-cell fusion into multinucleate and TRAP-positive large OCs with a concomitant increase of l-CaD expression. Using gain- and loss-of-function in OC precursor cells followed by RANKL induction, we showed that the expression of l-CaD in response to RANKL activation is an important event for osteoclastogenesis and bone resorption. To determine the effect of l-CaD phosphorylation in osteoclastogenesis, three decoy peptides of l-CaD were used with, respectively, Ser-to-Ala mutations at the Erk- and Pak1-mediated phosphorylation sites, and Ser-to-Asp mutation at the Erk-mediated phosphorylation sites. Both the former two peptides competed with the C-terminal segment of l-CaD for F-actin binding and accelerated formation of podosome-like structures in RANKL-induced OCs, while the third peptide did not significantly affect the F-actin binding of l-CaD and decreased the formation of podosome-like structures in OCs. With the experiments using dephosphorylated and phosphorylated l-CaD mutants, we further showed that dephosphorylated l-CaD mutant facilitated RANKL-induced TRAP activity with an increased cell fusion index, whereas phosphorylated l-CaD decreased the TRAP activity and cell fusion. Our findings suggested that both the level of l-CaD expression and the extent of l-CaD phosphorylation play a role in RANKL-induced osteoclast differentiation.
Keywords: Non-muscle caldesmon (l-CaD), podosome, osteoclastogenesis, RANKL, phosphomimetic peptides, TRAP activity
Introduction
Bone mass is normally balanced between the bone resorption by osteoclasts and bone formation by osteoblasts (OBs) in order to maintain bone strength and integrity (Zaidi M. 2007). Imbalance favoring bone resorption is known to lead to bone diseases such as osteoporosis (Frenkel et al., 2015), rheumatoid arthritis (Rodan and Martin, 2000) and bone metastases (Chen et al., 2013), rendering bones fragile and easy to break. Importantly, osteoporosis becomes a healthcare concern as human lifespan increases (Nilsson, 2015). A complete understanding of the mechanisms controlling bone resorption and formation could provide potential targets for the treatment of bone diseases. Because osteoclasts are the key players for bone resorption, therefore they are one of the main targets for treatment of osteoporosis.
In a recent study Vives et al. (2011) showed that Dock5, the guanine nucleotide exchange factor for Rac, is required for osteoclast formation at sealing zone, providing evidence in support of the notion that the Rac GTPase signaling events are critical for osteoclastogenesis. Based on this idea, these authors further found that the Dock5 inhibitor, C21, could be used as a novel therapeutic agent for fighting osteolytic diseases while preserving OB functions (Vives et al., 2015). Of note, the Rac signaling pathway could also activate the downstream target Pak1, and result in phosphorylation of its substrates including l-CaD that is involved in the dynamic remodeling of the actin cytoskeleton (Morita et al., 2007; Eppinga et al., 2006). However, the question whether l-CaD phosphorylation plays a role in osteoclastogenesis has never been addressed.
CaD is an actin-binding protein that also binds Tm, myosin, and calmodulin (CaM) binding protein (Zhan et al., 1991; Sobue et al., 1981). Two isoforms of CaD are produced from a single gene by alternative splicing; the smooth muscle form h-CaD, with a high molecular weight of 130-140 kD, and the non-muscle l-CaD, of 60-90 kD (Mayanagi and Sobue, 2011; Humphrey et al., 1992). The difference between h- and l-CaD is a highly charged repeating sequence, corresponding to a 35 nm-long single helical region that separates the N-terminal domain from the C-terminal domain (Wang 2008). The C-terminal domains are responsible for actin binding and inhibition of myosin ATPase activity (Gorenne et al., 2004). Binding of Ca2+/CaM or phosphorylation of sites (Erk and Pak) between the two C-terminal actin binding domains can reverse some of the inhibitory actions of CaD (Hamden et al., 2010). The N-terminal half of the molecule has been shown to bind myosin and tether myosin to actin in conjunction with C-terminal actin binding domains of CaD (Lee et al., 2000).
Both h- and l-CaD are phosphorylated by several upstream kinases, including PKC, CamKII, cdc2 kinase (Pak site) and Erk1/2 (Erk site) MAPKs (Mayanagi and Sobue, 2011; Wang 2008; Hai and Gu, 2006; Huang and Wang, 2006; Kordowska et al., 2006; Sobue et al., 1981). Phosphorylation by either of these kinases reverses the inhibitory effects of CaD (Hamden et al., 2010). More importantly, both Pak- and Erk- mediated CaD phosphorylation has been found to modulate its action in podosome dynamics (Morita et al., 2007). The phosphorylation sites on l-CaD for both enzymes are all in the C-terminal region near the actin-binding sites (Hamden et al., 2010; D’Angelo et al., 1999). It is likely that upon phosphorylation by either Erk or Pak, CaD binding to actin is weakened and allows severing proteins to disassemble the actin cytoskeleton, hence freeing l-CaD to move to the cell periphery where the cytoskeleton is reassembling (Kordowska et al., 2006.). Although CaD, as well as other actin binding proteins (ABPs) are known to participate in the dynamic assembly of the podosome in several types of invasive and motile cells (Gu et al., 2007; Eves et al., 2006; Tanaka et al., 1993), little is known about the role of l-CaD and its phosphorylation in the control of the podosome formation in osteoclastogenesis. This study aims to address this issue.
Materials and Methods
Chemicals and reagents
RAW264.7 cell lines were purchased from American Type Culture Collection (ATCC, CRL-1446) (Rockville, MD). All reagents used were ACS or MB grade. sRANKL mouse was purchased from ProSpec (East Brunswick, NJ) or R&D Systems (Minneapolis, MN), mCSF recombinant mouse protein from Invitrogen (Waltham, MA).
Cell culture and RANKL treatment
RAW264.7 cells in regular Dulbecco’s modified essential medium (DMEM, Gibco) supplemented with antibiotics and 10% fetal bovine serum (FBS) were cultured in a 5% CO2 incubator at 37°C. For differentiation, cells were cultured in minimal essential medium alpha modification (α-MEM, Gibco) with 50 ng/ml RANKL with or without 20 ng/ml mCSF for 5 or 6 days, changing with the fresh RANKL-containing differentiation medium at day 3. OC differentiation was assessed by tartrate resistant alkaline phosphatase (TRAP) activity using the Leukocyte Acid Phosphatase kit (Sigma). Cells were fixed and stained for TRAP activity according to the manufacturer’s instructions.
Immunoblotting
Protein contents of total cell lysates from RANKL treated or untreated cells were analyzed by western blot. Samples with same amounts of protein were separated by sodium dodecyl sulfate-polyacrylamide gel electrophoresis, then the proteins were electro-transferred onto polyvinylidene difluoride membranes. The primary antibodies used were: rabbit polyclonal anti-tropomyosin 4 (Chemicon AB5449; 1:1000 dilution), rabbit polyclonal anti-caldesmon (Sigma SAB4503189; 1:500 dilution), rabbit polyclonal anti-caldesmon (Santa Cruz sc-15374; 1:500 dilution) rabbit polyclonal anti-p-caldesmon (Ser789) (Santa Cruz sc-12931-R, 1:500), mouse monoclonal anti-human vinculin (7F9) (Santa Cruz sc-73614, 1:1000 dilution), mouse monoclonal anti-β-actin (Sigma, 1: 10000 dilution), and rabbit polyclonal anti-GAPDH (Sigma SAB4300645; 1:5000). The secondary antibodies used (1:5000 dilution) were goat anti-rabbit IgG (Sigma), and goat anti-mouse IgG (Sigma).
RNA extraction, semi-quantitative RT-PCR, real-time qPCR, comparative CT method for quantification of mRNA expression
The procedures for RNA extraction, semi-quantitative reverse transcription polymerization chain reaction (semi-quantitative RT-PCR), and qPCR were described previously (Peng and Liou, 2012; Hsu and Liou, 2011; Shieh et al., 2010). SYBR Green dye was used as a real-time reporter of the presence of double-stranded DNA. The following primers specific for murine osteoclastogenic markers (i.e. TRAP, c-fos, nuclear factor of activated T cells (NFATc1), cathepsin-K (CTSK), β3-integrin), for murine l-CaD were synthesized: TRAP, forward 5′-AGCAGCCAAGGAGGACTACGTT-3′ and reverse 5′-TCGTTGATGTCGCACAGAGG-3′; c-fos, forward 5′-CGGGTTTCAACGCCGACTA-3′ and reverse 5′-TTGGCACTAGAGACGGACAGA-3′; NFATc1, forward 5′-GGAGCGGAGAAACTTTGCG-3′ and reverse 5′-GTGACACTAGGGGACACATAACT-3′; CTSK, forward 5′-GAAGAAGACTCACCAGAAGCAG-3′ and reverse 5′-TCCAGGTTATGGGCAGAGATT-3′; β3 integrin, forward 5′-CCTTTGCCCAGCCTTCCA-3′ and reverse 5′-GTCCCCACAGTTACATTG-3′; l-CaD, forward 5′- TTGAAGGTGACGAGGAGGCT-3′ and reverse 5′-GTCCCCACAGTTACATTG-3′. GAPDH, an internal control, had the forward primer 5′-CATGGCCTTCCGTGTTCCTA-3′ and the reverse primer 5′-CCTGCTTCACCACCTTCTTGA-3′, respectively. The human l-CaD had the forward primer 5′-CTGGCTTGAAGGTAGGGGTTT-3′ and the reverse primer 5′-TTGGGAGGTGACTTGTTT-3′, respectively. The specificity of qPCR amplicon was verified by a single distinct peak obtained during the melting curve analysis of the SYBR Green-based qPCR system with denaturation for 15 sec at 95°C, annealing for 30 sec at 60°C, and denaturation for 15 sec at 95°C. All qPCR reactions were performed in an Applied Biosystems 7300 Real-Time PCR System (Applied Biosystems Inc, Foster City, CA). SYBR® Green ERTM qPCR SuperMix for ABI PRISM® was purchased from invitrogen (Invitrogen Life Sciences; Carlsbad, CA). The reaction mix was denatured at 95°C for 10 min before the first cycle. The thermal cycle profile was: (1) denaturation for 15 sec at 95°C, (2) annealing for 30 sec at 60°C and (3) extension for 30 sec at 60°C. A total of 40 cycles was used for amplification.
Comparative CT method was used for data obtained from the qPCR system, where the expression of the l-CaD as well as other osteoclastogenic genes was normalized to that of β-actin in each reaction. Differences between median ΔCT of test group andΔCT of each sample were expressed as ΔΔCT. The fold difference (2ΔΔCT) of gene expression was calculated for each sample.
Preparing synthetic decoy phosphomimetic peptides
We prepared three decoy peptides with Ser-to-Ala mutations at the Erk-mediated phosphorylation site (Pep1) and at the Pak-mediated phosphorylation site (Pep2) of l-CaD, and a peptide with Ser-to-Asp mutations (Pep3) to mimic the Erk-mediated phosphorylation as a control (Fig. 6A). These decoy peptides were fluorescently tagged fluorescein isothiocyanate (FITC) at the Lys near the N-terminus and also conjugated with a 12-residue retroviral TAT peptide (GYGRKKRRQRRR-C) through a disulfide linkage to facilitate cell delivery. The TAT peptide derived from the transactivator of transcription (TAT) of human immunodeficiency virus is one of the cell-penetrating peptides containing a highly basic 11 amino acid sequence (-YGRKKRRQRRR-) for rapid cell entry (Becker-Hapak et al., 2001; Frankel and Pabo, 1988). This Tat segment fused with l-CaD decoy peptide by a disulfide bond was cleaved off once the peptide enters the cell due to the reducing intracellular environment (Lee et al., 2008; Chen et al., 2001). Incubation of these l-CaD decoy peptides with RAW264.7 cells for 48 hr achieved high loading efficiency as evidenced by the incorporation of FITC fluorescence (Fig. 6B). For Pep1 and Pep2, they compete with the C-terminal fragment of CaD (H32K) for binding to F-actin in co-sedimentation assays, while Pep3 exerts a limited effect on the H32K binding to F-actin (Fig. 6A).
Fig. 6. Effects of decoy peptides on the l-CaD binding to F-actin.
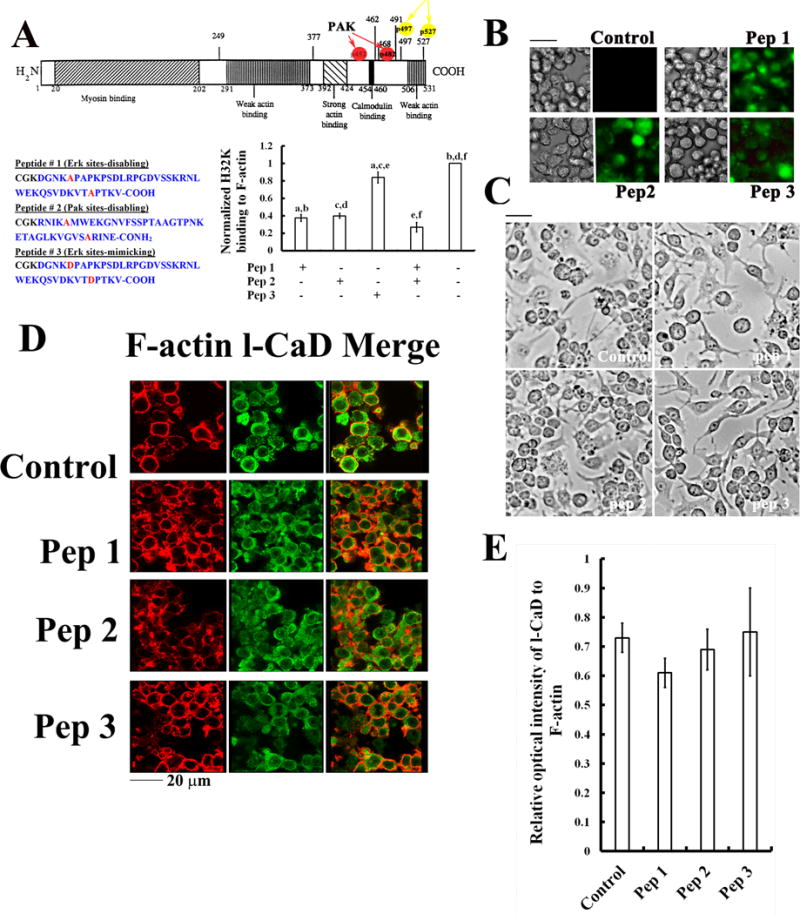
(A) Illustrated domain structures of l-CaD containing the myosin binding sites in the N-terminal domain, and the (Pak- and Erk-) phosphorylation sites in its C-terminal domain containing the Ca2+/Calmodulin site and actin-binding sites (top); the sequences for decoy peptides with Ser-to Ala mutations at the Erk-mediated (Pep1) and Pak-mediated (Pep2) phosphorylation sites of l-CaD, and a peptide (Pep3) with Ser-to-Asp mutation at the Erk-mediated phosphorylation sites to mimic phosphorylated l-CaD were shown on the bottom left panel; their competition with the C-terminal fragment of CaD (H32K) for binding to F-actin (pellet fractions in co-sedimentation assays) was shown on the bottom right panel. The values are the mean ± SEM (n=6), with a to f indicating a significant difference (P<0.05) between each group. (B) Phase contrast and fluorescence micrographs showing the efficient loading of peptides into the cells after 48 hr incubation. (C) Phase contrast micrographs showing no significant effect on morphological changes and cell growth of cells with or without loading the l-CaD decoy peptides. (D) Fluorescence micrographs showing no significant effect on the relative distribution of F-actin (red) and total l-CaD (green) and the merged images on the right for cells with or without loading the l-CaD decoy peptides. (E) Quantitative analyses of the total l-CaD/F-actin labeling fluorescence ratio in cells with or without loading the l-CaD decoy peptides. The values are the mean ± SEM (n=6). There is no significant difference among experimental groups.
Transfection and overexpression of GFP fusion proteins
Full-length human l-CaD (Gene Bank#M64110) subcloned into the mammalian expression vector pEGFPC1(Clontech) as well as site-directed mutagenesis was performed as previously described (Jiang et al., 2010; Gu et al., 2006). The two PAK sites Ser452 and Ser482 were converted to Asp (EGFP-D1D2) while the two Erk sites Ser497 and Ser527 to Ala (EGFP-A3A4). RAW264.7 cells were cultured in a 6-well plate containing culture medium without antibiotics at a density of 70-80% confluence. Both the lipofectamine and DNA constructs were diluted with transfection medium without serum and incubated for 5 minutes. Subsequently, the diluted DNA constructs and diluted lipofectamine were mixed at a ratio from 1:1 to 1:2 of DNA to lipofectamine. After gentle shaking and incubation for 20 min, the DNA-lipofectamine complexes were added to each well and incubated in a CO2 incubator at 37°C for 6 hr. The culture medium was replaced with serum-containing DMEM.
Silencing of CaD expression by small interfering RNAs (siRNAs)
Sixty to eighty percent confluent cells were transfected with either the scrambled control siRNAs (sc-36869) or siRNAs directed to mouse CaD (sc-29881) according to the manufacturer’s guidelines (Santa Cruz Biotechnology). The cells received 10 μM siRNA were incubated for 6 hr at 37°C in a CO2 incubator. At 24 or 48 hr after transfection, total RNA was extracted for reverse transcription and qPCR measurements to confirm the downregulation of CaD expression. After siRNA exposure for 48 hr, western blot analysis was performed to verify the attenuation of protein content.
Pit formation assay
RAW264.7 cells (5,000 cells per well) were transferred into each well of a Corning Osteo Assay Stripwell plate (Corning Cat. No.3989) to begin the differentiation process. Plates were incubated at 37°C in a humidified atmosphere of 5% CO2 for 7 days with a medium change on day 3 or 4. To analyse the surface for pit formation, the media were aspirated from the wells on day 7, and 100 μL of 10% bleach solution (HOCl) was added. Cells were incubated with the bleach solution for 5 mi at room temperature. The wells were washed twice with distilled water and allowed to dry at room temperature for 3 to 5 hr. Individual pits or multiple pit clusters were observed using a microscope at 100x magnification.
Immunocytochemistry, fluorescence staining, and laser-scanning confocal microscopy
RAW264.7 cells (2*104) were seeded on a glass coverslip in each well of a 12-well plate and cultured in DMEM-10% FBS for 24 hr in a CO2 incubator at 37°C; after this time period, the medium was added with 50 ng/ml RANKL. On days 5 or 6, the cells were fixed in 4% paraformaldehyde for 15 min, permeabilized with 0.1% Triton X-100 for 1 min, blocked with 2% bovine serum albumin for 30 min (all at room temperature), and then incubated with primary antibodies in phosphate buffer saline (PBS). They were then incubated for 30 min at room temperature with secondary antibody (1: 700 in PBS) conjugated to a fluorescence probe (Alexa Fluor® 488), then F-actin was labelled by incubation for 5 min at room temperature with Alexa Fluor® 568 phalloidin (1: 1000) (Molecular Probes, Invitrogen Life Sciences; Carlsbad, CA) and the nucleus labelled with DAPI (1: 1000) (Molecular Probes, Invitrogen Life Sciences; Carlsbad, CA) for 1 min. Immunofluorescence images were captured on a Leica TCS MP5 confocal microscope controlled by the manufacturer’s Leica Confocal Software package LAS AF version 2.63 using a 63 × 1.4 Plan Apochromatic oil-immersion objective (Leica Microsystems, Exton, PA). Different optical sections from the bottom to the top with an increase of 0.1 μm per section were obtained for image analysis. The raw fluorescence images without further processing were used for data analysis. Fluorescence intensity measurements and three-dimensional image reconstructions were performed in Image J software version 1.50a (NIH, USA).
Statistics
Quantitative values are expressed as the mean ± SEM. Comparisons were performed by one-way ANOVA followed by Scheffe method for post hoc test on statistical significance between more than two groups (IBM SPSS software). For comparisons between two groups a Student’s t-test was used. Differences were considered to be statistically significant with P values less than 0.05.
Results
RANKL-induced osteoclastogenesis associated with increased l-CaD expression in OC cells
During RANKL-induced differentiation, RAW264.7 cells started to undergo the characteristic morphological changes at day 3 (Fig. 1A) with increasing cell-cell fusion into large and multinucleate TRAP-positive OC cells (Fig. 1B-E). With further increasing the incubation to day 5, a greater increase in the TRAP activity along with the cell fusion index was seen (Fig. 1B-E).
Fig. 1. RANKL-induced osteoclastogenesis.
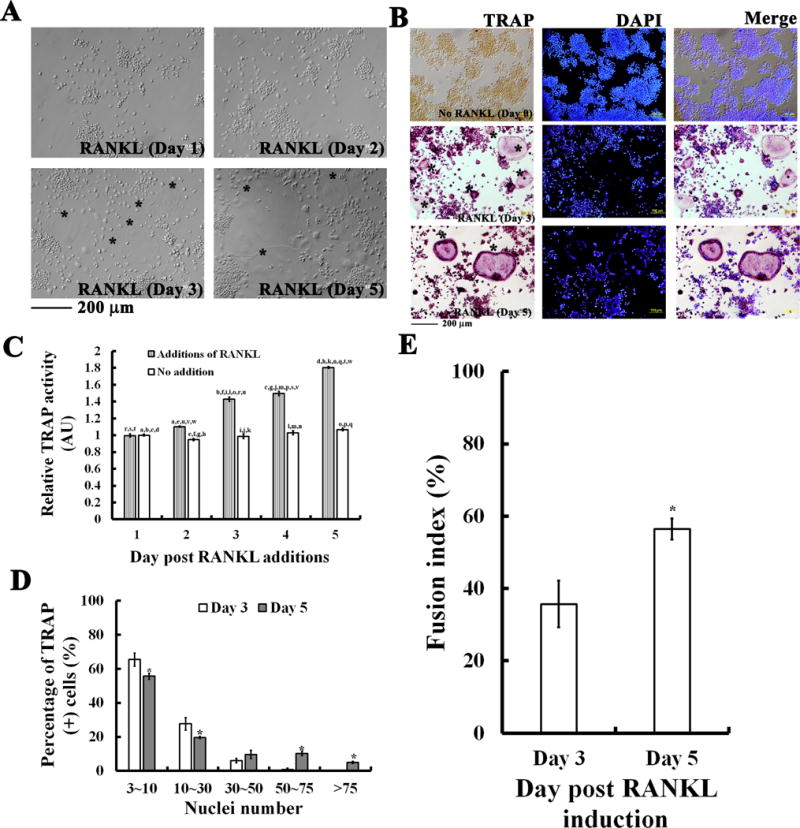
(A) RAW264.7 cells cultured with 50 ng/ml RANKL for 1, 2, 3, and 5 days induced morphological changes to large and multinucleate osteoclast-like cells (OCs). (B) Characteristic TRAP-staining in cells with or without RANKL induction for 3 and 5 days. Multinucleate OCs (MNCs) (as labeled with *) were observed by TRAP and nuclei staining with DAPI. Calibration bar in (A) and (B) as indicated, respectively. (C) Quantitative analyses for RANKL-induced TRAP activity for days as indicated. TRAP activity was determined by measuring the secreted TRAP in the cultured medium for each day with a microplate reader at absorption wavelength of 405 nm. Quantitative analyses showing increases in (D) TRAP-positive (+) multinucleate cells (MNCs) and in (E) cell fusion index in RANKL-induced RAW264.7 cells for 3 and 5 days. Fusion index was determined by measuring the portion of clustered nuclei to total nuclei in cells by using Image-Pro Plus computerized software. In C, D, and E, the values are the mean ± SEM (n=6). In C, one-way ANOVA was used to compare the statistical difference among groups, while in D and E a Student’s t-test was used, a to w indicating a significant difference (P<0.05) between each group in C, and asterisks (*) indicating a significant difference (P<0.05) compared to the RANKL treatment for 3 days in D and E.
In addition, l-CaD mRNA expression was found to significantly increase (~10-15 fold) in association with increased osteoclastogenic gene expressions (i.e., TRAP, CTSK, c-fos, and c-NFATc1) during RANKL-induced osteoclastogenesis (Fig. 2A). This result might suggest that the increased expression of l-CaD in response to RANKL activation plays a role for the events in osteoclastogenesis. Western blot analyses using a polyclonal anti-l-CaD antibody (H-300: sc-15374) showed increased l-CaD protein by RANKL induction for 3 and 5 days; while with another antibody recognizing Ser789 (one of the Erk-mediated phosphorylation sites) phosphorylation of l-CaD showing no significant effect upon RANKL induction (Fig. 2B), suggesting that RANKL induced osteoclastogenesis increases expression of l-CaD mRNA and protein level but no changes in the steady state levels of Erk-mediated l-CaD phosphorylation. Using fluorescence confocal microscopy (Fig. 2C), the relative fluorescence intensity of labeled l-CaD and phosphorylated l-CaD to that of labeled F-actin, respectively, for RAW264.7 cells before RANKL induction was not significantly different (Fig. 2D). However, RANKL induction significantly increased the relative intensity for l-CaD but not for phosphorylated l-CaD (Fig. 2D). This is consistent with the observation in western analyses that there was an increase in the total amount of l-CaD but not steady-state level of phosphorylated l-CaD in RANKL induced OC cells (Fig. 2B).
Fig. 2. The increased l-CaD expression in osteoclastogenesis.
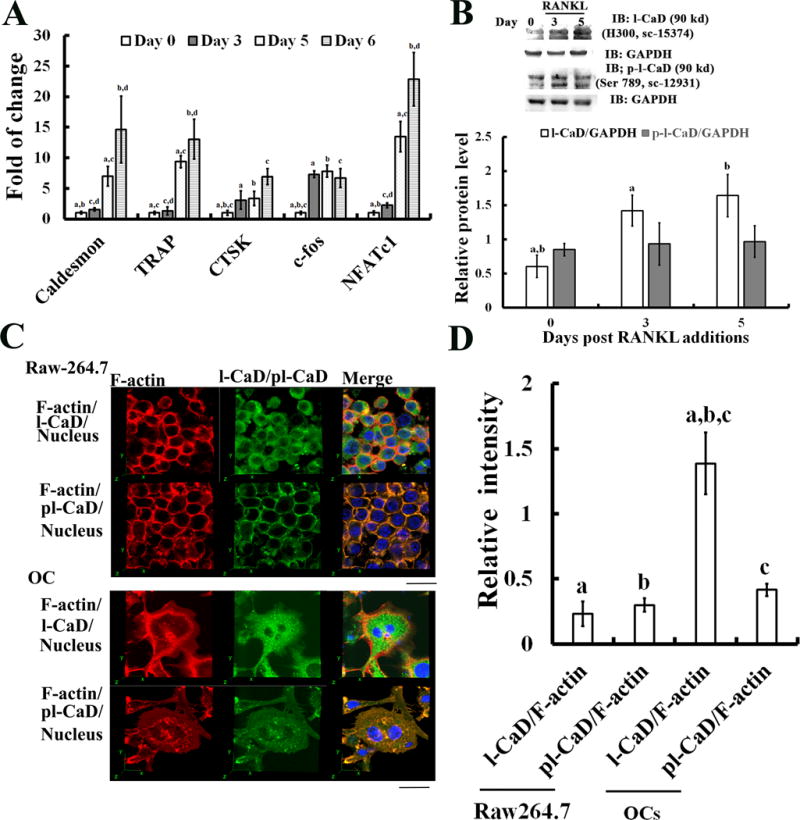
(A) Real time quantitative qPCR analyses showing the changes of mRNA expression for l-CaD, TRAP, CTSK, c-fos, and NFATc1 during RANKL induction for 0, 3, 5, 6 days. Control mRNA (no RANKL addition, day 0) was used to obtain the normalized ratio (relative fold change expression) for samples with RANKL induction for 3, 5, 6 days. (B) Western blots (top) and quantitative analyses (bottom) showing the levels of total l-CaD (~90 kDa) and phosphorylated l-CaD (~90 kDa) in RAW264.7 cells incubated without RANKL (day 0), and with 50 ng/ml RANKL induction for 3 days, and 5 days, respectively. GAPDH used as the internal control for data analysis. (C) Laser scanning confocal microscopy showing the cellular distribution of total l-CaD/phosphorylated l-CaD (green) and F-actin (red) and the nucleus (blue), and merged fluorescence images on the right in RAW264.7 cells with (bottom, OC) or without (top) 50 ng/ml RANKL-induction for 5 days. Calibration bar 20 μm as indicated. (D) Quantitative analysis of the percentage of fluorescence intensity for total l-CaD/phosphorylated l-CaD and F-actin labeling in RAW264.7 cells and OCs. The raw fluorescence image was measured for the total l-CaD/phosphorylated l-CaD and F-actin labeled fluorescence of the cell using Image-Pro Plus computerized software. In A, B, and D, the values are the mean ± SEM (n=6), a to d indicating a significant difference (P<0.05) between each group.
Effect of gain- and loss- of l-CaD expression on RANKL-induced osteoclastogenesis
To determine the functional role of the increased l-CaD expression in RANKL induced OC differentiation, RAW264.7 cells transfected with fusion DNA constructs containing EGFP and l-CaD and followed by RANKL induction were investigated (Fig. 3). In comparison with untransfected OC controls, overexpression of l-CaD (33% increases) confirmed by qPCR (Fig. 3A), also significantly caused increases of the osteoclastogenic gene expressions for NFATc1, c-fos, CTSK, and beta 3 integrin (Fig. 3B). Analyses with TRAP staining (Fig. 3C) indicated that l-CaD overexpression promotes OC cell differentiation with an increased TRAP activity. In addition, l-CaD overexpression also increased the number of larger OC cells with more than 20 nuclei (L) with concomitant decreases in the number of medium-sized cells (M) with 10-20 nuclei as well as small-sized cells (S) with 3-10 nuclei (Fig. 3D). This increase in larger nuclei number in differentiating OCs was accompanied by a higher degree of cell-cell fusion in l-CaD overexpressed cells (Fusion index ~80%), as compared to EGFP control cells (Fusion index ~50%) (Fig. 3E). This is consistent with the hypothesis that increases in l-CaD expression facilitates the cell-cell fusion in OC cell differentiation. To evaluate OC differentiation and function, the ability to resorb mineralized matrix and form resorption pits on the surface was examined for cells with or without l-CaD overexpression before and after RANKL induction (Fig. 3F). There is a two-fold increase in the resorption pit area for the cells with l-CaD overexpression as compared to the control cells with RANKL induction (Fig. 3F).
Fig. 3. Overexpression of l-CaD accelerates RANKL-induced OC cell differentiation and resorption function.
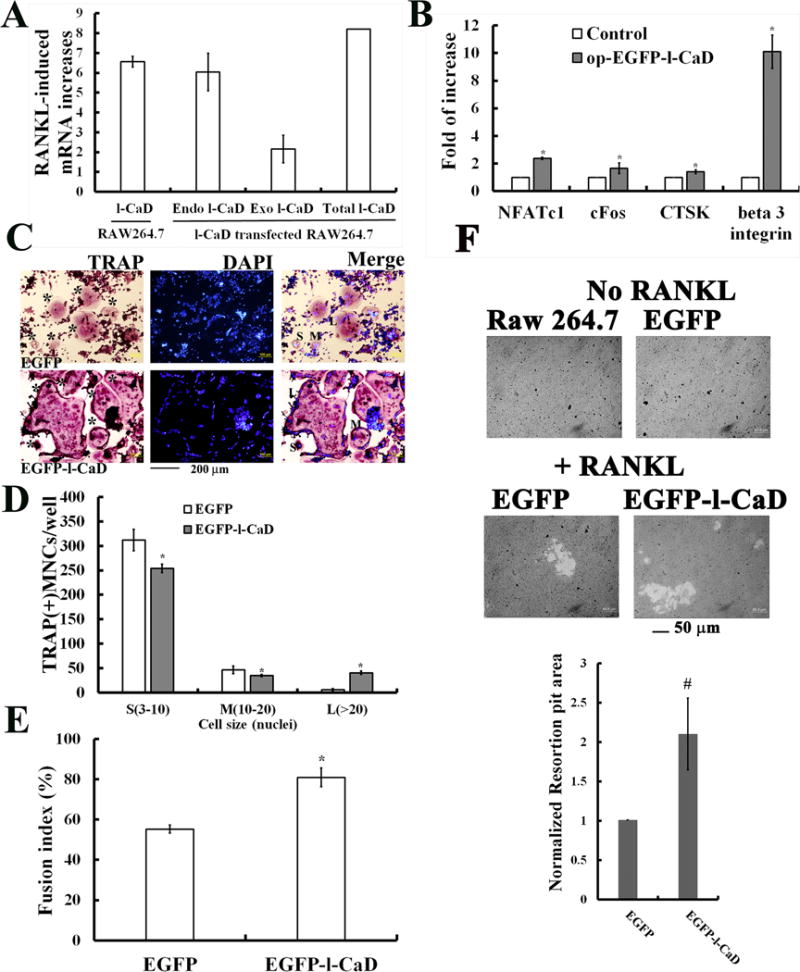
(A) Real time qPCR data analyses showing the significant increases of l-CaD in the RANKL-induced RAW264.7 cells, as well as increases of both endogenous and exogenous l-CaD (total l-CaD expression) in pEGFP-l-CaD transfected cells. (B) Real time qPCR data analyses showing the significant increases of other osteogenic genes, e.g., NFATc1, cFos, CTSK, and β3 integrin for RANKL-induced RAW264.7 cells with EGFP-l-CaD transfection (op-EGFP-l-CaD), as compared to control cells without transfection. (C) Analyses with TRAP staining, nuclei staining with DAPI, and merged images in RANKL-induced RAW264.7 cells with EGFP (top) or EGFP-l-CaD (bottom) transfection. * indicating TRAP-positive multinucleate OCs (MNCs). Labels of S, M, L indicating MNCs with nuclei number of 3-10, 10-20, and >20, respectively. Calibration bar as indicated. (D) Quantitative analyses for TRAP-positive MNCs/well in RANKL-induced RAW264.7 cells with EGFP or EGFP-l-CaD transfection. The OC cells with nuclei numbers as indicated. (E) Quantitative analyses for the cell-cell fusion index in RANKL-induced RAW264.7 cells with EGFP or EGFP-l-CaD transfection. The cell fusion index defining the portion of clustered nuclei to total nuclei was measured by TRAP or DAPI nuclear staining in (C). (E) Resorption pit assay showing the increase in resorption pit area for RANKL-induced cells with l-CaD overexpression (Top). Quantitative analyses for resorption pit area in RANKL-induced Raw264.7 cells with EGFP or EGFP-l-CaD transfection (Bottom). In A, B, D, E, and F, the values are the mean ± SEM (n=6), with * indicating a significant difference compared to cells transfected with no transfection or EGFP transfection control.
On the other hand, si l-CaD in OC precursor cells decreased 33% of l-CaD protein levels (Fig. 4A) associated with 95% decrease of l-CaD mRNA expression in RANKL-induced OCs (Fig. 4B). Concomitantly, si l-CaD also caused 40%, 60%, and 88% decreases of mRNA expressions for NFAT-c1, TRAP, and CTSK, in RANKL-induced OCs, respectively (Fig. 4B). In addition, si l-CaD decreased the number of larger OC cells with more than 30 nuclei (L) with concomitant increases in the number of medium-sized cells (M) with 10-30 nuclei as well as small-sized cells (S) with 3-10 nuclei (Fig. 3C-D). This decrease in larger nuclei number in differentiating OCs was accompanied by a 30% decrease of cell-cell fusion in si l-CaD OCs (Fusion index ~27%), as compared to si Ctr cells (Fusion index ~57%) (Fig. 4E). In addition, gene silencing against l-CaD (si l-CaD) in cells caused a 60% decrease in bone resorption as compared to the control cells (siCtr) after RANKL induction (Fig. 4 F). Clearly, the regulation of l-CaD expression is an important event for osteoclastogenesis.
Fig. 4. si-l-CaD attenuates RANKL- induced OC cell differentiation.
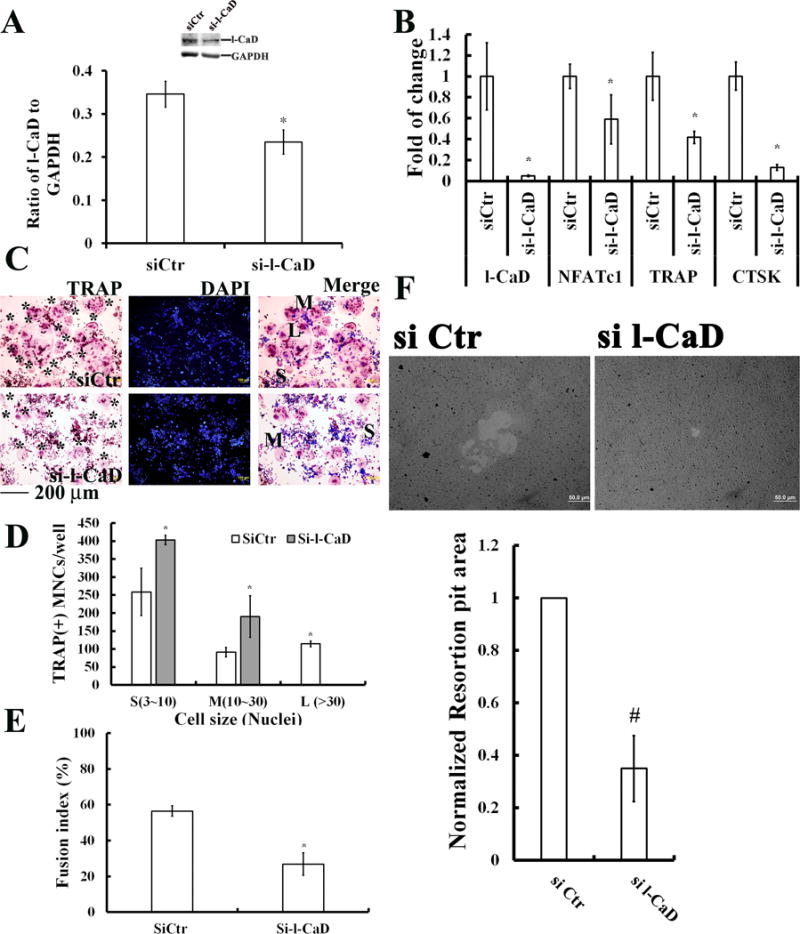
(A) Western blot (left) with quantitative analyses (right) showing significant reduction of l-CaD protein level by siRNA against l-CaD. (B) Real time qPCR data analyses showing the significant decreases of l-CaD and other osteogenic genes, e.g., NFATc1, TRAP, and CTSK for RANKL-induced RAW264.7 cells with siRNA against l-CaD, as compared to si control (siCtr). (C) Analyses with TRAP staining, nuclei staining with DAPI, and merged images in RANKL-induced RAW264.7 cells with siCtr (top) or si-l-CaD (bottom). * indicating TRAP-positive multinucleate OCs (MNCs). Labels of S, M, L indicating MNCs with nuclei number of 3-10, 10-30, and >30, respectively. Calibration bar as indicated. (D) Quantitative analyses for TRAP-positive multinucleate OCs (MNCs)/well, and (E) the cell fusion index in RANKL-induced RAW264.7 cells with siCtr or si-l-CaD. (F) Resorption pit assay showing the decrease in resorption pit area for RANKL-induced cells with si l-CaD (Top). Quantitative analyses for resorption pit area in RANKL-induced RAW264.7 cells with siCtr or si l-CaD (Bottom). In A, B, D, E, and F, the values are the mean ± SEM (n=6), with * indicating a significant difference compared to cells transfected with siCtr.
l-CaD is a key constituent of podosome in RANKL-induced OCs
Using fluorescence confocal microscopy, RANKL-differentiated OCs appear actin-rich ring structures resembling densely packed podosomes, at ventral surface of the cells (Fig. 5A). Although l-CaD has been shown to participate in the dynamic assembly of the podosome in several types of invasive and motile cells (Gu et al., 2007; Eves et al., 2006; Tanaka et al., 1993), it is not known whether l-CaD and its phosphorylation is involved in the control of the podosome formation in osteoclastogenesis. In this study, we showed for the first time that l-CaD/phosphorylated l-CaD is localized in the RANKL-induced podosome forming structure in differentiating OC cells (Fig. 5B-C). Based on the above-mentioned results (Fig. 2), the majority of the increased l-CaD in RANKL-induced cells remained unphosphorylated, thus associated with the actin core (Fig. 5B). In addition, phosphorylated l-CaD became dissociated from the actin core in the RANKL-induced cells (Fig. 5C). This is consistent with the earlier finding that l-CaD is localized to the actin-enriched core of actin ring while moved to the peripheral as being phosphorylated (Tanaka et al., 1993).
Fig. 5. RANKL-induced actin-rich ring structures in OC differentiating cells stained with F-actin, total l-CaD, and phosphorylated l-CaD.
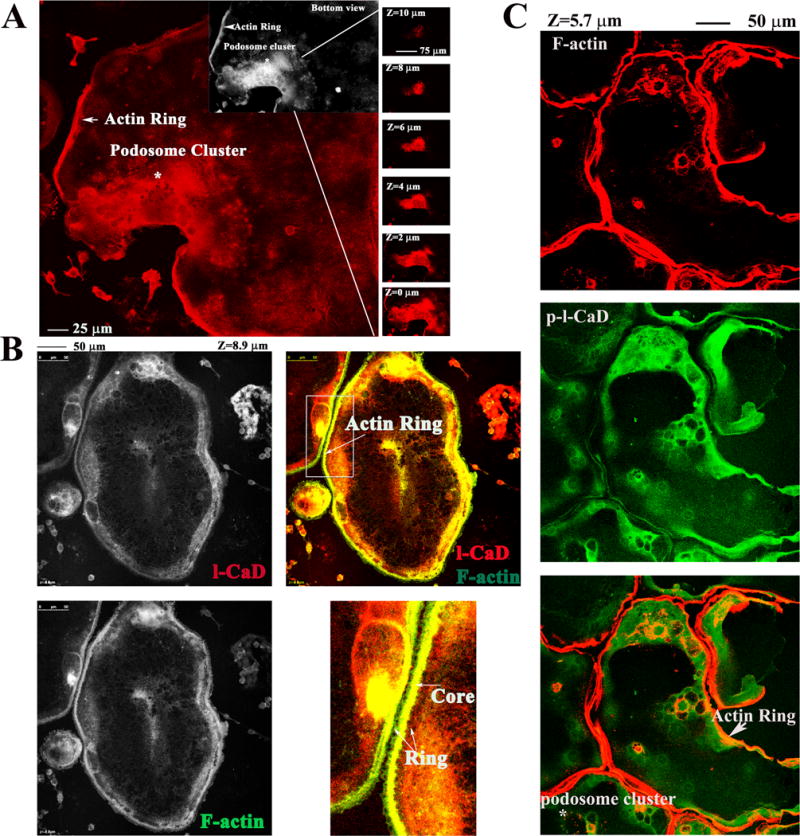
(A) Laser scanning confocal microscopy showing the images of RANKL-induced podosome-like structures (i.e. actin ring and podosome clusters) in OCs with staining of F-actin (red). The portion containing the podosome-like structures was illustrated by displaying the 3D constructed micrographs from bottom to the top with the depth (z) as indicated using Image J computerized software. (B) RANKL-induced OC cells stained with l-CaD (left top), F-actin (left bottom), and merged color micrograph showing l-CaD staining in red, F-actin in green, and colocalized stains in yellow (right top). Magnified portion (right bottom) showing the actin ring structure with the yellow core in the center and green F-actin in the periphery. (C) The stacking confocal micrographs showing F-actin staining in red (top), phosphorylated l-CaD staining in green (middle), and merged images in orange or yellow (bottom). The actin ring and podosome cluster as indicated showing the colocalized portion with the phosphorylated l-CaD and F-actin in the periphery. Calibration bar and z depth as indicated in A, B, and C.
Effects of l-CaD decoy peptides mimicking l-CaD phosphorylation on the podosome formation during the RANKL induced OC differentiation
The (Pak- and Erk-) phosphorylation sites of l-CaD are located at its C-terminal domain containing the Ca2+/Calmodulin site and actin-binding sites (Fig. 6A). Since unphosphorylated CaD binds kinase and actin more strongly than phosphorylated CaD (Wang, 2008), the mutant peptide which couldn’t be phosphorylated may therefore displace some phosphorylated intrinsic CaD. Thus, we prepared decoy peptides of l-CaD with Ser-to-Ala mutations at the Erk-mediated phosphorylation sites (Pep1) and at the Pak-phosphorylation sites (Pep2) to block phosphorylation at these sites, and a third peptide (Pep3) with Ser-to-Asp mutations at the Erk-mediated phosphorylation sites to mimic dephosphorylation/phosphorylation (Fig. 6A). Both Pep1 and Pep2 competed with the C-terminal fragment of CaD (e.g., both phosphorylated and dephosphorylated H32K) for binding to F-actin, while Pep3 did not affect the binding of dephosphorylated H32K to F-actin (Fig. 6A). Incubation of these l-CaD decoy peptides with RAW264.7 cells for 48 hr achieved high loading efficiency as evidenced by the incorporation of FITC fluorescence (Fig. 6B). All peptide treatments do not affect the cell growth (Fig. 6C) and the relative amount of l-CaD to F-actin in cells (Fig. 6D-E).
RANKL-induced OC cells presenting unique punctate structures of podosome could be visualized by colocalization of F-actin with its regulators (i.e. l-CaD/phosphorylated l-CaD, vinculin, and Tm4) (Fig. 7A). Interestingly, upon RANKL stimulation, Pep1- and Pep2-pre-treated RAW264.7 cells increased their ability to form podosome-like structures; while Pep3-pretreated cells did not show increased OC differentiation, as compared to controls (Fig. 7). In our studies, we found 18%, 46%, 37%, and 6% of RANKL-induced OCs appearing podosome-like structures for control, Pep 1, Pep 2, and Pep 3 treated cells, respectively. The percentage of podosome formation was quantitated by Image plus computerized software, where the podosome forming region was selected for quantitation with normalization to total cell area (Fig. 7B). Clearly, ablating either Erk- or Pak-phosphorylation increased podosome formation in RANKL-induced OC differentiation. Of note, Pep1 and Pep2 did not have a synergic effect on podosome formation in RANKL-induced OCs (Fig. 7B).
Fig. 7. Effects of decoy peptides pretreatment on increases of RANKL induced podosome formation.
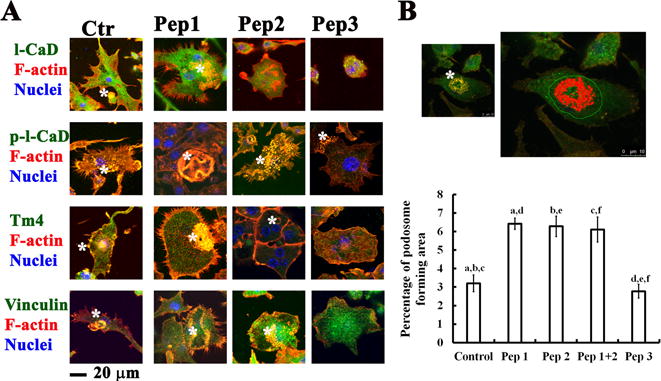
(A) Confocal immunofluorescence microscopy showing effects of decoy peptides for mimicking dephosphorylated (e.g., Pep1, Pep2) and phosphorylated (Pep3) states of l-CaD on the podosome formation in RANKL-induced OCs stained with total l-CaD, phosphorylated l-CaD, vinculin, and Tm4 (green), with F-actin (red), and nuclei (blue). Podosome-like structures as indicated by white star. (B) Top: Confocal immunofluorescence micrographs showing the podosome forming region selected for quantitation by Image plus computerized software. Bottom: Quantitative analyses of podosome forming area in cells with or without peptides pretreatment. The podosome containing area (yellow or orange colors) were measured by using Image-Pro Plus computerized software, and the percentage of podosome was determined by normalizing to the total cell areas in each measurement. Calibration bar in (A) and (B) as indicated. The values are the mean ± SEM (n=20), with a to f indicating a significant difference (P<0.05) between each group.
Finally, we conducted experiments with RAW264.7 cells expressing phosphorylated or dephosphorylated l-CaD mutants followed by RANKL induction for measuring the TRAP staining activity (Fig. 8). After RANKL-induction for 5 days, the expression of EGFP-fusion proteins retained significantly in differentiating OC cells (Fig. 8A). Analyses with TRAP staining (Fig. 8B) indicated that dephosphorylated l-CaD mutant (Erk site A3A4) facilitated RANKL-induced TRAP activity with increasing the number of larger OCs with more than 20 nuclei (L) and concomitant decreases in the number of small-sized cells (S) with 3-10 nuclei, while phosphorylation-mimicking l-CaD mutant (Pak site D1D2) decreased the TRAP activity with increasing the number of small-sized cells (S) with 3-10 nuclei and concomitant decreases in the number of larger OC cells with more than 20 nuclei (L) as well as medium-sized cells (M) with 10-20 nuclei (Fig. 8C). Consistently, the RANKL-induced cell fusion indices were (50.2 ± 4.8)%, (67.5 ± 4.5)% and (21.6 ± 9.3)%, for the EGFP control, the Erk-sites dephosphorylated mutant (EGFP-dp-l-CaD) and the Pak-sites phosphorylation-mimicking mutant (EGFP-p-l-CaD), respectively (Fig. 8D). These results indicated that dephosphorylated l-CaD mutant facilitated RANKL-induced TRAP activity with an increased activity for cell-cell fusion (~34% increase in the fusion index), while phosphorylation-mimicking l-CaD mutant decreased the TRAP activity and cell fusion index (~57% decrease).
Fig. 8. Effect of phosphorylated and dephosphorylated l-CaD on RANKL-induced TRAP activity and cell-cell fusion.
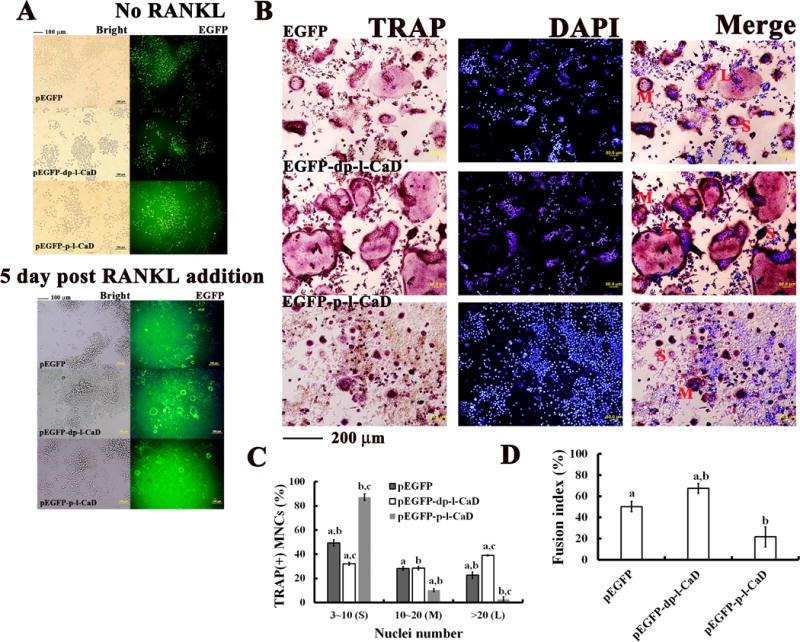
(A) Phase contrast and fluorescence microscopy showing RAW264.7 cells transfected with EGFP, EGFP-phosphorylated l-CaD fusion mutant or EGFP-dephosphorylated l-CaD fusion mutant before (top) and after (bottom) RANKL induction for 5 days. (B) RANKL-induced TRAP-positive OC images with TRAP staining (red) and DAPI nuclei staing (blue) for EGFP transfection control, transfection with EGFP-dephosphorylated l-CaD fusion mutant and with EGFP-phosphorylated l-CaD fusion mutant. Red labels of S, M, L indicating MNCs with nuclei number of 3-10, 10-20, and >20, respectively. Calibration bar 100 μm in (A) and (B) as indicated. (C) Quantitative analyses for TRAP-positive multinucleate OCs (MNCs)/well, and (D) the cell fusion index in RANKL-induced RAW264.7 cells of EGFP transfection control, transfection with EGFP-dephosphorylated l-CaD fusion mutant and transfection with EGFP-phosphorylated l-CaD fusion mutant, respectively. In C and D, the values are the mean ± SEM (n=6), with a to c indicating a significant difference (P<0.05) between each group.
Discussion
Non-muscle caldesmon (l-CaD) is involved in the regulation of actin cytoskeletal remodeling in the podosome formation, but its function in osteoclastogenesis remains to be determined. In this study, we used RANKL-induced RAW264.7 murine macrophage differentiation into osteoclast-like cells (OCs) as a model to shed light on the physiological role of l-CaD and its phosphorylation in osteoclastogenesis (Fig. 1). Clearly, the actin cytoskeleton undergoes changes during RANKL-induced OC differentiation and the increased expression of l-CaD plays a role in such changes (Fig. 2). That increased l-CaD expression accelerates RANKL-induced OC differentiation was confirmed by the study with l-CaD overexpression (Fig. 3) and si-l-CaD (Fig. 4) in RAW264.7 cells followed by RANKL induction. In addition, confocal fluorescence microscopy showed total/phosphorylated l-CaD colocalizing with F-actin in the podosome-like structures of RANKL-induced OCs (Fig. 5). Since western blot analyses did not show an increase of steady-state phosphorylation level of l-CaD during RANKL induction (Fig. 2), we interpret these results as that increased l-CaD expression accompanied by steady-state increases of unphosphorylated l-CaD somehow facilitates the podosome formation in the RANKL-induced OC differentiating cells. In addition, decoy peptides were used with mutations to block Erk- (Pep1) or Pak1-(Pep2) mediated phosphorylation, and that to mimic Erk-mediated phosphorylation (Pep3) (Fig. 6, 7). Both Pep1 and Pep2 disturbing the C-terminal l-CaD for F-actin binding accelerated podosome formation in RANKL-induced OCs, while Pep3 which does not significantly affect the unphosphorylated l-CaD for the F-actin binding decreased the podosome formation in osteoclastogenesis (Fig. 7). However, effects of decoy peptides on OC functions still warrant further study. Along with the experiments expressing unphosphorylatable (Erk site A3A4 mutant) and phosphorylation-mimicking (Pak site D1D2 mutant) l-CaD variants, we also showed that dephosphorylated l-CaD facilitated RANKL-induced TRAP activity with an increased cell-cell fusion activity, while phosphorylated l-CaD decreased the TRAP activity and cell fusion index (Fig. 8). Based on these findings, conclude that both the level of l-CaD expression and its extent of phosphorylation play an essential role in the regulation of the RANKL-induced OC differentiation.
RANKL interacts with the cell surface receptor RANK forming the activation complex with TRAFs, and hence triggering the downstream signaling pathways that allow OC-specific gene expression for differentiation and maturation (Wada et al., 2006). AP-1 is a dimeric transcription factor complex formed by proteins of the Jun, Fos, activating transcription factor (ATF) and musculoaponeurotic fibrosarcoma (MAF) families (Arnott et al., 2002). The mouse CALD1 promoter between −198 bp and −190 bp has been identified as a cis-acting element for binding AP-1 transcription factor complex (Jang et al., 2013). Of interest, their study showed that the activation of l-CaD expression by Sox4 is required for murine skeletal myoblast fusion into multinucleate muscle fibers (Jang et al., 2013). Here, we have found evidence that l-CaD expression is increased along with other osteoclastogenic gene products such as c-fos, NFATc1, TRAP, CTSK, as well as beta 3 integrin in the RANKL-induced osteoclastogenesis (Fig. 2). It also seems to support that the expression of CaD in response to the differentiation signal is critical for myogenesis and osteoclastogenesis.
Both Tm and CaD are known to regulate the actin-myosin interaction in both smooth muscle and non-muscle cells by the mode of phosphorylation /dephosphorylation (Wang and Coluccio, 2010). Tm isoforms are found to be integral components of the podosome in OCs (McMichael and Lee, 2008), while CaD in vascular smooth muscle cells (Gu et al., 2007; Eves et al., 2006). Recently, it has been found that unconventional single-headed Myosin IXB, containing RhoGAP domain at its tail could modulate the podosome patterning and OC function via controlling the distribution and stability of cytoskeletal associated proteins such as Tm and l-CaD (McMichael et al., 2014). Inhibitory role of the Rho signaling pathway takes part in the control of podosome patterning in containing cells, including OCs (Pan et al., 2011). Again, actin and myosin IXB may be controlled by Tm and CaD via phosphorylation/dephosphorylation to affect the down-stream targets for controlling the distribution and stability of the podosome and OC functions.
Two critical steps occur in osteoclastogenesis; a commitment of the hematopoietic cell lineages to OC precursor cells, and cell-cell fusion to form multinucleated OCs (Oikawa et al., 2013). Each step could be considered as a potential target for therapeutic intervention on this disease. For the first step, the intervention on commitment to OC precursor cells could result in serious adverse effects from the hematopoietic system (i.e., denosumab inhibiting RANKL signaling pathway). Alternately, the strategy controlling profusion of OC precursor cells into multinucleate OCs has been shown to enhance the efficiency of bone resorption by forming the actin-rich structure of podosome. Thus, it is potentially promising to develop a new potent anti-resorption agent on this information. Our study using different l-CaD decoy peptides mimicking the Pak- and the Erk-mediated phosphorylation sites at l-CaD suggested that approaches by modification on l-CaD phosphorylation may create a new way to attenuate the podosome forming potential without damaging OC cell growth.
In summary, our experiments using gain- (Fig. 3) and loss-of-function (Fig. 4) in OC precursor cells followed by RANKL induction showed that the expression of l-CaD in response to RANKL activation is an important event for osteoclastogenesis. In addition, our study using different decoy peptides (Figs. 6–7) mimicking the Pak- or Erk-mediated phosphorylation sites at the C-terminal end of l-CaD along with full-length mutants of l-CaD (Fig. 8) suggested that the phosphorylation of l-CaD may involve in the control of the F-actin architecture of podosome upon RANKL induction.
Supplementary Material
Acknowledgments
Contract grant sponsor: NIH and MOST; Contract grant number: R01 HL092252 (to C-LAW) and MOST-105-2320-B-005-007- (to YML) and MOST-106-2320-B-005-003-MY2 (to YML)
This work was prepared while Dr. Chih-Lueh Albert Wang was employed at Boston biomedical Research Institute. The opinions expressed in this article are the author’s own and do not reflect the view of the National Institutes of Health, the Department of Health and Human Services, or the United States government. We wish to thank Dr. Ricardo Battaglino of the Forsyth Institute for initially providing us with the RAW264.7 cells and advice on the handling of these cells.
Footnotes
The authors declare no potential conflicts of interest.
References
- Arnott CH, Scott KA, Moore RJ, Hewer A, Phillips DH, Parker P, Balkwill FR, Owens DM. Tumour necrosis factor-alpha mediates tumour promotion via a PKC alpha- and AP-1-dependent pathway. Oncogene. 2002;21:4728–4738. doi: 10.1038/sj.onc.1205588. [DOI] [PubMed] [Google Scholar]
- Becker-Hapak M, McAllister SS, Dowdy SF. TAT-mediated protein transduction into mammalian cells. Methods. 2001;24:247–256. doi: 10.1006/meth.2001.1186. [DOI] [PubMed] [Google Scholar]
- Chen L, Wright LR, Chen CH, Oliver SF, Wender PA, Mochly-Rosen D. Molecular transporters for peptides: delivery of a cardioprotective epsilonPKC agonist peptide into cells and intact ischemic heart using a transport system, R(7) Chem Biol. 2001;8:1123–1129. doi: 10.1016/s1074-5521(01)00076-x. [DOI] [PubMed] [Google Scholar]
- Chen PC, Cheng HC, Tang CH. CCN3 promotes prostate cancer bone metastasis by modulating the tumor-bone microenvironment through RANKL-dependent pathway. Carcinogenesis. 2013;34:1669–1679. doi: 10.1093/carcin/bgt103. [DOI] [PubMed] [Google Scholar]
- D’Angelo G, Graceffa P, Wang CA, Wrangle J, Adam LP. Mammal-specific, ERK-dependent, caldesmon phosphorylation in smooth muscle. Quantitation using novel anti-phosphopeptide antibodies. J Biol Chem. 1999;274:30115–30121. doi: 10.1074/jbc.274.42.30115. [DOI] [PubMed] [Google Scholar]
- Eppinga RD, Li Y, Lin JL, Mak AS, Lin JJ. Requirement of reversible caldesmon phosphorylation at P21-activated kinase-responsive sites for lamellipodia extensions during cell migration. Cell Motil Cytoskeleton. 2006;63:543–562. doi: 10.1002/cm.20144. [DOI] [PubMed] [Google Scholar]
- Eves R, Webb BA, Zhou S, Mak AS. Caldesmon is an integral component of podosomes in smooth muscle cells. J Cell Sci. 2006;119:1691–1702. doi: 10.1242/jcs.02881. [DOI] [PubMed] [Google Scholar]
- Frankel AD, Pabo CO. Cellular uptake of the tat protein from human immunodeficiency virus. Cell. 1988;55:1189–1193. doi: 10.1016/0092-8674(88)90263-2. [DOI] [PubMed] [Google Scholar]
- Frenkel B, White W, Tuckermann J. Glucocorticoid-induced osteoporosis. Adv Exp Med Biol. 2015;872:179–215. doi: 10.1007/978-1-4939-2895-8_8. [DOI] [PMC free article] [PubMed] [Google Scholar]
- Gorenne I, Su X, Moreland RS. Caldesmon phosphorylation is catalyzed by two kinases in permeabilized and intact vascular smooth muscle. J Cell Physiol. 2004;198:461–469. doi: 10.1002/jcp.10440. [DOI] [PubMed] [Google Scholar]
- Gu Z, Kordowska J, Williams GL, Wang CL, Hai CM. Erk1/2 MAPK and caldesmon differentially regulate podosome dynamics in A7r5 vascular smooth muscle cells. Exp Cell Res. 2007;313:849–866. doi: 10.1016/j.yexcr.2006.12.005. [DOI] [PMC free article] [PubMed] [Google Scholar]
- Hai CM, Gu Z. Caldesmon phosphorylation in actin cytoskeletal remodeling. Eur J Cell Biol. 2006;85:305–309. doi: 10.1016/j.ejcb.2005.08.008. [DOI] [PubMed] [Google Scholar]
- Hamden SS, Schroeter MM, Chalovich JM. Phosphorylation of caldesmon at sites between residues 627 and 642 attenuates inhibitory activity and contributes to a reduction in Ca2+-calmodulin affinity. Biophys J. 2010;99:1861–1868. doi: 10.1016/j.bpj.2010.07.018. [DOI] [PMC free article] [PubMed] [Google Scholar]
- Hsu YC, Liou YM. The anti-cancer effects of (-)-epigalocathine-3-gallate on the signaling pathways associated with membrane receptors in MCF-7 cells. J Cell Physiol. 2011;226:2721–2730. doi: 10.1002/jcp.22623. [DOI] [PubMed] [Google Scholar]
- Huang R, Wang CL. A caldesmon peptide activates smooth muscle via a mechanism similar to ERK-mediated phosphorylation. FEBS Lett. 2006;580:63–66. doi: 10.1016/j.febslet.2005.11.047. [DOI] [PubMed] [Google Scholar]
- Humphrey MB, Herrera-Sosa H, Gonzalez G, Lee R, Bryan J. Cloning of cDNAs encoding human caldesmons. Gene. 1992;112:197–204. doi: 10.1016/0378-1119(92)90376-z. [DOI] [PubMed] [Google Scholar]
- Jang SM, Kim JW, Kim D, Kim CH, An JH, Choi KH, Rhee S. Sox4-mediated caldesmon expression facilitates differentiation of skeletal myoblasts. J Cell Sci. 2013;26:5178–5118. doi: 10.1242/jcs.131581. [DOI] [PubMed] [Google Scholar]
- Jiang Q, Huang R, Cai S, Wang CL. Caldesmon regulates the motility of vascular smooth muscle cells by modulating the actin cytoskeleton stability. J Biomed Sci. 2010;17:6. doi: 10.1186/1423-0127-17-6. [DOI] [PMC free article] [PubMed] [Google Scholar]
- Kordowska J, Hetrick T, Adam LP, Wang CL. Phosphorylated l-caldesmon is involved in disassembly of actin stress fibers and postmitotic spreading. Exp Cell Res. 2006;312:95–110. doi: 10.1016/j.yexcr.2005.09.021. [DOI] [PubMed] [Google Scholar]
- Kordowska J, Huang R, Wang CL. Phosphorylation of caldesmon during smooth muscle contraction and cell migration or proliferation. J Biomed Sci. 2006;13:159–172. doi: 10.1007/s11373-005-9060-8. [DOI] [PubMed] [Google Scholar]
- Lee YH, Gallant C, Guo H, Li Y, Wang CA, Morgan KG. Regulation of vascular smooth muscle tone by N-terminal region of caldesmon: Possible role of tethering actin to myosin. J Biol Chem. 2000;275:3213–3220. doi: 10.1074/jbc.275.5.3213. [DOI] [PubMed] [Google Scholar]
- Lee YJ, Datta S, Pellois JP. Real-time fluorescence detection of protein transduction into live cells. J Am Chem Soc. 2008;130:2398–2399. doi: 10.1021/ja7102026. [DOI] [PubMed] [Google Scholar]
- Mayanagi T, Sobue K. Diversification of caldesmon-linked actin cytoskeleton in cell motility. Cell Adh Migr. 2011;5:150–159. doi: 10.4161/cam.5.2.14398. [DOI] [PMC free article] [PubMed] [Google Scholar]
- McMichael BK, Scherer KF, Franklin NC, Lee BS. The RhoGAP activity of myosin IXB is critical for osteoclast podosome patterning, motility, and resorptive capacity. PLoS One. 2014;9:e87402. doi: 10.1371/journal.pone.0087402. [DOI] [PMC free article] [PubMed] [Google Scholar]
- McMichael BK, Lee BS. Tropomyosin 4 regulates adhesion structures and resorptive capacity in osteoclasts. Exp Cell Res. 2008;314:564–573. doi: 10.1016/j.yexcr.2007.10.018. [DOI] [PMC free article] [PubMed] [Google Scholar]
- Morita T, Mayanagi T, Yoshio T, Sobue K. Changes in the balance between caldesmon regulated by p21-activated kinases and the Arp2/3 complex govern podosome formation. J Biol Chem. 2007;282:8454–8463. doi: 10.1074/jbc.M609983200. [DOI] [PubMed] [Google Scholar]
- Nilsson AG. Bone research: an issue of maturity. J Intern Med. 2015;277:626–629. doi: 10.1111/joim.12371. [DOI] [PubMed] [Google Scholar]
- Oikawa T, Kuroda Y, Matsuo K. Regulation of osteoclasts by membrane-derived lipid mediators. Cell Mol Life Sci. 2013;70:3341–3353. doi: 10.1007/s00018-012-1238-4. [DOI] [PMC free article] [PubMed] [Google Scholar]
- Pan YR, Chen CL, Chen HC. FAK is required for the assembly of podosome rosettes. J Cell Biol. 2011;195:113–129. doi: 10.1083/jcb.201103016. [DOI] [PMC free article] [PubMed] [Google Scholar]
- Peng KW, Liou YM. Differential role of actin-binding proteins in controlling the adipogenic differentiation of human CD105-positive Wharton’s Jelly cells. Biochim Biophys Acta. 2012;1820:469–481. doi: 10.1016/j.bbagen.2012.01.014. [DOI] [PubMed] [Google Scholar]
- Rodan GA, Martin TJ. Therapeutic approaches to bone diseases. Science. 2000;289:1508–1514. doi: 10.1126/science.289.5484.1508. [DOI] [PubMed] [Google Scholar]
- Shieh DB, Li RY, Liao JM, Chen GD, Liou YM. Effects of genistein on β-catenin signaling and subcellular distribution of actin-binding proteins in human umbilical CD105-positive stromal cells. J Cell Physiol. 2010;223:423–434. doi: 10.1002/jcp.22051. [DOI] [PubMed] [Google Scholar]
- Sobue K, Muramoto Y, Fujita M, Kakiuchi S. Purification of a calmodulin-binding protein from chicken gizzard that interacts with F-actin. Proc Natl Acad Sci USA. 1981;78:5652–5655. doi: 10.1073/pnas.78.9.5652. [DOI] [PMC free article] [PubMed] [Google Scholar]
- Tanaka J, Watanabe T, Nakamura N, Sobue K. Morphological and biochemical analyses of contractile proteins (actin, myosin, caldesmon, and tropomyosin) in normal and transformed cells. J Cell Sc. 1993;104:595–606. doi: 10.1242/jcs.104.2.595. [DOI] [PubMed] [Google Scholar]
- Vives V, Cres G, Richard C, Busson M, Ferrandez Y, Planson AG, Zeghouf M, Cherfils J, Malaval L, Blangy A. Pharmacological inhibition of Dock5 prevents osteolysis by affecting osteoclast podosome organization while preserving bone formation. Nat Commun. 2015;6:6218. doi: 10.1038/ncomms7218. [DOI] [PubMed] [Google Scholar]
- Vives V, Laurin M, Cres G, Larrousse P, Morichaud Z, Noel D, Côté JF, Blangy A. The Rac1 exchange factor Dock5 is essential for bone resorption by osteoclasts. J Bone Miner Res. 2011;26:1099–1110. doi: 10.1002/jbmr.282. [DOI] [PMC free article] [PubMed] [Google Scholar]
- Wada T, Nakashima T, Hiroshi N, Penninger JM. RANKL-RANK signaling in osteoclastogenesis and bone disease. Trends Mol Med. 2006;12:17–25. doi: 10.1016/j.molmed.2005.11.007. [DOI] [PubMed] [Google Scholar]
- Wang CL, Coluccio LM. New insights into the regulation of the actin cytoskeleton by tropomyosin. Int Rev Cell Mol Bio. 2010;281:91–128. doi: 10.1016/S1937-6448(10)81003-2. [DOI] [PMC free article] [PubMed] [Google Scholar]
- Wang CL. Caldesmon and the regulation of cytoskeletal functions. Adv Exp Med Biol. 2008;644:250–272. doi: 10.1007/978-0-387-85766-4_19. [DOI] [PMC free article] [PubMed] [Google Scholar]
- Zaidi M. Skeletal remodeling in health and disease. Nat Med. 2007;13:791–801. doi: 10.1038/nm1593. [DOI] [PubMed] [Google Scholar]
- Zhan QQ, Wong SS, Wang CL. A calmodulin-binding peptide of caldesmon. J Biol Chem. 1991;266:21810–21814. [PubMed] [Google Scholar]
Associated Data
This section collects any data citations, data availability statements, or supplementary materials included in this article.


