



Abstract
A quick fabrication method for making double-walled (DW) polymeric nanospheres is presented. The process uses sequential precipitation of two polymers. By choosing an appropriate solvent and non-solvent polymer pair, and engineering two sequential phase inversions which induces first precipitation of the core polymer followed by precipitation of the shell polymer, DW nanospheres can be created instantaneously. A series of DW formulations were prepared with various core and shell polymers, then characterized using laser diffraction particle sizing, scanning electron microscopy, atomic force microscopy, Fourier transform infrared spectroscopy, and differential scanning calorimetry (DSC). Atomic force microscopy (AFM) imaging confirmed existence of a single core polymer coated with a second polymer. Insulin (3.3% loading) was used as a model drug to assess its release profile from core (PLGA) and shell (PBMAD) polymers and resulted with a tri-phase release profile in vitro for two months. Current approaches for producing DW nanoparticles (NPs) are limited by the complexity and time involved. Additional issues include aggregation and entrapment of multiple spheres and the undesired formation of heterogeneous coatings. Therefore, the technique presented here is advantageous because it can produce NPs with distinct, core-shell morphologies through a rapid, spontaneous, self-assembly process. This method not only produces DW NPs, but can also be used to encapsulate therapeutic drug. Furthermore, modification of this process to other core and shell polymers is feasible using the general guidelines provided in this paper.
Keywords: Double-walled Nanoparticles, Nanoparticles Production Method, AFM, DSC, and Polymers’ Mixtures
Graphical abstract

1. Introduction
Polymer microspheres have long been researched as a means for the controlled delivery of therapeutic agents. With the recent surge of research in nanotechnology, nanosphere formation has become an area of significant interest in the field of drug delivery. While there have been many advances in the development of more sophisticated methods of fabricating microspheres, translating these technologies and encapsulating therapeutic drugs at the nanoscale level are still quite challenging. One such example is creating DW nanospheres, which can provide effective release of the drug by reducing the burst effect and providing protection from the harsh environment of the gastrointestinal (GI) tract [1].
Traditionally, the preparation of large DW spheres involves multiple steps in which single-walled spheres were fabricated then coated with a second polymer by pan-coating, solvent evaporation, dip-coating, spray drying, or other similar processes [2–4]. However, these methods often result in the incomplete or uneven deposition of the coating polymer especially as the particle size of the core material is decreased. Additionally, the need for additional steps in the manufacturing process decreases yield and presents difficulties in quality control and especially scale up. Our group has previously reported the formation of double walled, large microspheres using a modified solvent evaporation technique that involves phase separation of two polymers in the organic phase [3,5–7]. However reducing this process to nanoscale was never done before in the Mathiowitz lab. As micro- and nanoencapsulation techniques have become more sophisticated and yield smaller diameter particles, the technical challenges of coating them became essential.
The small diameter of nanospheres offers many advantages for drug delivery but also presents many challenges in successfully obtaining controlled release. The high surface area to volume ratio of nanospheres often results in most of the drug being released during the initial burst phase. This is especially true for proteins and peptides. In this case, the use of DW nanospheres could play an important role in achieving the desired release as well as in decreasing the burst effect. In addition, bioactive polymers could be used as the shell in order to enhance nanoparticle-tissue interactions; for example, the use of bioadhesive polymers to enhance the retention of the nanospheres in the GI tract [8–10].
It should also emphasized that this approach of using bioadhesives in order to increase systemic uptake has been shown to work also in vivo [9,11–14]. For example, it has been shown by Reineke et al.[9] that coating polyacrylic acid NPs with PBMAD increases the systemic uptake of the particles from 6% to 66%.
Phase inversion nanoencapsulation (PIN) [3] is a method developed by the Mathiowitz lab for the encapsulation of small molecules, proteins and genes in small diameter micro- and nanospheres [8–10,15,16]. Since then, many groups have fabricated nanospheres by this method using a variety of polymer and drug combinations and have evaluated the manufacturing parameters, drug localization, in vitro and in vivo degradation as well as drug release kinetics [2,3,5–7,17–20]. More recently, smaller diameter spheres were formed by a precision particle fabrication process. This process relies on a series of annular nozzles that create a compound jet of core and shell polymeric solutions that are broken by acoustic excitation into uniform droplets which are sprayed directly into an aqueous bath for solvent evaporation [21–23]. In addition, triple walled microspheres were fabricated with multiple drugs localized in different layers of spheres based on each drug affinity to specific polymer layer [24]. All these studies have shown that the addition of a polymer shell results in a smaller burst effect and more sustained release of drugs encapsulated in the core than their single-walled counterparts (see also review [25]).
In the current paper, a new method is presented for manufacturing nano-sized DW spheres (encapsulating insulin) based on the phase separation and formation of a cloud point of two polymers in solution. This production approach is significantly faster than existing methods, adjustable in scale, and implementable in relatively basic lab setups. We termed this procedure Single Step Double-walled Nanoencapsulation (SSDN).
2. Materials and Methods
2.1. Materials
Poly(lactic-co-glycolic acid) (PLGA, Resomer RG 502, 50:50; i.v. range 0.16 – 0.24 dL/g in CHCl3) was purchased from Boehringer-Ingelheim, Inc. (Ridgefield, CT). PLGA (75:25; i.v. 0.67 dL/g in CHCl3) and D,L-poly(lactic acid) (D,L-PLA; and i.v. 0.21 dL/g in CHCl3) were purchased from Birmingham Polymers, Inc. (Pelham, AL). These polymers were stored at −20°C until use. It should be noted that today these aforementioned polymers could be obtained from Polysciences (cat #: 26269, 25107, and 22505 respectively). Poly(methyl methacrylate) (PMMA, atactic; MW: ~25,000) was obtained from Polysciences, Inc. (Warrington, PA), and stored at room temperature. All novel, bioadhesive poly(butadiene-maleic anhydride) (pBMA)-derivative and poly(ethylene-maleic anhydride) (pEMA)-derivative polymers were synthesized in the Mathiowitz lab via ring-opening, side-chain conjugation reaction in dimethyl sulfoxide (DMSO) as described in detail [26]. These polymers include poly(butadiene-maleic anhydride-co-L-phenylalanine) (PBMAP), poly(butadiene-maleic anhydride-co-L-tyrosine) (PBMAT), poly(butadiene-maleic anhydride-co-L-DOPA) (PBMAD), poly(ethylene-maleic anhydride-co-L-phenylalanine) (PEMAP), poly(ethylene-maleic anhydride-co-L-tyrosine) (PEMAT), and poly(ethylene-maleic anhydride-co-L-DOPA) (PEMAD). These polymers were stored at room temperature. The pBMA and pEMA unmodified polymers were purchased from Polysciences, Inc. (Warrington, PA) while the amino acid conjugates were obtained from Sigma-Aldrich Co. (St. Louis, MO). Tetrahydrofuran (THF), ethanol, sodium lauryl sulfate (SLS), petroleum ether, 1% polyvinylpyrrolidone (PVP), phosphate buffer saline (PBS), formic acid, acetonitrile, bovine zinc insulin, and 0.22 μm Fluoropore PTFE filters were all purchased from Fisher Scientific. All solvents used in this study were of the highest commercial grade available.
2.2. Cloud Point Detection
The cloud point of a polymer solution corresponds to the transition from a translucent to a metastable cloudy turbid state due to the separation of the solution into two distinct phases, one with a high, relative, polymer concentration and another with a low, relative, polymer concentration.
For each formulation presented in this paper, THF was selected as the solvent for the core polymer and ethanol was selected as the solvent for the shell polymer. To determine the cloud point of each core polymer solution, ethanol was added in 100 μL increments to a 2% w/v core polymer solution in THF until the solution became turbid and resulted in no increase in the turbidity of the solution with the further addition of ethanol but without precipitation of the polymer. Once the cloud point was determined, the cloud point testing was repeated using a 2% w/v solution of the shell polymer in ethanol to ensure the presence of the second polymer did not affect the cloud point. In all cases, it was found that the shell polymer added to the ethanol solution did not affect the cloud point. To prepare DW particles, the cloud point was determined for the following polymers selected as core polymers at 2 % w/v in THF: PMMA, PLGA (75:25), PLGA (50:50), and D, L-PLA (Table 1).
Table 1.
Cloud point testing of 2% w/v core polymer solutions (i.e. THF) with ethanol as a non-solvent for the core polymer and a solvent for the shell polymer. The cloud point results are presented as the ratio of the volume of shell polymer solvent (mLS2) to volume of core polymer solution (mLS1) once achieving stable cloudy turbidity (mLS2/mLS1).
| Polymer | Cloud point (mLS2/mLS1) |
|---|---|
| PMMA | 2.80 |
| D, L-PLA | 1.28 |
| PLGA (50:50) | 2.52 |
| PLGA (75:25) | 1.56 |
2.3. Single Step Double-walled Nanoencapsulation (SSDN) Fabrication
To fabricate DW nanospheres consisting of polymeric cores with different polymeric shells, the appropriate volume ratio of 2% w/v shell polymer solution in ethanol was added to a 2% w/v of core polymer solution in THF (see Table 1 for details). Then the resulting cloudy mixture was rapidly added to a non-solvent (for both polymers) solution of petroleum ether with a solvent mixture to non-solvent solution ratio of 1:75 resulting in the spontaneous formation of DW nanospheres. The final mixture was left to stir for 2–5 minutes to allow for the extraction of residual solvents and for nanosphere curing (Figure 1, top). The resulting spheres were captured using a 0.22 μm Fluoropore PTFE membrane filter under a positive pressure filtration column (Millipore, Inc.; Billerica, MA). Material retained on the membrane were scraped, flash frozen in liquid nitrogen and lyophilized for 24 hours. Schematic representation of this process, using PLGA and PBMAD as representative polymers, is depicted in Figure 1.
Figure 1.

Top: Schematic of the Single Step Double Wall Nanoencapsulation (SSDN) process for the PLGA (75:25)/PBMAD DW formulation. Bottom (a, b, and c): Suggested mechanism of particle formation via the SSDN process; (a) cloud point of PLGA in THF-ethanol mixed solvent solution causing the PLGA to phase separate, while the PBMAD is fully soluble; (b) phase inversion of the PBMAD shell around the PLGA core in excess non-solvent for both polymers (petroleum ether); (c) DW PLGA-core/PBMAD-shell nanosphere created after the solvents (THF and ethanol) are leaching out.
2.4. DW Nanoparticles Characterization
2.4.1. Particle Size Analysis
All formulations were reconstituted from powder form into a medium consisting of an aqueous solution of 1% SLS and 1% polyvinylpyrrolidone PVP solution in 0.5 – 2% w/v suspensions utilizing bath sonication. A Beckman Coulter LS230 Laser Diffraction Particle Size Analyzer (Beckman Coulter, Inc.; Brea, CA) was used to evaluate the size distribution of the DW NPs formulations.
2.4.2. Scanning Electron Microscopy
The morphology of the DW nanospheres formulations was analyzed by scanning electron microscopy (SEM). Formulations were placed on a carbon-backed adhesive and sputter-coated with Au-Pd for 4 minutes at 20 mA and imaged on a Hitachi 2700 Scanning Electron Microscope (Hitachi High Technologies America, Inc.; Pleasanton, CA) with an accelerating voltage of 8 kV.
2.4.3. Differential Scanning Calorimetry Analysis
3–7 mg of each formulation or bulk polymers were sealed into aluminum sample pans for differential scanning calorimetry (DSC) analysis. Thermal analyses of the DW nanospheres were performed using a Model DSC 7 (Perkin-Elmer, Inc.; Waltham, MA) equipped with controller model TAC 7/DX (Perkin-Elmer, Inc.; Waltham, MA). After achieving equilibrium at −20°C, samples were heated to 200°C, cooled to −20°C then reheated to 200°C again all at a rate of 10°C/min. Thermograms were analyzed using Perkin-Elmer Thermal Analysis built-in software for the calculation of glass transition temperatures (Tg).
2.4.4. Fourier Transform Infrared Spectroscopy Analysis
All formulations or bulk polymers were analyzed as dry powders using a Perkin Elmer Spectrum One Fourier transform infrared spectroscopy (FTIR) with a Universal ATR Sampling Accessory and analyzed using the built-in Spectrum software (Perkin-Elmer, Inc.; Waltham, MA).
2.4.5. Atomic Force Microscopy
The formation of nanosphere core and shell structure was evaluated using atomic force microscopy (AFM, MFP-3D-BIO, Asylum Research) using AC (tapping) mode. AFM samples were prepared in the following manner, 50 μL of 1% w/v pure PLGA NPs, pure PBMAD NPs, and PLGA coated with PBMAD DW NPs were placed on a square coverslip, and the liquid was allowed to evaporate. The square coverslips were then adhered to a slide using double-sided tape. AFM scans used a sharp, silicon cantilever (tip diameter < 20 nm) with a nominal stiffness value of 40 N/m (Budget Sensors). Topographical height and phase shift scans were acquired to determine surface and polymer composition. In order to ensure that the data gathered were real and not imaging artifacts, height and phase data were captured for both directions (trace and retrace), different scan sizes were analyzed (ranging from 100 nm – 10 μm), different scan speeds were used on the same sample (1 Hz and 0.8 Hz), and multiple spots per sample were imaged [27]. AFM was also used to image exposed DW (PLGA-PBMAD) NPs to base (pH=10) solution (Figure 6). Since PBMAD easily dissolves at this pH while PLGA does not, this exposure should provide additional insights into what lies beneath the supposed PBMAD shell. Briefly, 20 mg of the manufactured DW NPs were exposed to 1 mL of high pH solution (pH=10) for 15 minutes. Then AFM was used to image these DW NPs.
Figure 6.

AFM 3D images of NPs of pure PLGA 75:25 NPs before (A) and after (B) exposure to pH=10 and PBMAD/PLGA 75:25 DW NPs before (C) and after (D) exposure to pH=10. XYZ axes provide length, width, and height scaling of the NPs while the purple-orange-yellow scale bar (same scale for all images) show the phase angle shift, which is indicative of material type. Phase angle shift images were superimposed on top of the reciprocal 3D height images without any image color manipulations.
2.4.6. In vitro release experiments
In order to assess the release profile of DW NPs, insulin (zinc bovine insulin) was used as model drug. The chosen core polymer was PLGA with PBMAD coating as the shell. As previously published by the Mathiowitz group, PBMAD is a well-known bioadhesive polymer that can increase permeability through the GI tract; in addition, it is soluble at pH 7 while insoluble at lower pH (can act as enteric coating) [8,9,16,26]. Therefore, the release experiments were first conducted in a buffer solution with pH of 3, then moved after 4 hours into PBS solution (pH 7.4). Samples were taken immediately (zero-time point) after suspending about 20 mg of DW NPs in 1.3 mL of a buffer solution (pH3) and also after 2 h and 4 h. Then, the medium was replaced with PBS (pH 7.4), and additional samples were taken after 5 h, 6 h, 24 h, 72 h, 168 h, 240 h, 408 h, 1080 h, 1344 h, and 1560 h (65 days). 0.9 mL samples were taken at each time point and replenished with 0.9 mL of the appropriate medium, only at the aforementioned time points. PBS and pH 3 buffers were used to maintain the pH of the solutions during the release experiments. Samples were collected by centrifugation at 10000g for 8 min at 4°C and the supernatant collected for analysis. All samples were analyzed by liquid chromatography-mass spectrometry (LC-MS) for insulin content. HPLC was used at laminar flow chromatography using Shimadzu LC-10ADVP pumps and a CTC Analytics HTC PAL autosampler with analytical column (TSKgel UP-SW3000, 2 μm, 4.6 mm × 15 cm), running at 0.3 mL/min isocratic flow of HPLC Grade Acetonitrile with 0.1% Formic acid (v/v). Samples were kept at a temperature range of 2–8°C, 14 minutes run where insulin peak appeared at 6.7 ±0.3 min. The HPLC column was coupled to the mass spectrometer equipped with a TurboV interface. Tandem-mass spectrometry (MS/MS) was performed on a triple stage quadrupole from SCIEX API 4000 Qtrap (Concord, Ontario, Canada) with an atmospheric pressure ionization (API) chamber. The gas used for nebulizer, curtain, collision and turbo gases was from a single nitrogen source with a gas manifold. The mode of operation was positive ion with enhanced product ion (EPI) scan of 956.6 amu to a suitable daughter ion. Scan range was 500–1500 amu with a scanning time of 1.0001 ms.
3. Results and Discussion
3.1. Cloud Point Detection
The most critical step in the formation of the DW microsphere is identifying the cloud point. After many experimental trials, it was decided to work with 2% w/v polymeric solutions. The polymers were each dissolved in THF and ethanol was added as non-solvent until the cloud point was reached. Ethanol was a non-solvent for the core polymer but a solvent for the shell polymers. The cloud points of PMMA, PLGA (50:50), PLGA (75:25) and D, L-PLA are presented in Table 1.
As indicated in Table 1, the cloud point of each core polymer solution was successfully induced with the addition of a sufficient volume of ethanol; each core polymer required a different ratio of ethanol due to their different solubility parameters.
Additionally, in order to confirm that the presence of the secondary shell polymer does not affect the cloud point of the core polymer, these tests were also performed using 2% solutions of the shell polymer in ethanol. The results indicated that the presence of the shell polymer in the system did not alter the cloud point for the core polymer.
3.2. Fabrication of DW Nanoparticles containing Insulin
Using the determined cloud point for each core polymer solution, a series of DW NPs with various core and shell polymer combinations were prepared. One such example is the coating of PLGA with PBMAD. For this core and shell pair, insulin was also used as the active material. Briefly, insulin was suspended and PLGA dissolved in THF. Then, the rapid addition of the core polymer + insulin solution to PBMAD in ethanol resulted in the phase separation of the PLGA as the suspended insulin served as nucleation centers. The solution turned turbid and cloudy while the amber colored PBMAD remained soluble in ethanol. This cloudy solution was immediately added to ~1 L of petroleum ether which resulted in the phase inversion of the PBMAD polymer around the already phase separated PLGA spheres serving as nucleation points (Figure 1, bottom). The final DW NPs were amber in color, which suggests that the PBMAD polymer is on the surface (Single-wall PLGA particles result in white colored particles). DW nanospheres were successfully prepared using this SSDN method to form NPs with various shell polymers and core polymers (see Table 2).
Table 2.
Glass transition temperatures (Tg) detected by DSC analysis of DW NPs prepared by SSDN method.
| Formulation | Thermal Analysis | ||
|---|---|---|---|
| Shell | Core | Tg1 (°C) | Tg2 (°C) |
| PBMAP | PMMA | 56.8 | 148.6 |
| PBMAT | PMMA | 53.4 | 162.0 |
| PBMAD | PMMA | 54.3 | 160.0 |
| PEMAP | PMMA | 59.9 | 167.5 |
| PEMAT | PMMA | 56.3 | 179.5 |
| PEMAD | PMMA | 55.3 | 175.0 |
| PBMAD | PLGA (50:50) | 42.3 | 132.6 |
| PBMAD | PLGA (75:25) | 49.4 | 159.2 |
| PBMAD | D,L-PLA | 46.2 | 147.7 |
| Pure PBMAD | 174.3 | ||
| Pure PLGA (75:25) | 42.7 | ||
| Pure PMMA | 159.6 | ||
| Pure PLA | 44.3 | ||
3.3. DW Nanoparticles Characterization
For this section, we focused on the PBMAD-shell/PLGA (75:25)-core formulation due to its beneficial features for drug delivery research as it is a well-known biodegradable and biocompatible polymer. Previous in vivo uptake studies consisting of the bioadhesive PBMAD-shell with a PMMA or PS-core revealed that uptake in the small intestine was greatly improved when coated with the bioadhesive PBMAD [9].
3.3.1. Particle Size Analysis
Analysis of size distribution was done using the PMMA core polymer with the different coating polymers used in this study. The results are presented in Figure 2.
Figure 2.

Coulter laser particle size analysis (volume weighted) of nanospheres prepared by SSDN with different shell polymers and PMMA cores in aquatic solution.
As can be seen in Figure 2, the laser diffraction particle size analysis revealed that the SSDN process using 2% w/v polymer solutions results in two main populations of NPs, one in the range of 500 nm and the other around 2 μm. The production of NPs in the 500 nm range is consistent with previous work in our lab preparing single-walled NPs using the PIN method, which revealed that particle size is directly related to the polymer solution viscosity, a function of polymer concentration [15]. This method requires the use of dilute polymer solutions to produce discrete spheres, typically less than 5% w/v. The secondary peak in the 2 μm range could either reflect the production of a polydisperse population of spheres or more likely, the presence of aggregates, which was further explored and shown by SEM analysis (see section 3.3.2). For a more monodispersed size ditrubution (resulting in lower yields) one could use centrifugation or refer to these separation by size methods [28–30].
3.3.2. Scanning Electron Microscopy
SEM micrographs of the various formulations tested are presented in Figure 3 (a–l). As seen in the scanning electron micrographs for the PLGA/PBMAD nanospheres (Figure 3, a–c), the SSDN process resulted in the formation of discrete nanospheres with an average particle diameter of ~500 nm. Note that the SEM was not used for proving the core and shell structure (see AFM section). As mentioned above, the SEM analysis revealed that aggregates were also formed (Figure 3a–l), as was suggested by the results of the laser diffraction particle size analysis (explaining the additional peak at ~2 μm). The formation of aggregates could be attributed to the adhesive nature of the shell polymers (e.g., PBMAD [26]). Another possibility could be the use of lyophilization as the final step in preparation which can also promote aggregation of nanospheres [8].
Figure 3.

Scanning electron micrographs of DW nanosphere formulations (a) PBMAD/PLGA (75:25), (b) PBMAD/PLGA (75:25), (c) PBMAD/PLGA (75:25), (d) PBMAD/PMMA 75:25, (e) PBMAD/PLGA (50:50), (f) PBMAD/D,L-PLA, 3000x, (g) PBMAP/PMMA 75:25, (h) PBMAT/PMMA 75:25, (i) PBMAD/PMMA 75:25, (j) PBMAP/PMMA 75:25, (k) PBMAT/PMMA 75:25, (l) PBMAP/PMMA 75:25; scale bars: 5 μm (a, d–l), 2.5 μm (b), 1.5 μm (c).
3.3.3. Differential Scanning Calorimetry Analysis
DSC analysis of the bulk (“pure”) polymers and manufactured DW NPs was performed in order to assess the existence of both polymers in the final powder (Table 2).
First, it should be noted again that DSC analysis does not provide information about the location of each polymer detected. The results presented in Table 2 show that two Tg were detected for all formulations – one corresponding to the core polymer and the other to the shell polymer. For example, pure PLGA (75:25) exhibited a Tg of 42.7°C with no Tm due to the amorphous nature of the polymer; pure PBMAD exhibited a Tg of 174.3°C, and no Tm was detected either. The PLGA/PBMAD DW NP formulation exhibited two Tg at 49.4°C and 159.2°C; the first can be assigned to the PLGA and the latter to the PBMAD.
The existence of these two Tg serves as proof for the existence of both polymers in the nanospheres as separated phases. It does not prove the formation of core shell structure. However, it does show that the two polymers are not forming a solid composition, since in that case one glass transition would have been observed. Another insight that can be deducted from the DSC analysis is the reduction in the Tg associated with PBMAD as well as the increase in Tg associated with PLGA. This might suggest that both the core and shell polymers are interacting and this may be occurring at the interface. Hence, the DSC results serve as an indirect evidence for the formation of two phases. The results of the AFM analysis (later in the paper) provide better analysis for the existence of the DW structure (section 3.3.5).
3.3.4. FTIR Analysis
FTIR analysis of the PBMAD/PLGA DW nanospheres, pure PLGA (core polymer), and pure PBMAD (shell polymer) interferogram were obtained, baseline corrected and presented in Figure 4 below.
Figure 4.

Fourier transform infrared spectroscopy (FTIR) analysis of PLGA (red), PBMAD (blue) and PBMAD-shell/PLGA-core (green) nanospheres; characteristic peaks have been identified and labeled.
Characteristic peaks were identified for the core polymer (PLGA) and the shell polymer (PBMAD) as well as their presence in the PBMAD-shell/PLGA-core DW formulation (Figure 4). Characteristic peaks include the ester bond for PLGA (1750 cm−1) and the anhydride bond of PBMAD (1700 cm−1) which are also present in the PBMAD/PLGA NPs. Additionally, the characteristic –CH2 stretch of PLGA (3000 cm−1) and the broad hydroxyl peak of the PBMAD (2400 – 3600 cm−1) are also present in the interferogram of the PBMAD/PLGA NPs. These results confirm the presence of both polymers within the DW NPs. FTIR may also provide information about whether the two polymers are interacting as has been shown in the case of chitosan-alginate NPs [31]. The shift of a characteristic peak indicates an interaction related to that moiety. For example, the PLGA ester bond peak (1750 cm−1) is shifted in the interferogram of the DW NPs; there is also a shift in the PBMAD anhydride peak (1700 cm−1) in the interferogram of the DW NPs. These shifts indicate an interaction between these two moieties of the core and shell polymers. The diminishment of the –OH peak of PBMAD and the ester peak of PLGA in the interferogram of the DW NPs might also suggest that the interaction between the two polymers is via hydrogen bonds of these two moieties (hydroxyl groups of the PBMAD; ester groups of the PLGA).
3.3.5. AFM analysis
AFM phase imaging was used to characterize the surface composition of the manufactured DW NPs. The AFM was chosen since one can directly observe the surface composition of the particles without any other coatings as required many times for SEM/TEM analysis. The first step for AFM analysis required attributing a specific phase angle shift to each polymer. In this way, one can get a real number that represents each polymer so identification of surfaces is more accurate when compared to other methods such as SEM or TEM. This phase shift will later allow identification of each polymer. AFM phase shift is derived from the difference in phase angle between the freely oscillating cantilever in the air and the cantilever oscillation during scanning [32]. The detection of phase angle shifts by AFM may provide enhanced image contrasts (usually reach 10 nm resolution [33]), especially when the sample is known or believed to be comprised of heterogeneous materials [34]. Phase angle shifts are the result of contact interactions between the cantilever and the surface of the sample. Differences in the stiffness and energy dissipation properties of materials will induce different phase angle shift, as has been shown in previous studies [21,35,36].
PLGA 75:25 coated with PBMAD was chosen as the model formulation for AFM analysis. First, the pure PLGA 75:25 and pure PBMAD nanospheres were analyzed in order to determine their phase angle shift (Figure 5A&B). Figure 5 shows the images of the phase angle shifts of the individual pure polymers as well as the phase angle shift image of the DW PLGA/PBMAD NPs (Figure 5C).
Figure 5.

AFM 3D images of NPs manufactured by the SSDN method (A) Pure PBMAD NPs (B) Pure PLGA 75:25 NPs, and (C) PBMAD/PLGA 75:25 DW NPs. XYZ axes represent scan size and NPs morphology while the purple-orange-yellow scale bar (same scale applied for all images) represent the phase angle shift data. Phase angle shift images were superimposed on top of the reciprocal 3D height images without any image color manipulations.
As was shown by others, AFM phase angle shift image can help analyze the surface morphology and distinguish between different polymers [37,38]. In Figure 5A&B, one can easily notice the difference in the angle shift for the two polymers. PLGA 75:25 is inducing angle shifts of about 120° and 80° (corresponding to the PLA block and PGA block, respectively), while PBMAD induces a lower phase angle shift of around 60°. The topography images show the spheres within the range of the size distribution measured for these particles by light scattering (526±24 nm and 486±60 nm). In Figure 5C the phase angle shift is showing a smooth and uniform surface, predominantly with an angle shift of 60–70° which is attributed to PBMAD. Hence, it means the surface (i.e. shell) of the DW NPs is PBMAD. Furthermore, the same surface material was observed for all imaged of DW NPs, suggesting a highly consistent process that does not inadvertently form single-polymer NPs.
The FTIR and DSC analysis of the PLGA 75:25/PBMAD NPs showed that two polymers were detected in the final sample while the AFM phase angle shift images showed that only one type of polymer exists on the surface. Hence one can easily deduct that the SSDN protocol does produce a DW structure with one polymer dominant in the shell. It is however imperative to note that since these are not cross sections of the NPs, one cannot determine whether the exact structure is core and shell or a shell and blend inside. Thus, in order to elucidate the structure of the SSDN particles, 20 mg of the manufactured DW NPs were exposed to 1 mL of a high pH solution (pH=10) for 15 minutes. Since PBMAD easily dissolves at this pH while PLGA does not, this exposure should provide additional insights into what lies beneath the PBMAD. AFM was used to image DW NPs before and after exposure to high pH. (Figure 6). This type of study could only be done by AFM since without any additional manipulation one can identify the surface by the phase shift which is a real quantitative measure of surface properties.
As mentioned, PBMAD is soluble at pH=10, hence exposure to this pH should reveal what is beneath the PBMAD surface. In Figure 6B one can see that the pure PLGA 75:25 NPs were not affected by exposure to high pH (=10) when compared to Figure 6A where the pure PLGA NPs were not exposed to high pH which proves that PLGA 75:25 is not affected by exposure to basic solution. When comparing Figure 6C (unexposed DW NPs) to Figure 6D (exposed to high pH DW NPs), one can notice the surface phase shift of 60–70° (indicative of PBMAD according to Figure 5A) to 110–120° which is indicative of pure PLGA 75:25 (as shown in Figure 5B). The DW NP post exposure (Figure 6D) to high pH (=10) solution exhibit a smooth uniform surface with phase angle shift of 110–120° (indicative of PLGA 75:25) which suggests that the DW NPs structure is a core composed of PLGA 75:25 and a shell composed of PBMAD. These methods show in a compelling manner that the DW NPs are indeed core-shell structure.
3.3.6. Insulin release from DW nanoparticle PLGA-PBMAD
In order to assess the use of this method for drug delivery purposes, insulin-loaded PLGA-core PBMAD-shell DW NPs were manufactured utilizing the SSDN method and the in vitro release profile of insulin evaluated (see section 2.4.6 for full details). Insulin theoretical loading was 5% (w/w) with 67% loading efficiency (resulting with 3.3% actual loading, derived from the release profile). The results are shown in Figure 7.
Figure 7.
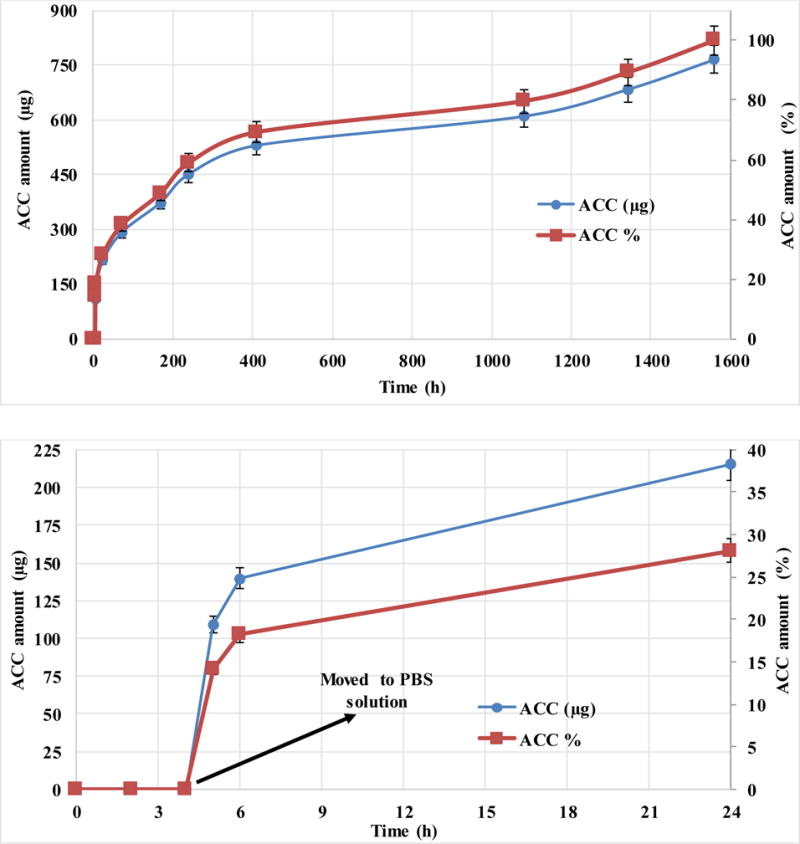
Accumulated release profile of total insulin mass (μg, left Y-axis) and by percentage (%, right Y-axis) versus time of zinc bovine insulin from DW NPs of PLGA-core and PBMAD-shell. Theoretical loading was 5% (actual loading was 3.3%). The top figure shows the full-time scale of the experiment while the bottom image is just the first 24 hours of release (for better visualization of the profile). Values represent the average of three repeats with their respective standard deviations.
Figure 7A shows the full-time scale of the experiment while Figure 7B image is just the first 24 hours of release (for better visualization of the profile). Values represent the average of three repeats with their respective standard deviations.
The release of insulin from the DW NPs shows zero release for the first 4 hours at pH of 3 (where insulin is very soluble), and then approximately 30% release after 24 hr. The lack of release in the first 4 hours indicates that the insulin is not exposed on the surface (PBMAD is not soluble at pH 3 but insulin is very soluble at this pH). These results also show the ability of the PBMAD to resist dissolution at low pH as the first 4 hours showed zero release, then releasing almost immediately when exposed to PBS solution, with continued release for over two months (65 days). The release profile shows three stages of release. The first is the “fast” almost linear release for about two weeks (16 days) of 70% of the total amount of insulin inside, implying that these particles provide almost zero-order release kinetics. In the second stage (16–45 days), almost no insulin is released for 30 days, ending with a “slow” insulin release for 20 days (further time points were taken up to 4 months where no additional release was observed (results not plotted for better visualization). This kind of release profile suggests that the insulin is also encapsulated within the PLGA core and is released only when the PLGA itself starts to fully degrade. Additionally, these results show that this method could easily be utilized for drug delivery purposes, specifically oral drug delivery.
The preparation of DW NPs by SSDN is a shorter process which relies on phase separation and sequential precipitation phenomena resulting in a distinct core-shell structure. By engineering all components involved we can control which of the polymers will precipitate first to serve as the core polymer and which will be the second to precipitate to serve as the shell polymer. This method relies on the phase separation of polymers in solution upon addition of a non-solvent. Therefore, the formation of nanospheres is instantaneous and requires no shear forces, which is further beneficial for the preservation of bioactivity when encapsulating sensitive therapeutic agents, such as proteins or genetic material. SSDN is an extremely useful encapsulation method for manufacturing DW NPs, however there are some limitations and specific requirements. The resulting NPs are not monodispersed and additional methods are required to obtain a more homogeneous distribution (as discussed previously). Also, since harsh organic solvents are used throughout the process, pharmaceuticals which are sensitive to these solvents might not be suited for this method. SSDN requires carefully selected solvents and the cloud point should be found for each two polymers/solvents systems. In order to successfully manufacture DW NPs the solvent for the core polymer must be a solvent for the shell polymer as well. In addition, the solvent for the shell polymer must be a good solvent only for the shell polymer but a non-solvent for the core polymer. These two solvents must also be miscible. Lastly, the third medium must be a strong non-solvent for both polymers in addition to being miscible with the other two solvents. The third solvent should be used in an excess of at least 1:40. Thus, to preferentially create the core of the NPs, the two dilute polymer solutions are mixed together at the appropriate experimentally determined ratio (cloud points) thus forming a cloudy suspension of phase separated core polymer. The rapid addition of this cloudy suspension to an excess of a non-solvent for both polymers results in the diffusion of the solvents into the continuous phase of the excess non-solvent causing the spontaneous, nearly instantaneous self-assembly of DW NPs as the core polymer droplets serve as nucleation points for the shell polymer. The core thickness could be easily controlled by reducing the mass used of the core polymer. For drug delivery purposes, the active material could be added to the system before the cloud point is reached as was described for the encapsulation of insulin.
4. Conclusions
This paper demonstrates the robustness of the SSDN encapsulation process by using several polymers to create various core/shell formulations. SSDN requires the selection of two polymer/solvent pairs that allow controlled sequential phase inversion of each polymer. In this study, general guidelines and methods for producing these NPs are described. First, solubility tests must be performed to ensure the proper solvents ratios and polymer concentrations are used. This method has the potential for encapsulating pharmaceutical agents with less drug loss by adding them to the core polymer solution as was shown for the PIN method [8,9,15,16,26,39,40]. This potential has been tested with insulin in PLGA (core)-PBMAD (shell) DW NPs which showed release for up to two months. This method may also be advantageous to produce drug encapsulating NPs with core-shell morphologies in a single step through a rapid, spontaneous, and self-assembly process.
Acknowledgments
This work was supported in part by an award from the National Institute of Health (P20 GM104937, EMD). This work was also sponsored in part by Takeda Pharmaceuticals.
Footnotes
Publisher's Disclaimer: This is a PDF file of an unedited manuscript that has been accepted for publication. As a service to our customers we are providing this early version of the manuscript. The manuscript will undergo copyediting, typesetting, and review of the resulting proof before it is published in its final citable form. Please note that during the production process errors may be discovered which could affect the content, and all legal disclaimers that apply to the journal pertain.
6. Reference List
- 1.Freiberg S, Zhu X. Polymer microspheres for controlled drug release. Int J Pharm. 2004;282:1–18. doi: 10.1016/j.ijpharm.2004.04.013. [DOI] [PubMed] [Google Scholar]
- 2.Tan EC, Lin R, Wang C. Fabrication of double-walled microspheres for the sustained release of doxorubicin. J Colloid Interface Sci. 2005;291:135–143. doi: 10.1016/j.jcis.2005.04.089. [DOI] [PubMed] [Google Scholar]
- 3.Pekarek KJ, Jacob JS, Mathiowitz E. Double-walled polymer microspheres for controlled drug release. Nature. 1994;367:258–260. doi: 10.1038/367258a0. [DOI] [PubMed] [Google Scholar]
- 4.Xu Q, Xia Y, Wang C, Pack DW. Monodisperse double-walled microspheres loaded with chitosan-p53 nanoparticles and doxorubicin for combined gene therapy and chemotherapy. J Controlled Release. 2012;163:130–135. doi: 10.1016/j.jconrel.2012.08.032. [DOI] [PMC free article] [PubMed] [Google Scholar]
- 5.Leach K. Effect of manufacturing conditions on the formation of double-walled polymer microspheres. J Microencapsul. 1999;16:153–167. doi: 10.1080/026520499289149. [DOI] [PubMed] [Google Scholar]
- 6.Leach KJP, Mathiowitz E. Degradation of double-walled polymer microspheres of PLLA and P (CPP: SA) 20: 80. I. In vitro degradation. Biomaterials. 1998;19:1973–1980. doi: 10.1016/s0142-9612(98)00108-2. [DOI] [PubMed] [Google Scholar]
- 7.Pekarek KJ, Jacob JS, Mathiowitz E. One‐step preparation of double‐walled microspheres. Adv Mater. 1994;6:684–687. [Google Scholar]
- 8.Reineke JJ, Cho DY, Dingle YT, Morello AP, 3rd, Jacob J, Thanos CG, Mathiowitz E. Unique insights into the intestinal absorption, transit, and subsequent biodistribution of polymer-derived microspheres. Proc Natl Acad Sci U S A. 2013;110:13803–13808. doi: 10.1073/pnas.1305882110. [DOI] [PMC free article] [PubMed] [Google Scholar]
- 9.Reineke J, Cho D, Dingle Y, Cheifetz P, Laulicht B, Lavin D, Furtado S, Mathiowitz E. Can bioadhesive nanoparticles allow for more effective particle uptake from the small intestine? J Controlled Release. 2013;170:477–484. doi: 10.1016/j.jconrel.2013.05.043. [DOI] [PubMed] [Google Scholar]
- 10.Thanos C, Yip K, Mathiowitz E. Intestinal uptake of polymer microspheres in the rabbit studied with confocal microscopy. J Bioact Compatible Polym. 2004;19:247–266. [Google Scholar]
- 11.Agüeros M, Zabaleta V, Espuelas S, Campanero M, Irache J. Increased oral bioavailability of paclitaxel by its encapsulation through complex formation with cyclodextrins in poly (anhydride) nanoparticles. J Controlled Release. 2010;145:2–8. doi: 10.1016/j.jconrel.2010.03.012. [DOI] [PubMed] [Google Scholar]
- 12.Jha RK, Tiwari S, Mishra B. Bioadhesive microspheres for bioavailability enhancement of raloxifene hydrochloride: formulation and pharmacokinetic evaluation. AAPS PharmSciTech. 2011;12:650–657. doi: 10.1208/s12249-011-9619-9. [DOI] [PMC free article] [PubMed] [Google Scholar]
- 13.Chinna Reddy P, Chaitanya KS, Madhusudan Rao Y. A review on bioadhesive buccal drug delivery systems: current status of formulation and evaluation methods. Daru. 2011;19:385–403. [PMC free article] [PubMed] [Google Scholar]
- 14.Shaikh R, Raj Singh TR, Garland MJ, Woolfson AD, Donnelly RF. Mucoadhesive drug delivery systems. J Pharm Bioallied Sci. 2011;3:89–100. doi: 10.4103/0975-7406.76478. [DOI] [PMC free article] [PubMed] [Google Scholar]
- 15.Jacob JS, Mathiowitz E. A Novel Mechanism for Spontaneous Encapsulation of Active Agents: Phase Inversion Nanoencapsulation. Carrier-based drug delivery. 2004:214–223. [Google Scholar]
- 16.Mathiowitz E, Jacob JS, Jong YS, Carino GP, Chickering DE, Chaturvedi P, Santos CA, Vijayaraghavan K, Montgomery S, Bassett M. Biologically erodable microspheres as potential oral drug delivery systems. Nature. 1997;386:410–414. doi: 10.1038/386410a0. [DOI] [PubMed] [Google Scholar]
- 17.Yang Y, Chung T, Bai X, Chan W. Effect of preparation conditions on morphology and release profiles of biodegradable polymeric microspheres containing protein fabricated by double-emulsion method. Chemical Engineering Science. 2000;55:2223–2236. [Google Scholar]
- 18.Zheng W. A water-in-oil-in-oil-in-water (W/O/O/W) method for producing drug-releasing, double-walled microspheres. Int J Pharm. 2009;374:90–95. doi: 10.1016/j.ijpharm.2009.03.015. [DOI] [PubMed] [Google Scholar]
- 19.Rahman N, Mathiowitz E. Localization of bovine serum albumin in double-walled microspheres. J Controlled Release. 2004;94:163–175. doi: 10.1016/j.jconrel.2003.10.010. [DOI] [PubMed] [Google Scholar]
- 20.Lee WL, Seh YC, Widjaja E, Chong HC, Tan NS, Loo J, Chye S. Fabrication and drug release study of double‐layered microparticles of various sizes. J Pharm Sci. 2012;101:2787–2797. doi: 10.1002/jps.23191. [DOI] [PubMed] [Google Scholar]
- 21.Berkland C, Cox A, Kim KK, Pack DW. Three‐month, zero‐order piroxicam release from monodispersed double‐walled microspheres of controlled shell thickness. Journal of Biomedical Materials Research Part A. 2004;70:576–584. doi: 10.1002/jbm.a.30114. [DOI] [PubMed] [Google Scholar]
- 22.Berkland C, Pollauf E, Pack DW, Kim KK. Uniform double-walled polymer microspheres of controllable shell thickness. J Controlled Release. 2004;96:101–111. doi: 10.1016/j.jconrel.2004.01.018. [DOI] [PubMed] [Google Scholar]
- 23.Berkland C, Pollauf E, Varde N, Pack DW, Kim KK. Monodisperse liquid-filled biodegradable microcapsules. Pharm Res. 2007;24:1007–1013. doi: 10.1007/s11095-006-9197-9. [DOI] [PubMed] [Google Scholar]
- 24.Lee WL, Widjaja E, Loo SCJ. One‐Step Fabrication of Triple‐Layered Polymeric Microparticles with Layer Localization of Drugs as a Novel Drug‐Delivery System. Small. 2010;6:1003–1011. doi: 10.1002/smll.200901985. [DOI] [PubMed] [Google Scholar]
- 25.Lee WL, Loo SCJ. Revolutionizing drug delivery through biodegradable multilayered particles. J Drug Target. 2012;20:633–647. doi: 10.3109/1061186X.2012.702772. [DOI] [PubMed] [Google Scholar]
- 26.Laulicht B, Mancini A, Geman N, Cho D, Estrellas K, Furtado S, Hopson R, Tripathi A, Mathiowitz E. Bioinspired Bioadhesive Polymers: Dopa‐Modified Poly (acrylic acid) Derivatives. Macromolecular bioscience. 2012;12:1555–1565. doi: 10.1002/mabi.201200179. [DOI] [PubMed] [Google Scholar]
- 27.Seidel A. Characterization and Analysis of Polymers. John Wiley & Sons; 2008. [Google Scholar]
- 28.Isaacson CW, Bouchard D. Asymmetric flow field flow fractionation of aqueous C60 nanoparticles with size determination by dynamic light scattering and quantification by liquid chromatography atmospheric pressure photo-ionization mass spectrometry. Journal of Chromatography A. 2010;1217:1506–1512. doi: 10.1016/j.chroma.2009.12.060. [DOI] [PubMed] [Google Scholar]
- 29.Lal A, Lee CH. Method and apparatus for separating particles by size. 2006 [Google Scholar]
- 30.Conrad WE, Petersen D. Apparatus and method for separating particles from a cyclonic fluid flow. 2001 [Google Scholar]
- 31.Sarmento B, Ferreira D, Veiga F, Ribeiro A. Characterization of insulin-loaded alginate nanoparticles produced by ionotropic pre-gelation through DSC and FTIR studies. Carbohydr Polym. 2006;66:1–7. [Google Scholar]
- 32.Boussu K, Van der Bruggen B, Volodin A, Snauwaert J, Van Haesendonck C, Vandecasteele C. Roughness and hydrophobicity studies of nanofiltration membranes using different modes of AFM. J Colloid Interface Sci. 2005;286:632–638. doi: 10.1016/j.jcis.2005.01.095. [DOI] [PubMed] [Google Scholar]
- 33.I. Advanced Surface Microscopy. Phase imaging/Chemical Mapping [Google Scholar]
- 34.Bar G, Thomann Y, Brandsch R, Cantow H, Whangbo M. Factors affecting the height and phase images in tapping mode atomic force microscopy. Study of phase-separated polymer blends of poly (ethene-co-styrene) and poly (2, 6-dimethyl-1, 4-phenylene oxide) Langmuir. 1997;13:3807–3812. [Google Scholar]
- 35.Pereira D, Chernoff D, Claudio-da-Silva E, Jr, Demuner B. The use of AFM to investigate the delignification process: Part I-AFM performance by differentiating pulping processes. ATIP.Association technique de l’industrie papetière. 2001;55:6–12. [Google Scholar]
- 36.Cleveland J, Anczykowski B, Schmid A, Elings V. Energy dissipation in tapping-mode atomic force microscopy. Appl Phys Lett. 1998;72:2613–2615. [Google Scholar]
- 37.Chen X, McGurk S, Davies M, Roberts C, Shakesheff K, Tendler S, Williams P, Davies J, Dawkes A, Domb A. Chemical and morphological analysis of surface enrichment in a biodegradable polymer blend by phase-detection imaging atomic force microscopy. Macromolecules. 1998;31:2278–2283. [Google Scholar]
- 38.Ye Z, Zhao X. Phase imaging atomic force microscopy in the characterization of biomaterials. J Microsc. 2010;238:27–35. doi: 10.1111/j.1365-2818.2009.03282.x. [DOI] [PubMed] [Google Scholar]
- 39.Carino GP, Jacob JS, Mathiowitz E. Nanosphere based oral insulin delivery. J Controlled Release. 2000;65:261–269. doi: 10.1016/s0168-3659(99)00247-3. [DOI] [PubMed] [Google Scholar]
- 40.Sandor M, Enscore D, Weston P, Mathiowitz E. Effect of protein molecular weight on release from micron-sized PLGA microspheres. J Controlled Release. 2001;76:297–311. doi: 10.1016/s0168-3659(01)00446-1. [DOI] [PubMed] [Google Scholar]