

Abstract
Diverse genetic and environmental etiologies converge onto circuit level brain dysfunction in autism spectrum disorder (ASD), manifesting at a macroscopic level as aberrant neural connectivity. Previous studies have described atypical patterns of decreased short range and increased long range connectivity in ASD [1]. However, it remains unclear whether group level features of circuit dysfunction are consistently present across the range of cognitive function seen in the autism spectrum.
The dynamics of neural oscillations in the alpha range (6-12 Hz) are exquisitely sensitive to healthy development of functional and structural connectivity. Alpha-band coherence, measured with high temporal-precision electroencephalography (EEG) therefore represents an ideal tool for studying neural connectivity in developmental populations.
Here we examined spontaneous alpha phase coherence in a heterogeneous sample of 59 children with ASD and 39 age matched typically developing children. Using a data driven approach, we conducted an unbiased examination of all possible atypical connectivity patterns across all cortical regions.
Long-range hypoconnectivity was present in children with ASD compared to typically developing children, with temporal interhemispheric connectivity showing the largest difference between the two groups. Decreased long range alpha coherence distinguishes a heterogeneous group of ASD children from typically developing children. Interhemispheric temporal hypoconnectivity represents a fundamental functional difference in children with ASD across a wide cognitive and age range that may reflect white matter disturbances or increased signal variability at temporal sites in ASD.
Keywords: autism, electroencephalography, alpha, neural connectivity, development, circuit dysfunction
1. Introduction
1.1
Autism spectrum disorder (ASD) is a neurodevelopmental condition characterized by core features of social communication impairment, repetitive behaviors and restricted interests. Like many neurodevelopmental disorders, ASD is rooted in aberrant neural connectivity, coined by Geschwind and Levitt as a “developmental disconnection syndrome” [2]. Neuroimaging studies of high risk infants demonstrate early disruptions in the development of both structural and functional connectivity precede the emergence of core symptoms in ASD [3–6].
1.2
Various functional and structural imaging methods have been used to quantify spontaneous, or baseline, neural connectivity in ASD and to compare these patterns to those of typically developing individuals. Across studies, a pattern of short range hyperconnectivity and long range hypoconnectivity has emerged [1,7,8]. However, two major gaps exist in this body of research. First, most studies have focused on the individuals with cognitive abilities in the typical range [9], thus excluding the large portion of the ASD population with co-occurring cognitive impairment [10–13]. Secondly, studies often focus on prespecified, putative networks of interest, such as brain regions involved in language function or social cognition [14,15]. Such a targeted approach may preclude the discovery of unexpected differences in meaningful circuits.
1.3
EEG represents a unique and powerful tool that can capture brain dynamics in three important dimensions: space, time and frequency [16]. The complex and multidimensional aspects of brain function that EEG captures may reflect changes in many underlying neurobiological processes, from molecular and cellular changes to large scale structural development. Sensitivity to small alterations in any of these dimensions facilitates the detection of neurophysiological patterns associated with both typical and atypical development. EEG also represents a relatively tolerable and scalable research tool to quantify functional connectivity in diverse populations [17].
1.4
Of the oscillatory activity underlying large-scale functional networks, coherence in the alpha band (6-12 Hz) is exquisitely sensitive to the healthy development of [18,19], and disruptions to [20], functional and structural connectivity. Alpha oscillations are the dominant signal in the resting brain and therefore yield a high signal to noise ratio in stimulus independent environments [21,22].
Here, we used an electroencephalography (EEG) measures of alpha band phase coherence to quantify functional connectivity in children with ASD across a wide range of cognitive abilities. Employing permutation testing and strict false discovery rate (FDR) control, we studied alpha band coherence between all possible combinations of electrode pairs. This statistical approach obviates the need for a priori assumptions regarding connectivity patterns and allows for an unbiased interrogation of functional interactions in the alpha band across all brain regions.
Coherence is an estimate of the consistency between two neural signals within a particular frequency band, and it depends on both phase consistency and amplitude covariations [23]. Amplitude can be influenced by non-neural anatomical factors, such as skull thickness [24], or by structural brain differences including cortical gyral patterns [25]. These factors can, in turn, bias coherence estimates [25,26]. Therefore, we measured the phase synchrony of signals, which provides a measure of synchronization in the EEG that is independent of signal amplitude [23,27].
1.5
We hypothesized that (1) children with ASD would exhibit different patterns of alpha band coherence compared to typically developing (TD) children, particularly in long range networks; and, based on previously reported correlations between alpha band oscillations and cognitive function in ASD [28], we also hypothesized that (2) the network connections that differentiate ASD from TD would relate to cognitive ability, with disruptions in functional connectivity related to cognitive impairment within ASD.
2. Method
2.1. Participants
Sixty-one children with ASD were recruited from the community through the UCLA Center for Autism Research and Treatment (CART). Datasets from participants were pooled across two major studies in order to maximize sample size and reflect a clinically representative range of cognitive function across the autism spectrum. All children entered the study with a prior clinical diagnosis of ASD, made through the California State Regional Center, independent clinical psychologists, child psychiatrists, and/or developmental pediatricians. UCLA psychologists confirmed diagnoses based on DSM-IV or DSM-5 criteria. Exclusionary criteria for children with ASD included active epilepsy, birth-related complications, and uncorrected vision or hearing impairment. Secondary diagnoses were present in seven ASD participants, which included attention-deficit/hyperactivity disorder (ADHD; N=5), obsessive compulsive disorder (OCD; N=1), and depression (N=1). At the time of the study, five participants with ASD were taking psychoactive medication, which included: selective serotonin reuptake inhibitors (SSRI) (N=2); stimulants (N=1); partial dopamine antagonist (N=2); and central alpha agonists (N=2). Analyses were repeated after removing participants taking medication at the time of the study, with no significant difference in primary measures of interest. Therefore, the results presented here include those taking medication.
Forty typically developing (TD) age-and sex-matched participants were recruited from the community. Exclusionary criteria for TD participants included any neurological abnormalities, birth-related complications, developmental delays, need for special services in school, diagnosis of psychiatric conditions, uncorrected vision or hearing impairment, or a first degree relative with an ASD diagnosis. No TD children were taking psychoactive medications at the time of the study.
The study received ethical approval from the UCLA institutional review board (IRB numbers:14-001259; 11-000355). Parents provided informed written consent, in accordance with the declaration of Helsinki. Verbal assent was obtained from participants who had sufficient cognitive and language capabilities to understand and agree to the study procedures. Testing was suspended if non-verbal participants became agitated or distressed (e.g. crying, vocal protest). If, following a break, the participant was still distressed, then testing was discontinued.
Two participants with ASD and one TD participant were excluded from further analyses due to excessive artifact throughout the EEG recording (c.f. [28,29]. The final groups included 59 children with ASD and 39 TD children. Verbal and non-verbal IQ (as assessed with standardized tests, described below) were significantly lower in the ASD group, as would be expected when representing the full spectrum of cognitive ability in ASD. See table 1 for demographic variables. Data from these participants have also been reported in a previous study conducted by our research group [28].
Table 1.
Demographic variables of participants.
| Measure | ASD | TD | Group Comparison |
|---|---|---|---|
|
| |||
| M(SD), range or number (%) | M(SD), range or number (%) | Student’s t or X2 P value | |
| Age (months) | 69.44(24.12), 25–126 | 71.56(26.58), 29–146 | 0.68 |
| Sex (N females) | 13 (22) | 13 (33.3) | 0.16 |
| VIQ | 68.96(34.35), 12–160 | 121.12(19.42), 82–168 | <0.001 |
| NVIQ | 74.67(33.82), 10–145 | 112.55(12.07), 88–156 | <0.001 |
2.2. Behavioral assessments
Cognitive and language assessments were tailored to the ability and age of the child, and ratio IQ was used to facilitate comparison across assessments. Assessments included the Mullen Scales of Early Learning (MSEL; [30], the Differential Abilities Scale-Second Edition (DAS-II; [31]), and the Wechsler Preschool and Primary Scale of Intelligence-Third Edition (WPPSI-III; [32]). From these measures, ratio IQ scores for non-verbal IQ (NVIQ) and verbal IQ (VIQ) were calculated for each child and were used to account for the scores of children who performed outside of the standardized norms for their chronological age. For children who were tested with the WPPSI-III or DAS-II, NVIQ and VIQ were calculated from the protocol-specific subscores. For children who were administered the MSEL, VIQ was calculated using the average of the Receptive Language and Expressive Language subscale scores, and NVIQ was calculated using the average of the Visual Reception and Fine Motor subscale scores [33]. Studies have demonstrated the convergent validity of the WPPSI-III with other cognitive assessments such as the MSEL and the DAS-II, supporting the combination of assessments through standard scores [34–36].
Autism symptoms were assessed in the ASD group using multiple measures due to participants being pooled across two studies conducted by CART in order to represent all levels of cognitive function present in the autism spectrum. Modules one and two of the Autism Diagnostic Observation Schedule (ADOS; [37]) were used to assess communication and social interaction in a subset of participants with ASD (42.4%). Calibrated severity scores are used across modules to assess the severity of autism specific behaviors [38]. The social communication questionnaire (SCQ) was also administered to the same subset of participants who underwent ADOS assessment (42.4%). The SCQ is a 40-item parent-report questionnaire designed to assess the presence of behaviors in three main domains: reciprocal social interaction, language and communication and repetitive and stereotyped patterns of behaviors [39]. The Social Responsiveness Scale (SRS-1) was administered to a separate subset of participants (23.7%). The parent-report version of this 65-item questionnaire measures the severity of social impairment in ASD, with increased scores indicating a higher severity of ASD symptomology [40].
2.3. EEG recording
EEG was recorded for two minutes in a dark, sound-attenuated room while (auditory-free) bubbles were displayed on a computer screen. Due to the young age of the children and the wide range of cognitive and language abilities, it was not possible to gather spontaneous data under ‘eyes-closed’ conditions. Therefore, consistent with many other studies in developmental populations, we presented this passive visual stimulus while recording EEG [17,29,41–43].
2.4. EEG Acquisition and Processing
Continuous EEG data were recorded using a high density 128-channel HydroCel Geodesic Sensor Net (Electrical Geodesics Inc., Eugene, OR). Four electrodes positioned to record electrooculogram (EOG) (located below and lateral to the eyes) were removed from the net in order to increase comfort. Net Station 4.4.5 software was used to record from a Net Amps 300 amplifier with a low-pass analog filter cutoff frequency of 6 KHz. Data were sampled at 500Hz and referenced to vertex at the time of recording. Electrode impedances were kept below 100 KΩ.
All offline data processing and analyses were performed using EEGLAB (Delorme & Makeig, 2004), and in-house MATLAB scripts. Data were high pass filtered to remove frequencies below 1Hz and low pass filtered to remove frequencies above 100Hz, using a finite impulse response filter implemented in EEGLAB. Continuous data were then visually inspected, and noisy channels were removed. Following channel removal, data were interpolated to the international 10-20 system 25 channel montage [44]. Sections of data that showed electromyogram (EMG) or other non-stereotyped artifacts were then removed from the recording.
Independent component analysis (ICA), a statistical blind source separation technique [45], was implemented to remove EOG and other stereotyped artifacts from the data. After decomposing the data into maximally independent components (IC), the scalp topography and time course of each IC was visually inspected. Any IC that represented a non-neural source (including EMG, EOG and line noise) was removed from the data. The experimenter was blinded to participant details (including diagnostic category) throughout the data cleaning process.
Data were then separated into three-second epochs. This epoch length was chosen based on a previous exploration of phase coherence measures in spontaneous EEG recordings, which demonstrates that longer epochs represent higher stability in such data [46]. The minimum amount of artifact free data available across participants was 38 seconds. When computing phase coherence estimates, it is important to use an equal amount of data across all participants. Thus 36 seconds provided the minimum number of 3-second epochs (12 epochs). While this data length represents an appropriate minimum threshold to gain reliable estimates of the characteristics of spontaneous EEG [28,47]. However, it should be noted that a longer length of recording (and consequently, an increased number of epochs) would provide more reliable measures of phase coherence. Due to the nature of the sample in the current study, a minimum amount of data was used in order to retain as many participants as possible in our analyses.
2.5. Volume conduction
The contribution of multiple neural sources to the EEG signal measured at the scalp is dependent not only on neural source location and electrode location but also on volume conduction, which reflects the propagation of electric current from the cortex to scalp electrodes [48,49]. The spatial blurring introduced by volume conduction is particularly relevant to connectivity analyses, which seek to detect and quantify neural interactions between brain regions based on separate measurements. The non-neural spreading of signal through tissue which separates sources and electrodes falsely inflates estimates of coherence [48], particularly for electrodes positioned closely in space [50].
One way to minimize the effects of volume conduction on scalp recorded potentials prior to analysis is by applying a reference-free surface Laplacian transform. The surface Laplacian is the second spatial derivative of the scalp recorded potentials for each electrode, thus transforming the scalp-recorded EEG into estimates of current source density (CSD [51]. The surface Laplacian isolates the source activity under each electrode. Therefore, CSD captures the unique properties of each electrode while minimizing activity that is broadly distributed across multiple electrodes. Implementing a surface Laplacian after ICA has also been shown to attenuate EMG across the entire scalp and over a wide range of frequencies, which is extremely valuable in developmental populations [52].
2.6. Coherence Analysis
Cleaned EEG data were transformed into CSD by applying a spherical spline Laplacian transform with medium spline flexibility (m = 3) [53,54]. The spline flexibility reflects the degree to which spherical spline functions can be deformed to produce continuous interpolation, and this flexibility constant has adequate flexibility to prevent distortion of the original data [51]. Laplacian transform was implemented using the CSD toolbox [55].
Coherence analyses were then conducted on CSD values. CSD values were decomposed into frequency-time domain using Fast Fourier Transform with a fixed Hanning-tapered window size of 1024 samples to generate a sequence of amplitude and phase components for each frequency bin (approximately 0.25Hz resolution) Due to the hypothesis of the present study, analysis of connectivity was restricted to the alpha range, defined here as 6-12Hz, a commonly used range in young children [56,57]. Analysis of peak alpha frequency for each participant confirmed that alpha peaks occurred within this 6-12 Hz range [28].
Coherence was then computed in the form of event-related phase coherence (ERPCOH) from the aforementioned resting state epochs (for each frequency bin) using the newcrossf function provided by eeglab [58]:
, where represents the spectral estimate of channel a in trial k at frequency f and time t. is the complex conjugate of <at>. [58].
For each channel pair, phase coherence value was calculated by averaging ERPCOH of all latencies and of all the frequency bins encompassed by alpha band, resulting in 300 unique average alpha coherence values for every possible electrode pair. These coherence values for each group are illustrated in figure 1.
Figure 1.
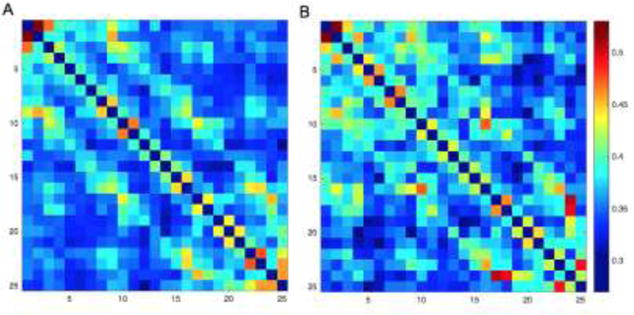
Coherence matrices for the A) ASD group and B) TD group, demonstrating increased phase coherence in the TD group for many electrode pairs.
3. Results
3.1. Group comparisons
Instead of selecting predefined regions of interest for analysis, we took an unbiased, data-driven approach to examine alpha coherence across the entire scalp. Significant group differences in alpha coherence values among the 300 electrode pairs were examined using test statistics which represented normalized differences in group means. A permutation test, where group labels were randomly assigned to subjects in each resample, was used to estimate the distribution of the test statistics. A non-parametric permutation test was employed, as it makes no assumptions about the data (including the shape of the distribution). The permutation test used 100,000 permutations to reach high stability in the results. False discovery rate (FDR) was applied to adjust for multiple testing of group differences in the coherence of 300 electrode pairs.
Several electrode pairs were found to be significantly altered in ASD compared to TD children. These electrode pairs are illustrated in figure 2, and they were visualized using Surf Ice [59]. Each significant electrode pair was defined by decreased alpha coherence in the ASD group. No electrode pair showed significantly increased coherence in the ASD group.
Figure 2.
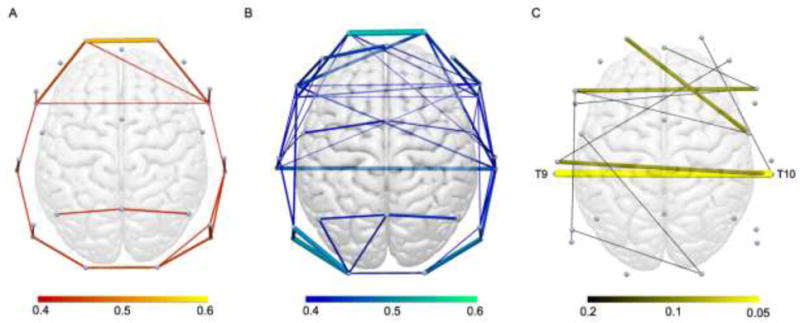
Group average resting state functional connections revealed by alpha phase coherence for A) ASD and B) typically developing groups. Connection color depicts value of connection strength, with all connections >0.4 phase coherence illustrated. C) Group differences in alpha phase coherence. Connection color indicates FDR correction value. All depicted connections represent decreased phase coherence in the ASD group. Labelled connection represents significant electrode pair group difference after implementing FDR correction at 0.05.
Implementing an FDR correction at 0.05, average alpha coherence between one interhemispheric electrode pair (corresponding to interhemispheric pairs T9 and T10 in the international 10-20 system) was significantly different between groups. Phase coherence between this electrode pair was significantly lower in ASD (M=0.37, SD=0.12, 95% CI [0.34, 0.40]) compared to the TD group (M=0.49, SD=0.17, 95% CI [0.44, 0.54]); adjusted P=0.02, see Figure 3).
Figure 3.
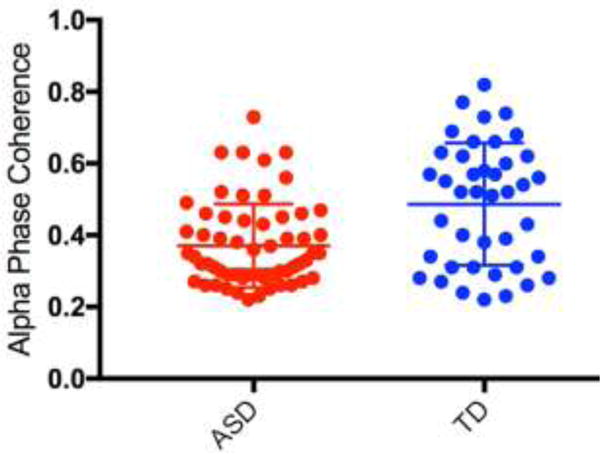
Dot plot demonstrating alpha phase coherence for electrode pair T9-T10 (with group mean and error bars representing SD) for both ASD and TD groups.
3.2. Behavioral Correlations
To investigate the association between alpha coherence and both age and cognitive ability, we performed regression procedures separately in each diagnostic group. We chose to split the groups in order to understand these relations within both typical and atypical development, with the hypothesis that they would differ in ASD and TD (c.f. [28]). We chose T9-T10, the coherence variable that survived multiple comparisons, to be used in the analysis. As coherence values were not normally distributed in the ASD group, coherence values were log transformed for this group only. Age, NVIQ and VIQ were entered as individual predictors of coherence into a forward step-wise regression procedure, with age forced to be included at each step.
Age was the first and only significant predictor in TD children (β=0.002, P=0.036). Introduction of VIQ and NVIQ as predictors did not significantly improve the prediction of the model (VIQ: β =−0.05, P=0.76; NVIQ: β =−0.18, P=0.26). For the ASD group, none of the variables were a significant predictor of log-transformed coherence (age: β=0.001, P=.0.46; VIQ: β =−0.06, P=0.67; NVIQ: β =−0.14, P=0.30).
An additional correlation in the ASD group was conducted to assess whether there was any relationship between severity of ASD symptoms and coherence. We conducted these analyses using the ADOS severity score, as this was the measure which was available for the most participants. There was no association between ADOS severity scores and log-transformed phase coherence for connection T9-T10 (r(25)= −0.52, P=.81).
4. Discussion
4.1
Here, we quantified functional connectivity in the alpha band in ASD. Consistent with our primary hypothesis, and using a very conservative statistical approach to identify group differences, we found that children with ASD across a wide cognitive range demonstrated an altered pattern of connectivity compared to TD children. Significantly reduced interhemispheric alpha phase coherence between left and right temporal regions was present in ASD.
Contrary to our secondary hypothesis, we found no correlation between long range connectivity and either cognitive ability or autism symptom severity, as measured by direct assessment. It is possible that this lack of correlation reflects a measurement issue, either due to the variability in the types of assessments used across the study population or due to the inherent limitations of these standardized assessments to truly capture meaningful clinical differences between children on the spectrum. However, these findings may also suggest that long range hypoconnectivity reflects a fundamental neurodevelopmental process that underlies and unifies the autism spectrum. The stability of this measure over time and with treatment, and its value as a diagnostic predictor, represent the focus of further investigations in our research program.
The ongoing development of functional connectivity during childhood is characterized by the strengthening of long-range, and weakening of short-range connections with age [60–63]. The typical developmental increase in long range connectivity that reflects neural maturation underlies both cognitive and emotional development [63]. In keeping with this established developmental change, the TD children in the present study showed an association between long range functional connectivity (temporal interhemispheric connection) and age. However, although cross sectional, there was no relation between age and functional connectivity in the ASD group, consistent with fMRI findings of connectivity dysmaturation in ASD [64,65].
4.2. Alpha coherence in ASD
The data driven approach employed here facilitates an unbiased examination of all possible atypical connectivity patterns. It should be noted that out of a large range of connection pairs studied, only one connection was significantly altered between the two groups, suggesting that the brain differences that distinguish ASD from TD are comprised of subtle but important changes. While many functional connections are found to be unaltered between the two groups, it is interesting that in a heterogeneous sample of children with ASD, the main group difference is characterized by hypo (rather than hyper) connectivity. Significantly decreased alpha coherence is consistent with previous reports [66–74]. However, it should be noted that other studies have found increased [75–77], and unaltered spontaneous alpha coherence in children with ASD [78–80]. Disparate reports of increased and decreased spontaneous alpha coherence are likely influenced by variations in methodology and analyses. These include 1) the type of EEG system used to record data, 2) the specific EEG processing pipeline (including its parameters), 3) the metric used to establish coherence and 4) the connections selected for analyses.
Furthermore, previous studies vary widely in the participant characteristics. For instance, studies which find increased spontaneous alpha coherence have focused only on younger children [75–77], consistent with evidence that suggests that the early neurodevelopment of ASD is associated with increased connectivity due to cortical overgrowth [81]. In future research (described below), we will examine the trajectories of connectivity longitudinally from early in life in order to determine whether patterns of hyperconnectivity precede later hypoconnectivity in ASD.
4.3. Why is alpha coherence reduced in ASD?
Across all levels of analysis (from cellular to structural to functional), neurobiological studies in ASD have demonstrated aberrant long range connectivity (for reviews see: [1]; fMRI: [82]; EEG/MEG; [9,83,84]). There are two key factors likely contribute to reduced long range phase coherence reported here.
The first factor is rooted in the variability in the local signal contributing to each measurement. An increased number of neural inputs, or more variable inputs, to one (or both) electrodes would decrease phase coherence between the two input signals [85]. More variable inputs are (by definition) uncorrelated, thus manifesting as reduced connectivity. Increased signal variability is often described as ‘neural noise’, and has been said to contribute to inconsistent evoked neural responses in ASD [86,87] reported in both EEG [88] and fMRI studies [89]. Increased variability of local signals could result from a variety of neurophysiological mechanisms at both micro-and macroscopic scales (discussed extensively by [85]). Both synaptic plasticity at the single cell level [90] and the balance of neural excitation and inhibition at the network level [91] contribute to increased neural noise. These underlying mechanisms, and the presence of excessive neural noise in ASD, are particularly relevant in the context of prominent ASD theories implicating E/I balance [92–94], and synaptic pathology as etiological factors [95,96].
Hypoconnectivity in ASD may also result from underlying abnormal or delayed development of long range circuits, which in turn leads to decreased integration between brain regions. These findings support previous studies of structural hypoconnectivity in ASD (see, [97], for a recent review). Diffusion tensor imaging (DTI) techniques have shown that individuals with ASD exhibit smaller and less-developed white matter tracts [98]. Connectivity disturbances in ASD are most prominent in frontal and temporal regions [1], with early brain overgrowth (see [99], for a review), minicolumnar, and white matter abnormalities [100,101] specifically found in these areas. Consistent with these regional abnormalities, here we find reduced interhemispheric connectivity over temporal and, at a slightly less conservative statistical correction, frontal regions. The protracted development of frontal and temporal regions (compared to brain regions which mature earlier) may increase their vulnerability to developmental disturbances at a microscopic level, including atypical axon numbers, synaptogenesis and pruning [2], leading to a higher risk of atypical connectivity these areas [8,81].
Moreover, from a structural standpoint, reduced interhemispheric connectivity may result from alerted development of the corpus callosum (CC) [102]. Reduced CC volume (particularly in anterior regions) [103– 111], and atypical myelination of the CC are reported in ASD [112]. Furthermore, the degree of CC structural abnormalities in ASD are related to fMRI measurements of spontaneous functional connectivity [113].
Neural noise and fundamental neurobiolgical differences certainly are not mutually exclusive. Alpha oscillations most sensitively capture maturational trends in both the variability of brain signals [19] and structural white matter deficits [20]. Dinstein and colleagues [85] highlight that increased neural variability and structural white matter development remain intimately linked, with reduced synchrony between brain regions during early development affecting the development of anatomical structural connections. Our results, therefore, likely capture a synergistic contribution of both increased local signal variability and reduced cortical synchrony in ASD.
4.2. Future research
From a methodological perspective, the application of CSD estimates may emphasize connections at a different spatial frequency to those represented in average reference data [114]. Future research across studies examining EEG changes in neurodevelopmental populations will directly compare average reference and CSD estimates of coherence differences, using the same unbiased approach. These analyses were not appropriate in the present data, as Laplacian reference was integral to attenuating the large sources of EMG that were present due to the heterogeneous sample [52], in addition to mitigating volume conduction [51].
From a clinical perspective, these data can guide continued efforts to disentangle the relationship between signal variability and structural differences, particularly through studies in early infancy before behavioral symptoms of atypical development have emerged. There is a growing effort to identify brain-based biomarkers that are scalable and feasible to enhance detection of early risk for ASD, in order to facilitate earlier interventions. We have established here that spontaneous alpha coherence can robustly capture connectivity disturbances across a heterogeneous group of children with ASD, establishing a basis for employing this metric in developmental populations. While EEG may not provide the spatial resolution of MEG and MRI-based techniques, its tolerability and scalability facilitates its use across the entire developmental spectrum. The EEG data length used to compute phase coherence here was relatively low, in order to retain as many participants as possible in the present analyses. In future data collection, we will increase the length of EEG recordings. This will hopefully allow us to retain more usable data across all participants, and increase the reliability of phase coherence estimates.
In ongoing studies, we will address more specifically the earliest developmental origins of aberrant spontaneous functional connectivity in infants at risk for ASD, both based on familial risk and due to causative genetic variants. We also will examine behavioral consequences of these connectivity patterns through more sensitive assays of social, communication and cognitive function. Through longitudinal investigations, we can better understand the timing of and relationship between the emergence of hypoconnectivity and social communication deficits.
4.3. Conclusions
Our results demonstrate that interhemispheric temporal hypoconnectivity represents a fundamental brain difference in children with ASD across a wide cognitive range. In the future, alpha phase coherence could serve as a valuable biomarker to map networks from birth in infants at risk for ASD and in children with ASD, a biomarker that, in turn, could serve as a quantitative, mechanistically driven target of intervention.
Table 2.
Electrode pairs which demonstrate significantly altered coherence FDR<0.2.
| Electrode | ASD | TD | P | Adjusted |
|---|---|---|---|---|
| Pair T9 -T10 | 0.367 | 0.488 | Value 0.000 | P Value 0.02 |
| F7-F8 | 0.323 | 0.402 | 0.001 | 0.07 |
| T7-T10 | 0.324 | 0.411 | 0.001 | 0.07 |
| Fp1-C4 | 0.307 | 0.371 | 0.001 | 0.07 |
| P7-O1 | 0.395 | 0.495 | 0.002 | 0.11 |
| Fp2-T10 | 0.343 | 0.428 | 0.003 | 0.11 |
| C3-O2 | 0.285 | 0.334 | 0.003 | 0.11 |
| F7-T10 | 0.358 | 0.437 | 0.003 | 0.12 |
| F7-P9 | 0.340 | 0.417 | 0.004 | 0.14 |
| Fz-F8 | 0.339 | 0.406 | 0.006 | 0.17 |
| F9-F8 | 0.345 | 0.427 | 0.006 | 0.17 |
| F4-T7 | 0.316 | 0.386 | 0.008 | 0.19 |
Note. Even electrode labels indicate right hemisphere, odd electrode labels indicate left hemisphere.
Highlights.
Neural connectivity is quantified in a diverse sample of children with ASD using EEG.
Children with ASD display interhemispheric hypoconnectivity compared to controls.
Hypoconnectivity is present across a wide cognitive and developmental range in ASD.
Acknowledgments
The authors wish to thank all of the children and families who participated in the study. This work was supported by Autism Speaks (Meixner Postdoctoral Fellowship in Translational Science, PI Charlotte DiStefano); the National Institutes of Mental Health (K23MH094517, PI Shafali Jeste); the National Institute of General Medical Sciences (R01 GM111378-01A1, PI Damla Senturk); and the National Institute of Health (ACE 2P50HD055784-06, PI Susan Bookheimer).
Footnotes
Publisher's Disclaimer: This is a PDF file of an unedited manuscript that has been accepted for publication. As a service to our customers we are providing this early version of the manuscript. The manuscript will undergo copyediting, typesetting, and review of the resulting proof before it is published in its final citable form. Please note that during the production process errors may be discovered which could affect the content, and all legal disclaimers that apply to the journal pertain.
Conflict of interest statement
Abigail Dickinson has no conflict of interest or financial disclosure to declare. Charlotte DiStefano has no conflict of interest or financial disclosure to declare. Yin-Ying Lin has no conflict of interest or financial disclosure to declare. Aaron Scheffler has no conflict of interest or financial disclosure to declare. Damla Senturk has no conflict of interest or financial disclosure to declare. Shafali Jeste has no conflict of interest or financial disclosure to declare.
References
- 1.Wass S. Distortions and disconnections: Disrupted brain connectivity in autism. Brain Cogn. 2011;75:18–28. doi: 10.1016/j.bandc.2010.10.005. [DOI] [PubMed] [Google Scholar]
- 2.Geschwind DH, Levitt P. Autism spectrum disorders: developmental disconnection syndromes. Curr Opin Neurobiol. 2007;17:103–111. doi: 10.1016/j.conb.2007.01.009. [DOI] [PubMed] [Google Scholar]
- 3.Wolff JJ, Gu H, Gerig G, Elison JT, Styner M, Gouttard S, Botteron KN, Dager SR, Dawson G, Estes AM, Evans AC, Hazlett HC, Kostopoulos P, McKinstry RC, Paterson SJ, Schultz RT, Zwaigenbaum L, Piven J, IBIS Network Differences in White Matter Fiber Tract Development Present From 6 to 24 Months in Infants With Autism. Am J Psychiatry. 2012;169:589–600. doi: 10.1176/appi.ajp.2011.11091447. [DOI] [PMC free article] [PubMed] [Google Scholar]
- 4.Keehn B, Wagner JB, Tager-Flusberg H, Nelson CA. Functional connectivity in the first year of life in infants at-risk for autism: a preliminary near-infrared spectroscopy study. Front Hum Neurosci. 2013;7 doi: 10.3389/fnhum.2013.00444. [DOI] [PMC free article] [PubMed] [Google Scholar]
- 5.Emerson R, Adams C, Nishino T. Functional neuroimaging of high-risk 6-month-old infants predicts a diagnosis of autism at 24 months of age. Science. 2017 doi: 10.1126/scitranslmed.aag2882. http://stm.sciencemag.org/content/9/393/eaag2882.abstract. [DOI] [PMC free article] [PubMed]
- 6.Hazlett HC, Gu H, Munsell BC, Kim SH, Styner M, Wolff JJ, Elison JT, Swanson MR, Zhu H, Botteron KN, Collins DL, Constantino JN, Dager SR, Estes AM, Evans AC, Fonov VS, Gerig G, Kostopoulos P, McKinstry RC, Pandey J, Paterson S, Pruett JR, Schultz RT, Shaw DW, Zwaigenbaum L, Piven J, IBIS Network Clinical Sites, Data Coordinating Center, Image Processing Core, Statistical Analysis, Early brain development in infants at high risk for autism spectrum disorder. Nature. 2017;542:348–351. doi: 10.1038/nature21369. [DOI] [PMC free article] [PubMed] [Google Scholar]
- 7.Belmonte MK, Allen G, Beckel-Mitchener A, Boulanger LM, Carper RA, Webb SJ. Autism and Abnormal Development of Brain Connectivity. J Neurosci. 2004;24:9228–9231. doi: 10.1523/JNEUROSCI.3340-04.2004. [DOI] [PMC free article] [PubMed] [Google Scholar]
- 8.Courchesne E, Pierce K. Why the frontal cortex in autism might be talking only to itself: local over-connectivity but long-distance disconnection. Curr Opin Neurobiol. 2005;15:225–230. doi: 10.1016/j.conb.2005.03.001. [DOI] [PubMed] [Google Scholar]
- 9.Vissers ME, Cohen MX, Geurts HM. Brain connectivity and high functioning autism: A promising path of research that needs refined models, methodological convergence, and stronger behavioral links. Neurosci Biobehav Rev. 2012;36:604–625. doi: 10.1016/j.neubiorev.2011.09.003. [DOI] [PubMed] [Google Scholar]
- 10.Charman T, Pickles A, Simonoff E, Chandler S, Loucas T, Baird G. IQ in children with autism spectrum disorders: data from the Special Needs and Autism Project (SNAP) Psychol Med. 2011;41:619–627. doi: 10.1017/S0033291710000991. [DOI] [PubMed] [Google Scholar]
- 11.Yeargin-Allsopp M, Rice C, Karapurkar T, Doernberg N, Boyle C, Murphy C. Prevalence of Autism in a US Metropolitan Area. JAMA. 2003;289:49–55. doi: 10.1001/jama.289.1.49. [DOI] [PubMed] [Google Scholar]
- 12.Idring S, Lundberg M, Sturm H, Dalman C, Gumpert C, Rai D, Lee BK, Magnusson C. Changes in Prevalence of Autism Spectrum Disorders in 2001–2011: Findings from the Stockholm Youth Cohort. J Autism Dev Disord. 2015;45:1766–1773. doi: 10.1007/s10803-014-2336-y. [DOI] [PubMed] [Google Scholar]
- 13.Braun KVN, Christensen D, Doernberg N, Schieve L, Rice C, Wiggins L, Schendel D, Yeargin-Allsopp M. Trends in the Prevalence of Autism Spectrum Disorder, Cerebral Palsy, Hearing Loss, Intellectual Disability, and Vision Impairment. Metropolitan Atlanta, 1991–2010, PLOS ONE. 2015;10:e0124120. doi: 10.1371/journal.pone.0124120. [DOI] [PMC free article] [PubMed] [Google Scholar]
- 14.Fishman I, Keown CL, Lincoln AJ, Pineda JA, Müller RA. Atypical Cross Talk Between Mentalizing and Mirror Neuron Networks in Autism Spectrum Disorder. JAMA Psychiatry. 2014;71:751–760. doi: 10.1001/jamapsychiatry.2014.83. [DOI] [PMC free article] [PubMed] [Google Scholar]
- 15.von dem Hagen EAH, Stoyanova RS, Baron-Cohen S, Calder AJ. Reduced functional connectivity within and between “social” resting state networks in autism spectrum conditions. Soc Cogn Affect Neurosci. 2013;8:694–701. doi: 10.1093/scan/nss053. [DOI] [PMC free article] [PubMed] [Google Scholar]
- 16.Kida T, Tanaka E, Kakigi R. Multi-Dimensional Dynamics of Human Electromagnetic Brain Activity. Front Hum Neurosci. 2016;9:713–713. doi: 10.3389/fnhum.2015.00713. [DOI] [PMC free article] [PubMed] [Google Scholar]
- 17.Webb SJ, Bernier R, Henderson HA, Johnson MH, Jones EJH, Lerner MD, McPartland JC, Nelson CA, Rojas DC, Townsend J, Westerfield M. Guidelines and best practices for electrophysiological data collection, analysis and reporting in autism. J Autism Dev Disord. 2015;45:425–443. doi: 10.1007/s10803-013-1916-6. [DOI] [PMC free article] [PubMed] [Google Scholar]
- 18.Smit DJA, Boersma M, Schnack HG, Micheloyannis S, Boomsma DI, Hulshoff Pol HE, Stam CJ, de Geus EJC. The Brain Matures with Stronger Functional Connectivity and Decreased Randomness of Its Network. PLoS ONE. 2012;7:e36896–e36896. doi: 10.1371/journal.pone.0036896. [DOI] [PMC free article] [PubMed] [Google Scholar]
- 19.Vakorin VA, Lippé S, McIntosh AR. Variability of Brain Signals Processed Locally Transforms into Higher Connectivity with Brain Development. J Neurosci. 2011;31:6405–6413. doi: 10.1523/JNEUROSCI.3153-10.2011. [DOI] [PMC free article] [PubMed] [Google Scholar]
- 20.Hinkley LBN, Vinogradov S, Guggisberg AG, Fisher M, Findlay AM, Nagarajan SS. Clinical Symptoms and Alpha Band Resting-State Functional Connectivity Imaging in Patients With Schizophrenia: Implications for Novel Approaches to Treatment. Biol Psychiatry. 2011;70:1134–1142. doi: 10.1016/j.biopsych.2011.06.029. [DOI] [PMC free article] [PubMed] [Google Scholar]
- 21.Klimesch W. EEG alpha and theta oscillations reflect cognitive and memory performance: a review and analysis. Brain Res Rev. 1999;29:169–195. doi: 10.1016/S0165-0173(98)00056-3. [DOI] [PubMed] [Google Scholar]
- 22.Klimesch W. Alpha-band oscillations, attention, and controlled access to stored information. Trends Cogn Sci. 2012;16:606–617. doi: 10.1016/j.tics.2012.10.007. [DOI] [PMC free article] [PubMed] [Google Scholar]
- 23.Lachaux JP, Rodriguez E, Martinerie J, Varela FJ. Measuring phase synchrony in brain signals. Hum Brain Mapp. 1999;8:194–208. doi: 10.1002/(SICI)1097-0193(1999)8:4<194::AID-HBM4>3.0.CO;2-C. [DOI] [PMC free article] [PubMed] [Google Scholar]
- 24.Myslobodsky MS, Coppola R, Bar-Ziv J, Karson C, Daniel D, van Praag H, Weinberger DR. EEG asymmetries may be affected by cranial and Brain parenchymal asymmetries. Brain Topogr. 1989;1:221–228. doi: 10.1007/BF01129599. [DOI] [PubMed] [Google Scholar]
- 25.Nunez PL, Srinivasan R. The Neurophysics of EEG. Oxford University Press; 2006. Electric Fields of the Brain. [Google Scholar]
- 26.Srinath R, Ray S. Effect of amplitude correlations on coherence in the local field potential. J Neurophysiol. 2014;112:741–751. doi: 10.1152/jn.00851.2013. [DOI] [PMC free article] [PubMed] [Google Scholar]
- 27.Mormann F, Lehnertz K, David P, Elger C. Mean phase coherence as a measure for phase synchronization and its application to the EEG of epilepsy patients. Phys Nonlinear Phenom. 2000;144:358–369. doi: 10.1016/S0167-2789(00)00087-7. [DOI] [Google Scholar]
- 28.Dickinson A, DiStefano C, Senturk D, Jeste SS. Peak alpha frequency is a neural marker of cognitive function across the autism spectrum. Eur J Neurosci. 2017 doi: 10.1111/ejn.13645.s. [DOI] [PMC free article] [PubMed] [Google Scholar]
- 29.McEvoy K, Hasenstab K, Senturk D, Sanders A, Jeste SS. Physiologic artifacts in resting state oscillations in young children: methodological considerations for noisy data. Brain Imaging Behav. 2015;9:104–14. doi: 10.1007/s11682-014-9343-7. [DOI] [PMC free article] [PubMed] [Google Scholar]
- 30.Mullen EM. Mullen scales of early learning. 1995 http://www.v-psyche.com/doc/special-cases/Mullen_Scales_of_Early_Learning.docx.
- 31.T.N. Beran. Elliott CD. Differential Ability Scales (2nd ed.). San Antonio, TX: Harcourt Assessment, Can. J Sch Psychol. 2007;22:128–132. doi: 10.1177/0829573507302967. 2007. [DOI] [Google Scholar]
- 32.Wechsler D. Wechsler preschool and primary scale of intelligence for children. San Antonio, TX: The Psychological Corporation; 2002. [Google Scholar]
- 33.Akshoomoff N. Use of the Mullen Scales of Early Learning for the assessment of young children with Autism Spectrum Disorders. Child Neuropsychol J Norm Abnorm Dev Child Adolesc. 2006;12:269–77. doi: 10.1080/09297040500473714. [DOI] [PMC free article] [PubMed] [Google Scholar]
- 34.Bishop SL, Guthrie W, Coffing M, Lord C. Convergent Validity of the Mullen Scales of Early Learning and the Differential Ability Scales in Children With Autism Spectrum Disorders. Am J Intellect Dev Disabil. 2011;116:331–343. doi: 10.1352/1944-7558-116.5.331. [DOI] [PMC free article] [PubMed] [Google Scholar]
- 35.Hill AP, Zuckerman KE, Hagen AD, Kriz DJ, Duvall SW, Van Santen J, Nigg J, Fair D, Fombonne E. Aggressive behavior problems in children with autism spectrum disorders: prevalence and correlates in a large clinical sample. Res Autism Spectr Disord. 2014;8:1121–1133. doi: 10.1016/j.rasd.2014.05.006. [DOI] [PMC free article] [PubMed] [Google Scholar]
- 36.Harrison AJ, Lu ZL, McLean RL, Sheinkopf SJ. Cognitive and adaptive correlates of an ADOS-derived joint attention composite. Res Autism Spectr Disord. 2016;29:66–78. doi: 10.1016/j.rasd.2016.07.001. [DOI] [PMC free article] [PubMed] [Google Scholar]
- 37.Lord C, Risi S, Lambrecht L, Cook EH, Leventhal BL, DiLavore PC, Pickles A, Rutter M. The autism diagnostic observation schedule-generic: a standard measure of social and communication deficits associated with the spectrum of autism. J Autism Dev Disord. 2000;30:205–23. [PubMed] [Google Scholar]
- 38.Gotham K, Pickles A, Lord C. Standardizing ADOS scores for a measure of severity in autism spectrum disorders. J Autism Dev Disord. 2009;39:693–705. doi: 10.1007/s10803-008-0674-3. [DOI] [PMC free article] [PubMed] [Google Scholar]
- 39.Rutter M, Bailey A, Lord C. SCQ, Soc. Commun. Quest Torrance CA West Psychol Serv. 2003 [Google Scholar]
- 40.Constantino JN, Todd RD. Autistic traits in the general population: a twin study. Arch Gen Psychiatry. 2003;60:524–530. doi: 10.1001/archpsyc.60.5.524. [DOI] [PubMed] [Google Scholar]
- 41.Dawson G, Klinger LG, Panagiotides H, Lewy A, Castelloe P. Subgroups of autistic children based on social behavior display distinct patterns of brain activity. J Abnorm Child Psychol. 1995;23:569–583. doi: 10.1007/BF01447662. [DOI] [PubMed] [Google Scholar]
- 42.Stroganova TA, Orekhova EV, Posikera IN. EEG alpha rhythm in infants. Clin Neurophysiol Off J Int Fed Clin Neurophysiol. 1999;110:997–1012. doi: 10.1016/s1388-2457(98)00009-1. [DOI] [PubMed] [Google Scholar]
- 43.Tierney AL, Gabard-Durnam L, Vogel-Farley V, Tager-Flusberg H, Nelson CA. Developmental Trajectories of Resting EEG Power: An Endophenotype of Autism Spectrum Disorder. PLoS ONE. 2012;7:e39127. doi: 10.1371/journal.pone.0039127. [DOI] [PMC free article] [PubMed] [Google Scholar]
- 44.Jasper H. The ten twenty electrode system of the international federation. Electroencephalogr Clin Neuroph Siology. 1958;10:371–375. [PubMed] [Google Scholar]
- 45.Makeig S, Jung TP, Bell AJ, Ghahremani D, Sejnowski TJ. Blind separation of auditory event-related brain responses into independent components. Proc Natl Acad Sci U S A. 1997;94:10979–84. doi: 10.1073/PNAS.94.20.10979. [DOI] [PMC free article] [PubMed] [Google Scholar]
- 46.Fraschini M, Demuru M, Crobe A, Marrosu F, Stam CJ, Hillebrand A. The effect of epoch length on estimated EEG functional connectivity and brain network organisation. J Neural Eng. 2016;13:036015. doi: 10.1088/1741-2560/13/3/036015. [DOI] [PubMed] [Google Scholar]
- 47.Gudmundsson S, Runarsson TP, Sigurdsson S, Eiriksdottir G, Johnsen K. Reliability of quantitative EEG features. Clin Neurophysiol. 2007;118:2162–2171. doi: 10.1016/j.clinph.2007.06.018. [DOI] [PubMed] [Google Scholar]
- 48.Nunez PL, Srinivasan R, Westdorp AF, Wijesinghe RS, Tucker DM, Silberstein RB, Cadusch PJ. EEG coherency: I: statistics, reference electrode, volume conduction. Laplacians, cortical imaging, and interpretation at multiple scales. Electroencephalogr Clin Neurophysiol. 1997;103:499–515. doi: 10.1016/s0013-4694(97)00066-7. [DOI] [PubMed] [Google Scholar]
- 49.Nunez PL, Srinivasan R. A theoretical basis for standing and traveling brain waves measured with human EEG with implications for an integrated consciousness. Clin Neurophysiol. 2006;117:2424–2435. doi: 10.1016/j.clinph.2006.06.754. [DOI] [PMC free article] [PubMed] [Google Scholar]
- 50.Srinivasan R, Winter WR, Ding J, Nunez PL. EEG and MEG coherence: measures of functional connectivity at distinct spatial scales of neocortical dynamics. J Neurosci Methods. 2007;166:41–52. doi: 10.1016/j.jneumeth.2007.06.026. [DOI] [PMC free article] [PubMed] [Google Scholar]
- 51.Kayser J, Tenke CE. On the benefits of using surface Laplacian (Current Source Density) methodology in electrophysiology. Int J Psychophysiol Off J Int Organ Psychophysiol. 2015;97:171–173. doi: 10.1016/j.ijpsycho.2015.06.001. [DOI] [PMC free article] [PubMed] [Google Scholar]
- 52.Fitzgibbon SP, DeLosAngeles D, Lewis TW, Powers DMW, Whitham EM, Willoughby JO, Pope KJ. Surface Laplacian of scalp electrical signals and independent component analysis resolve EMG contamination of electroencephalogram. Int J Psychophysiol. 2015;97:277–284. doi: 10.1016/j.ijpsycho.2014.10.006. [DOI] [PubMed] [Google Scholar]
- 53.Kayser J, Tenke CE. Principal components analysis of Laplacian waveforms as a generic method for identifying ERP generator patterns: I. Evaluation with auditory oddball tasks. Clin Neurophysiol. 2006;117:348–368. doi: 10.1016/j.clinph.2005.08.034. [DOI] [PubMed] [Google Scholar]
- 54.Kayser J, Tenke CE. Principal components analysis of Laplacian waveforms as a generic method for identifying ERP generator patterns: II. Adequacy of low-density estimates. Clin Neurophysiol. 2006;117:369–380. doi: 10.1016/j.clinph.2005.08.033. [DOI] [PubMed] [Google Scholar]
- 55.Kayser J. Current source density (CSD) interpolation using spherical splines -CSD Toolbox (Version 1.1) Curr Source Density CSD Interpolat. Using Spherical Splines -CSD Toolbox Version 11. 2009 http://psychophysiology.cpmc.columbia.edu/Software/CSDtoolbox accessed February 23, 2018.
- 56.Oberman LM, Ramachandran VS, Pineda JA. Modulation of mu suppression in children with autism spectrum disorders in response to familiar or unfamiliar stimuli: The mirror neuron hypothesis. Neuropsychologia. 2008;46:1558–1565. doi: 10.1016/j.neuropsychologia.2008.01.010. [DOI] [PubMed] [Google Scholar]
- 57.McLaughlin KA, Fox NA, Zeanah CH, Nelson CA. Adverse Rearing Environments and Neural Development in Children: The Development of Frontal Electroencephalogram Asymmetry. Biol Psychiatry. 2011;70:1008–1015. doi: 10.1016/j.biopsych.2011.08.006. [DOI] [PMC free article] [PubMed] [Google Scholar]
- 58.Delorme A, Makeig S. EEGLAB: an open source toolbox for analysis of single-trial EEG dynamics including independent component analysis. J Neurosci Methods. 2004;134:9–21. doi: 10.1016/j.jneumeth.2003.10.009. [DOI] [PubMed] [Google Scholar]
- 59.NITRC: Surf Ice: Tool/Resource Info. (n.d.). https://www.nitrc.org/projects/surfice/ (accessed November 30, 2017).
- 60.Fair DA, Cohen AL, Power JD, Dosenbach NUF, Church JA, Miezin FM, Schlaggar BL, Petersen SE. Functional Brain Networks Develop from a “Local to Distributed” Organization. PLoS Comput Biol. 2009;5:e1000381. doi: 10.1371/journal.pcbi.1000381. [DOI] [PMC free article] [PubMed] [Google Scholar]
- 61.Gao W, Zhu H, Giovanello KS, Smith JK, Shen D, Gilmore JH, Lin W. Evidence on the emergence of the brain’s default network from 2-week-old to 2-year-old healthy pediatric subjects. Proc Natl Acad Sci. 2009;106:6790–6795. doi: 10.1073/pnas.0811221106. [DOI] [PMC free article] [PubMed] [Google Scholar]
- 62.Supekar K, Musen M, Menon V. Development of large-scale functional brain networks in children. PLoS Biol. 2009;7:e1000157. doi: 10.1371/journal.pbio.1000157. [DOI] [PMC free article] [PubMed] [Google Scholar]
- 63.Dosenbach NU, Nardos B, Cohen AL, Fair DA, Power JD, Church JA, Nelson SM, Wig GS, Vogel AC, Lessov-Schlaggar CN. Prediction of individual brain maturity using fMRI. Science. 2010;329:1358–1361. doi: 10.1126/science.1194144. [DOI] [PMC free article] [PubMed] [Google Scholar]
- 64.Wiggins JL, Peltier SJ, Ashinoff S, Weng SJ, Carrasco M, Welsh RC, Lord C, Monk CS. Using a self-organizing map algorithm to detect age-related changes in functional connectivity during rest in autism spectrum disorders. Brain Res. 2011;1380:187–197. doi: 10.1016/j.brainres.2010.10.102. [DOI] [PMC free article] [PubMed] [Google Scholar]
- 65.Washington SD, Gordon EM, Brar J, Warburton S, Sawyer AT, Wolfe A, Mease‐Ference ER, Girton L, Hailu A, Mbwana J. Dysmaturation of the default mode network in autism. Hum Brain Mapp. 2014;35:1284–1296. doi: 10.1002/hbm.22252. [DOI] [PMC free article] [PubMed] [Google Scholar]
- 66.Boersma M, Kemner C, de Reus MA, Collin G, Snijders TM, Hofman D, Buitelaar JK, Stam CJ, van den Heuvel MP. Disrupted functional brain networks in autistic toddlers. Brain Connect. 2013;3:41–49. doi: 10.1089/brain.2012.0127. [DOI] [PubMed] [Google Scholar]
- 67.Carson AM, Salowitz NM, Scheidt RA, Dolan BK, Van Hecke AV. Electroencephalogram coherence in children with and without autism spectrum disorders: decreased interhemispheric connectivity in autism. Autism Res. 2014;7:334–343. doi: 10.1002/aur.1367. [DOI] [PubMed] [Google Scholar]
- 68.Clarke AR, Barry RJ, Indraratna A, Dupuy FE, McCarthy R, Selikowitz M. EEG activity in children with Asperger’s Syndrome. Clin Neurophysiol. 2016;127:442–451. doi: 10.1016/j.clinph.2015.05.015. [DOI] [PubMed] [Google Scholar]
- 69.Coben R, Clarke AR, Hudspeth W, Barry RJ. EEG power and coherence in autistic spectrum disorder. Clin Neurophysiol. 2008;119:1002–1009. doi: 10.1016/j.clinph.2008.01.013. [DOI] [PubMed] [Google Scholar]
- 70.Duffy FH, Als H. A stable pattern of EEG spectral coherence distinguishes children with autism from neurotypical controls-a large case control study. BMC Med. 2012;10:64. doi: 10.1186/1741-7015-10-64. [DOI] [PMC free article] [PubMed] [Google Scholar]
- 71.Elhabashy H, Raafat O, Afifi L, Raafat H, Abdullah K. Quantitative EEG in autistic children. Egypt J Neurol Psychiatry Neurosurg. 2015;52:176. [Google Scholar]
- 72.Jaime M, McMahon CM, Davidson BC, Newell LC, Mundy PC, Henderson HA. Brief report: reduced temporal-central EEG alpha coherence during joint attention perception in adolescents with autism spectrum disorder. J Autism Dev Disord. 2016;46:1477–1489. doi: 10.1007/s10803-015-2667-3. [DOI] [PMC free article] [PubMed] [Google Scholar]
- 73.Lushchekina EA, Khaerdinova OY, Novototskii-Vlasov VY, Lushchekin VS, Strelets VB. Synchronization of EEG rhythms in baseline conditions and during counting in children with Autism Spectrum Disorders. Neurosci Behav Physiol. 2016;46:382. [Google Scholar]
- 74.Matlis S, Boric K, Chu CJ, Kramer MA. Robust disruptions in electroencephalogram cortical oscillations and large-scale functional networks in autism. BMC Neurol. 2015;15:97. doi: 10.1186/s12883-015-0355-8. [DOI] [PMC free article] [PubMed] [Google Scholar]
- 75.Domínguez LG, Stieben J, Velázquez JLP, Shanker S. The imaginary part of coherency in autism: differences in cortical functional connectivity in preschool children. PLoS One. 2013;8:e75941. doi: 10.1371/journal.pone.0075941. [DOI] [PMC free article] [PubMed] [Google Scholar]
- 76.Machado C, Estévez M, Leisman G, Melillo R, Rodríguez R, DeFina P, Hernández A, Pérez-Nellar J, Naranjo R, Chinchilla M. QEEG spectral and coherence assessment of autistic children in three different experimental conditions. J Autism Dev Disord. 2015;45:406–424. doi: 10.1007/s10803-013-1909-5. [DOI] [PMC free article] [PubMed] [Google Scholar]
- 77.Orekhova EV, Elsabbagh M, Jones EJ, Dawson G, Charman T, Johnson MH, T.B. BASIS Team EEG hyper-connectivity in high-risk infants is associated with later autism. J Neurodev Disord. 2014;6:40–40. doi: 10.1186/1866-1955-6-40. [DOI] [PMC free article] [PubMed] [Google Scholar]
- 78.Buckley AW, Scott R, Tyler A, Mahoney JM, Thurm A, Farmer C, Swedo S, Burroughs SA, Holmes GL. State-Dependent Differences in Functional Connectivity in Young Children With Autism Spectrum Disorder. EBioMedicine. 2015;2:1905–1915. doi: 10.1016/j.ebiom.2015.11.004. [DOI] [PMC free article] [PubMed] [Google Scholar]
- 79.Lazarev VV, Pontes A, Mitrofanov AA. Reduced interhemispheric connectivity in childhood autism detected by electroencephalographic photic driving coherence. J Autism Dev Disord. 2015;45:537–547. doi: 10.1007/s10803-013-1959-8. [DOI] [PubMed] [Google Scholar]
- 80.Peters JM, Taquet M, Vega C, Jeste SS, Fernández IS, Tan J, Nelson CA, Sahin M, Warfield SK. Brain functional networks in syndromic and non-syndromic autism: a graph theoretical study of EEG connectivity. BMC Med. 2013;11:54. doi: 10.1186/1741-7015-11-54. [DOI] [PMC free article] [PubMed] [Google Scholar]
- 81.Courchesne E, Pierce K. Brain overgrowth in autism during a critical time in development: implications for frontal pyramidal neuron and interneuron development and connectivity. Int J Dev Neurosci Off J Int Soc Dev Neurosci. 2005;23:153–170. doi: 10.1016/j.ijdevneu.2005.01.003. [DOI] [PubMed] [Google Scholar]
- 82.Hull JV, Jacokes ZJ, Torgerson CM, Irimia A, Van Horn JD. Resting-State Functional Connectivity in Autism Spectrum Disorders: A Review. Front Psychiatry. 2017;7 doi: 10.3389/fpsyt.2016.00205. [DOI] [PMC free article] [PubMed] [Google Scholar]
- 83.Schwartz S, Kessler R, Gaughan T, Buckley AW. Electroencephalogram Coherence Patterns in Autism: An Updated Review. Pediatr Neurol. 2016 doi: 10.1016/j.pediatrneurol.2016.10.018. [DOI] [PMC free article] [PubMed] [Google Scholar]
- 84.O’Reilly C, Lewis JD, Elsabbagh M. Is functional brain connectivity atypical in autism? A systematic review of EEG and MEG studies. PloS One. 2017;12:e0175870. doi: 10.1371/journal.pone.0175870. [DOI] [PMC free article] [PubMed] [Google Scholar]
- 85.Dinstein I, Heeger DJ, Behrmann M. Neural variability: friend or foe? Trends Cogn Sci. 2015;19:322–328. doi: 10.1016/j.tics.2015.04.005. [DOI] [PubMed] [Google Scholar]
- 86.Simmons D, Milne E. Response to Davis and Plaisted-Grant: Low or high endogenous neural noise in autism spectrum disorder? Autism. 2015;19:363–364. doi: 10.1177/1362361314557683. [DOI] [PubMed] [Google Scholar]
- 87.David N, Schneider TR, Peiker I, Al-Jawahiri R, Engel AK, Milne E. Variability of cortical oscillation patterns: A possible endophenotype in autism spectrum disorders? Neurosci Biobehav Rev. 2016;71:590–600. doi: 10.1016/j.neubiorev.2016.09.031. [DOI] [PubMed] [Google Scholar]
- 88.Milne E. Increased intra-participant variability in children with autistic spectrum disorders: evidence from single-trial analysis of evoked EEG. Front Psychol. 2(2011) doi: 10.3389/fpsyg.2011.00051. [DOI] [PMC free article] [PubMed] [Google Scholar]
- 89.Dinstein I, Heeger DJ, Lorenzi L, Minshew NJ, Malach R, Behrmann M. Unreliable evoked responses in autism. Neuron. 2012;75:981–991. doi: 10.1016/j.neuron.2012.07.026. [DOI] [PMC free article] [PubMed] [Google Scholar]
- 90.Feldman DE. Synaptic mechanisms for plasticity in neocortex. Annu Rev Neurosci. 2009;32:33–55. doi: 10.1146/annurev.neuro.051508.135516. [DOI] [PMC free article] [PubMed] [Google Scholar]
- 91.Turrigiano G. Too Many Cooks? Intrinsic and Synaptic Homeostatic Mechanisms in Cortical Circuit Refinement. Annu Rev Neurosci. 2011;34:89–103. doi: 10.1146/annurev-neuro-060909-153238. [DOI] [PubMed] [Google Scholar]
- 92.Rubenstein JL, Merzenich MM. Model of autism: increased ratio of excitation/inhibition in key neural systems. Genes Brain Behav. 2003;2:255–267. doi: 10.1034/j.1601-183x.2003.00037.x. [DOI] [PMC free article] [PubMed] [Google Scholar]
- 93.Markram H, Rinaldi T, Markram K. The intense world syndrome–an alternative hypothesis for autism. Front Neurosci. 2007;1:77–96. doi: 10.3389/neuro.01.1.1.006.2007. [DOI] [PMC free article] [PubMed] [Google Scholar]
- 94.Dickinson A, Jones M, Milne E. Measuring neural excitation and inhibition in autism: Different approaches, different findings and different interpretations. Brain Res. 2016;1648:277–289. doi: 10.1016/j.brainres.2016.07.011. [DOI] [PubMed] [Google Scholar]
- 95.Glessner JT, Reilly MP, Kim CE, Takahashi N, Albano A, Hou C, Bradfield JP, Zhang H, Sleiman PMA, Flory JH, Imielinski M, Frackelton EC, Chiavacci R, Thomas KA, Garris M, Otieno FG, Davidson M, Weiser M, Reichenberg A, Davis KL, Friedman JI, Cappola TP, Margulies KB, Rader DJ, Grant SFA, Buxbaum JD, Gur RE, Hakonarson H. Strong synaptic transmission impact by copy number variations in schizophrenia. Proc Natl Acad Sci. 2010;107:10584–10589. doi: 10.1073/pnas.1000274107. [DOI] [PMC free article] [PubMed] [Google Scholar]
- 96.Auerbach BD, Osterweil EK, Bear MF. Mutations causing syndromic autism define an axis of synaptic pathophysiology. Nature. 2011;480:63–68. doi: 10.1038/nature10658. [DOI] [PMC free article] [PubMed] [Google Scholar]
- 97.Picci G, Gotts SJ, Scherf KS. A theoretical rut: revisiting and critically evaluating the generalized under/over‐connectivity hypothesis of autism. Dev Sci. 2016;19:524–549. doi: 10.1111/desc.12467. [DOI] [PubMed] [Google Scholar]
- 98.Travers BG, Adluru N, Ennis C, Tromp DP, Destiche D, Doran S, Bigler ED, Lange N, Lainhart JE, Alexander AL. Diffusion tensor imaging in autism spectrum disorder: a review. Autism Res. 2012;5:289–313. doi: 10.1002/aur.1243. [DOI] [PMC free article] [PubMed] [Google Scholar]
- 99.Courchesne E, Pierce K, Schumann CM, Redcay E, Buckwalter JA, Kennedy DP, Morgan J. Mapping Early Brain Development in Autism, Neuron. 2007;56:399–413. doi: 10.1016/j.neuron.2007.10.016. [DOI] [PubMed] [Google Scholar]
- 100.Buxhoeveden DP, Semendeferi K, Buckwalter J, Schenker N, Switzer R, Courchesne E. Reduced minicolumns in the frontal cortex of patients with autism. Neuropathol Appl Neurobiol. 2006;32:483–491. doi: 10.1111/j.1365-2990.2006.00745.x. [DOI] [PubMed] [Google Scholar]
- 101.Casanova MF, Van Kooten I, Switala AE, Van Engeland H, Heinsen H, Steinbusch HWM, Hof PR, Schmitz C. Abnormalities of cortical minicolumnar organization in the prefrontal lobes of autistic patients. Clin Neurosci Res. 2006;6:127–133. [Google Scholar]
- 102.Paul LK, Brown WS, Adolphs R, Tyszka JM, Richards LJ, Mukherjee P, Sherr EH. Agenesis of the corpus callosum: genetic, developmental and functional aspects of connectivity. Nat Rev Neurosci. 2007;8:287–299. doi: 10.1038/nrn2107. [DOI] [PubMed] [Google Scholar]
- 103.Brambilla P, Nicoletti MA, Sassi RB, Mallinger AG, Frank E, Kupfer DJ, Keshavan MS, Soares JC. Magnetic resonance imaging study of corpus callosum abnormalities in patients with bipolar disorder. Biol Psychiatry. 2003;54:1294–1297. doi: 10.1016/s0006-3223(03)00070-2. [DOI] [PubMed] [Google Scholar]
- 104.Verhoeven JS, De Cock P, Lagae L, Sunaert S. Neuroimaging of autism. Neuroradiology. 2010;52:3–14. doi: 10.1007/s00234-009-0583-y. [DOI] [PubMed] [Google Scholar]
- 105.Frazier TW, Hardan AY. A meta-analysis of the corpus callosum in autism. Biol Psychiatry. 2009;66:935–941. doi: 10.1016/j.biopsych.2009.07.022. [DOI] [PMC free article] [PubMed] [Google Scholar]
- 106.Alexander AL, Lee JE, Lazar M, Boudos R, DuBray MB, Oakes TR, Miller JN, Lu J, Jeong EK, McMahon WM. Diffusion tensor imaging of the corpus callosum in Autism. Neuroimage. 2007;34:61–73. doi: 10.1016/j.neuroimage.2006.08.032. [DOI] [PubMed] [Google Scholar]
- 107.Freitag CM, Luders E, Hulst HE, Narr KL, Thompson PM, Toga AW, Krick C, Konrad C. Total brain volume and corpus callosum size in medication-naive adolescents and young adults with autism spectrum disorder. Biol Psychiatry. 2009;66:316–319. doi: 10.1016/j.biopsych.2009.03.011. [DOI] [PMC free article] [PubMed] [Google Scholar]
- 108.Vidal CN, Nicolson R, DeVito TJ, Hayashi KM, Geaga JA, Drost DJ, Williamson PC, Rajakumar N, Sui Y, Dutton RA. Mapping corpus callosum deficits in autism: an index of aberrant cortical connectivity. Biol Psychiatry. 2006;60:218–225. doi: 10.1016/j.biopsych.2005.11.011. [DOI] [PubMed] [Google Scholar]
- 109.Keary CJ, Minshew NJ, Bansal R, Goradia D, Fedorov S, Keshavan MS, Hardan AY. Corpus callosum volume and neurocognition in autism. J Autism Dev Disord. 2009;39:834–841. doi: 10.1007/s10803-009-0689-4. [DOI] [PMC free article] [PubMed] [Google Scholar]
- 110.Lewis JD, Theilmann RJ, Fonov V, Bellec P, Lincoln A, Evans AC, Townsend J. Callosal fiber length and interhemispheric connectivity in adults with autism: brain overgrowth and underconnectivity. Hum Brain Mapp. 2013;34:1685–1695. doi: 10.1002/hbm.22018. [DOI] [PMC free article] [PubMed] [Google Scholar]
- 111.Waiter GD, Williams JH, Murray AD, Gilchrist A, Perrett DI, Whiten A. Structural white matter deficits in high-functioning individuals with autistic spectrum disorder: a voxel-based investigation. Neuroimage. 2005;24:455–461. doi: 10.1016/j.neuroimage.2004.08.049. [DOI] [PubMed] [Google Scholar]
- 112.Gozzi M, Nielson DM, Lenroot RK, Ostuni JL, Luckenbaugh DA, Thurm AE, Giedd JN, Swedo SE. A magnetization transfer imaging study of corpus callosum myelination in young children with autism. Biol Psychiatry. 2012;72:215–220. doi: 10.1016/j.biopsych.2012.01.026. [DOI] [PMC free article] [PubMed] [Google Scholar]
- 113.Cherkassky VL, Kana RK, Keller TA, Just MA. Functional connectivity in a baseline resting-state network in autism. Neuroreport. 2006;17:1687–1690. doi: 10.1097/01.wnr.0000239956.45448.4c. [DOI] [PubMed] [Google Scholar]
- 114.Srinivasan R, Nunez PL, Silberstein RB. Spatial filtering and neocortical dynamics: estimates of EEG coherence. IEEE Trans Biomed Eng. 1998;45:814–826. doi: 10.1109/10.686789. [DOI] [PubMed] [Google Scholar]