

Abstract
School neighborhood violence continues to be a major public health problem among urban students. A large body of research addresses violence at school; however, fewer studies have explored concentrations of violence in areas proximal to schools. This study aimed to quantify the concentration of shootings near schools to elucidate the place-based dynamics that may be focal points for violence prevention. Geocoded databases of shooting and school locations were used to examine locational patterns of firearm shootings and elementary, middle, and high schools in Boston, Massachusetts. Analyses utilized spatial statistics for point pattern data including distance matrix and K function methodology to quantify the degree of spatial dependence of shootings around schools. Results suggested that between 2012 and 2015, there were 678 shooting incidents in Boston; the average density was 5.1 per square kilometer. The nearest neighbor index (NNI = 0.335 km, p < .001, O = 0.95 km, E = 0.28 km) and G function analysis revealed a clustered pattern of gun shooting incidents indicative of a spatially non-random process. The mean and median distance from any school to the nearest shooting location was 0.35 and 0.33 km, respectively. A majority (56%, 74/133) of schools in Boston had at least one shooting incident within 400 m, a distance that would take about 5 min to walk if traveling by foot. The bivariate K function indicated that a significantly greater number of shootings were clustered within short distances from schools than would be expected under a null hypothesis of no spatial dependence. Implications for students attending schools in racially homogenous neighborhoods across all income levels are discussed.
Keywords: Gun violence, Spatial statistics, School violence, Violence exposure, Geographic information systems
Introduction
Following the tragic mass shooting incidents at Columbine High School in 1999, Sandy Hook Elementary School in 2012 and more recently Marjory Stoneman Douglas High School in 2018, the perceived threat of school-based violence has fundamentally altered public attitudes about student safety. A poll conducted in the year following Columbine found that fewer than 50% of parents believed that their children were “very safe” at school [1]. As a result, citizens, policy-makers, law enforcement officers, and educators have focused efforts on strategies to promote school safety, such as zero tolerance policies and harsh penalties for illegal activities, including violence and illegal firearm possession, near schools. For example, the Gun-Free Schools Act (GFSA), passed in 1994, requires expulsion for students who bring or possess a firearm on school grounds [1, 2]. As well, school security measures have increasingly been utilized to increase student safety. Nationally representative data collected from the U.S. Department of Justice found that in 2011, 69.8% of youth between the ages of 12 and 18 years reported having a security guard or police officer in their school—up 15.7% points from 1999 [3].
Perceptions of school safety are tempered by statistics showing that mass school shootings are extremely rare. Findings from the 2012 School Crime and Safety Survey demonstrated that only 1% of schools surveyed reported a shooting incident. Further, schools reporting at least one shooting incident were five times as likely to be in high crime areas and have majority (> 50%) minority student enrollment. Previous studies have shown that black and brown youth living in high crime areas are much more likely to be exposed to school-based violence and more likely to be victims of violence near school grounds [4]. Nevertheless, while research has focused on examining the correlates and consequences of mass school shootings [5–9], few have investigated the spatial concentration of gun violence in close proximity to schools [4]. Effective violence prevention policies depend on empirical assessments of increased shooting incident exposure (i.e., hearing, witnessing or being a victim of gun violence) that characterize the structural context shaping student experiences, expectations, and outcomes. The goal of the present study was to provide an estimate of the concentration of shootings in areas proximal to Boston Public Schools (BPS), using spatial cluster and K function analysis, to characterize the neighborhood correlates of schools where children are disproportionately exposed to gun violence and to quantify the degree of spatial dependence of shootings with 400-m buffer zones around schools.
Causes and Consequences of Community-Based Violence Exposure
A large body of work has shown that violence is spatially clustered across space and remains stable over time depending on local context [10–14]. In Boston, for instance, most fatal and non-fatal shootings incidents derive from only a fraction of the city’s census block groups and local trends in gun violence have been attributed to a few “hot spot” locations in disadvantaged urban neighborhoods [11–13]. Evidence suggests that gun violence disproportionately impacts young black males living in crime hot spots [15]. According to a recent report issued by the state of Massachusetts, in 2013, the age adjusted homicide rate for black males in Massachusetts was 18 per 100,000—13 times the rate for white males (1.3 per 100,000)—and was the third leading cause of death for young people between the ages of 15 and 24 years [16]. Variations in local crime rates have been attributed to neighborhood structural factors such as low socioeconomic status and racial composition [17–19]. Ecological explanations have tended to focus on sociocultural influences and community characteristics including lack of prosocial opportunities [20], low levels of neighborhood collective efficacy, social and physical disorganizations [21, 22], spatial embeddedness, and neighborhood inequality [23–25].
Consistent with an ecological perspective [26, 27], school and neighborhood crime and violence are microsystem characteristics that represent key contextual features shaping youth developmental outcomes. Violence exposure is a DSM-qualifying trauma [28–31] contributing to the onset and progression of mental health problems [32, 33]. Exposure to violence—either as a witness, victim or as a vicarious bystander—has been linked to psychological symptoms, including depression [34], PTSD [34–36], aggressive, delinquent and violent behaviors [34, 37–40], hopelessness [41], substance use, and incarceration [42]. Youth exposed to gun violence report numerous psychological challenges, including anger, disassociation, anxiety, and depression [43, 44]. Several decades of research have documented a strong association between exposure to neighborhood violence, school safety, and emotional and behavioral outcomes in children and youth [31, 45–55]. Psychological symptoms are heightened for youth who fear being shot [56], have witnessed or heard about the loss of a loved one due to violence, or are repeatedly exposed to community gun violence [36, 57]. Moreover, youth exposed to gun violence are in turn more likely to acquire their own firearms for defense or prestige, thus perpetuating the cycle [43, 58–61]. Particularly important in this regard is the cumulative impact of repeated and chronic violence exposure in neighborhoods, which has been shown to be related to the development of both internalizing [62, 63] (e.g., PTSD, depression and anxiety) and externalizing behavior (e.g., aggression and conduct disorder) [63–65].
School Violence and Academic Achievement
Exposure to gun violence has been demonstrated to impair children’s cognitive functioning and self-regulatory behavior [66]. Previous studies have demonstrated that youth who attend schools in violent areas have substantially lower cognitive assessments and standardized test scores [67]. Trauma symptomatology may be a mediating factor that explains the negative impact of school violence on academic performance and/or achievement. Children experiencing trauma have an increased risk for poor psychosocial outcomes due to alterations in normal stress responses and/or inability to regulate fear, anger, and sexual impulses [64, 68]. Operating through posttraumatic stress disorder, exposure to gun violence has been linked to sleep disorders, difficulty concentrating in the classroom, and school failure [60, 69–71]. Studies have shown that symptoms of posttraumatic stress, anxiety, and depression among violence exposed youth compromises student-teacher relationships and perceptions of danger at school, which in turn negatively influences students’ sense of psychological engagement in school and reduces confidence in their ability to meet school-related demands and challenges [72].
The Present Study
Although the developmental consequences of violence exposure are well-documented [40], surprisingly, little research has examined schools in proximity to gun violence and whether gun violence tends to cluster in areas proximal to elementary, middle, and high schools. While violence and victimization are spatially and temporally concentrated across a small number of census block groups, many more children witness and/or hear about such violence in their community than directly experience it [36, 44]. The author knows of only one study to date, a research report sponsored by the Urban Institute, exploring concentrations of gun violence near schools. According to this report, 54% of schools in the District of Colombia had at least one “burst” of gunfire within 1000 ft of the school; 9% of schools experienced 48% of gunfire incidents within 1000 ft; and four schools, including two middle schools and an elementary school, had 9 to 11 incidents within 500 ft [4].
The present investigation builds on previous research by using spatial cluster and K function analyses to explore concentrations of gun violence near schools, identify clusters of gun violence at various spatial scales, and examine the characteristics of communities with high concentrations of gun violence. Previous scientific inquiries have typically examined aggregated shooting incidents at higher units of analysis (i.e., census blocks) rather than as spatial patterns generated by point processes with known distributions. The K function identifies distances at which clustering occurs at various spatial scales without the need to aggregate spatial points into larger units. Also, the K function makes it possible to compare theoretical distributions of shooting locations near schools to what would be expected under complete spatial randomness (CSR). Applications using K function analysis have been extensively utilized to examine local food environments in proximity to schools [73–75]; however, no study to date has explored the spatial dimensions of gun violence proximal to schools using these advanced statistical techniques.
Methods
Databases
Geocoded databases of shooting and school locations were used to examine locational patterns of firearm shootings and elementary, middle, and high schools in Boston, MA. A publicly available database of crime incident reports was downloaded from the open web portal for the city of Boston (data.cityofboston.gov) for the years 2012–2015. The database contained information about the type of crime committed; detailed information on the type of weapon used; day, time, and year that the incident took place; as well as the geocoded address location for each incident. All assaultive cases of gun violence (i.e., where a shooting incident occurred) were selected on the basis of previous research that shows assaultive gun violence outnumbers gun-related homicides by about 100 to 1 [36].
A shapefile containing a point data layer of each school location in Massachusetts was downloaded from the Massachusetts Office of Geographic Information (http://www.mass.gov). Utilizing information from the Massachusetts Department of Elementary and Secondary Education (ESE) school profiles database, school locations were coded based on student attendance in kindergarten through high school. Categories of schools include public, private, charter, and approved and unapproved special education. Neighborhood level measures at the census block group level were downloaded from the Center for Geographic Analysis at Harvard University (worldmap.harvard.edu). Measures included demographic features associated with social disorganization (i.e., median income and racial homogeneity) derived from the American Community Survey (2005–2009) estimates for the Census block groups of Boston. Finally, two separate shapefiles containing neighborhood and street boundaries, respectively, were downloaded from the Boston Open Data portal. The number of gunshots was recorded and merged with data from both the Department of Education and American Community Survey.
Statistical Analysis
Using multiple methods for the analysis of spatial point data, the locational or clustering patterns of shooting incidents in proximity to Boston public schools were examined. Clusters are defined as an excess or deficit of events across a geographic area measured relative to a null hypothesis that the data is generated by complete spatial randomness (CSR). To begin, first-order properties, such as summary statistics (mean, median, intensity and average nearest neighbor distance), were estimated to capture important features of shooting patterns. Kernel smoothing was used to determine the intensity of gun shootings for a spatially inhomogeneous process, defined as the localized expected density of shooting locations per kilometer. To determine the optimal level of smoothing, the bandwidth that minimized the mean square error [76] was chosen. Spatial clustering detection was based on a nearest neighbor and G function analysis. The nearest neighbor analysis tests for statistically significant clustering and returns an index value which indicates whether clustering exists and the strength of the clustering. If the result generated from the index value is less than 1, the shooting incidents are closer than what would have been expected to occur by chance (Paulsen and Robinson 2009). The G function measures the cumulative distribution of points as a function of the distance between each point and its nearest neighbor. These tests do not reveal where the clustering occurs. Therefore, second-order summary functions including the reduced second moment measure (i.e., K function) and its linear transformation (i.e., L function) were estimated to detect violations of CSR in gun violence at spatial scales. The K function calculates the expected number of extra events, X, within a distance, r, of a randomly selected point:
Unlike alternative summaries of distance from random points to nearest neighbors (e.g., nearest neighbor, cumulative distribution functions), the K function describes characteristics of point processes at many distance scales. The pair correlation function (pcf), g(t), was then used to estimate the number of shooting pairs separated by some distance r. The pcf describes how likely it is that two events chosen at random will be at a given distance.
Next, the number of shooting incidents located within a 400-m buffer of each school was calculated to approximate a 5-min walking time commonly utilized by public health researchers [74]. The mapping and analytic capabilities of a geographic information system running the open-source QGIS software, available at http://www.qgis.org/en/site/, were utilized to create 400-m buffers around each school and the number of shooting incidents within buffers of each size was recorded. To describe the shooting incident distribution around schools, the mean, median, and range of the number of shootings and the proportion of schools with at least one shooting incident within the 400 m buffer were calculated. The “cross-K” function (also known as the bivariate K function) method estimates the spatial dependence between two different types of locations in a geographic region, identifying distances within which spatial dependence is evident and testing the statistical significance of the observed clustering relative to expected distribution of points if there were no spatial dependence. The cross-K function was used to count the expected number of additional random points (i.e., intensity per unit area) of shooting incidents, y, within a given distance, r of schools, x. For a fixed distance r, this represents the expected number of shootings within distance r of an arbitrarily chosen school, normalized by the local densities of shootings. Such an analysis is needed if the spatial distribution of gun violence is not distributed evenly across Boston (i.e., the study area) [73, 77]. In the bivariate case, the cross-K function examines shooting incident locations relative to schools for spatial clustering. The estimate of the bivariate cross-K function is given by the following:
where x is the school location, y is the shooting incident location, A is the area of the observation region, wx(y) is the edge correction weight, and λ̂′s are the estimates of the school and shooting intensity at x and y, respectively. The sum is over each school-shooting pair, i.e., for each school, the number of shootings within a distance r away.
The study area used for the analysis was confined to the urban built environment of Boston. To define the proper boundary for the study area, a convex hull polygon covering the school locations was created. A convex hull is the smallest convex polygon bounding all members of a point set. To eliminate edge effects, the weighting factor was used to “correct for” any shooting incidents that took place outside of the polygon window. Edge effects might occur, for example, if shootings located outside the study area boundary were not counted even if they fell within the 400 m buffer area. The weighting function adjusts for shootings close to the study boundary so that the cross-K function properly describes the clustering of shootings near schools. The empirical cross function was therefore defined as the cumulative average number of data points lying within a distance r of a typical data point, corrected for edge effects, and standardized by the intensity.
Data analysis was first conducted on the city of Boston, and then, three additional stratified analyses were undertaken. First, spatial dependence was conducted across neighborhoods. Second, Boston-derived demographic measures of median household income and racial homogeneity by block group were merged with the spatial point data and an examination of three strata of median annual household income and racial composition was conducted. These estimates were both grouped into tertiles defined as high, moderate, and low regions for each variable (low income < $36,820; medium income ≥ $36,820 and < $57,950; high income ≥ $57,950; low “minority” < 0.313; medium minority ≥ 0.313 and < 0.472; high minority ≥ 0.472). Minority was defined as the proportion of residents identifying as either African-American or Latino within each neighborhood. Each school was assigned a value by calculating an area-weighted average of block groups that intersect the school buffer.
Since the databases used are not samples but censuses of schools and shooting locations in Boston, no tests of statistical significance were conducted for the results presented in Tables 1 and 2. In contrast, second-order summary functions allow for a comparison of theoretic and observed distributions by creating 95% envelopes used to test hypotheses about the spatial phenomena. Therefore, statistical tests were appropriate for the univariate and bivariate K function analyses, which examine differences between observed and expected clustering. The statistical analysis of spatial point patterns and dependence was performed using the spatstat and splancs functions available in the R statistical package. QGIS version 2.7 was used for the GIS analysis.
Table 1.
Number of schools and shootings and distance in meters from any school to closest shooting location, overall, and by neighborhood characteristic strata: Boston, 2012–2015
| School no. | Shooting no. | Distance (km) | ||||
|---|---|---|---|---|---|---|
| Mean | SD | Median | Range | |||
| Boston, overall | 133 | 672 | 0.35 | 0.17 | 0.33 | 0.01–0.92 |
| Neighborhoods | ||||||
| Charlestown | 4 | 11 | 0.20 | 0.04 | 0.18 | 0.17–0.25 |
| Dorchester | 26 | 292 | 0.20 | 0.22 | 0.11 | 0.01–0.91 |
| East Boston | 11 | 26 | 0.22 | 0.17 | 0.19 | 0.07–0.62 |
| Fenway | 6 | 2 | 0.74 | 0.39 | 0.81 | 0.29–1.3 |
| Hyde Park | 10 | 11 | 0.41 | 0.32 | 0.32 | 0.19–1.3 |
| Jamaica Plain | 13 | 58 | 0.36 | 0.37 | 0.17 | 0.01–1.3 |
| Mattapan | 5 | 27 | 0.21 | 0.09 | 0.19 | 0.11–0.32 |
| Mission Hill | 2 | 19 | 0.13 | 0.02 | 0.13 | 0.12–0.14 |
| Roslindale | 7 | 6 | 0.66 | 0.52 | 0.59 | 0.12–1.5 |
| Roxbury | 15 | 188 | 0.16 | 0.09 | 0.15 | 0.02–0.34 |
| South Boston | 8 | 12 | 0.39 | 0.35 | 0.29 | 0.16–1.2 |
| South End | 4 | 18 | 0.30 | 0.10 | 0.31 | 0.19–0.38 |
| West Roxbury | 7 | 0 | 1.19 | 0.67 | 1.20 | 0.44–2.2 |
Table 2.
Number of shootings within 400 m of any school, overall, and by neighborhood characteristic strata: Boston, 2012–2015
| Number of shootings w/in 0.4 km (400 m) of a school | Schools w/ at least one shooting within 400 m, no. (%) | ||||||
|---|---|---|---|---|---|---|---|
| Mean | S.D. | Range | 5th percentile | Median | 75th percentile | ||
| Boston, overall | 5.14 | 6.83 | 0–27 | 0 | 2 | 20.4 | 74 (55.6) |
| Neighborhoods | |||||||
| Charlestown | 2.75 | 0.957 | 2–4 | 2 | 2.5 | 3.75 | 4 (100) |
| Dorchester | 11.23 | 8.43 | 0–27 | 0 | 12 | 16.25 | 24 (92.3) |
| East Boston | 2.36 | 2.20 | 0–6 | 0 | 1 | 4 | 10 (90.9) |
| Fenway | 0.33 | 0.516 | 0–1 | 0 | 0 | 1 | 2 (33.3) |
| Hyde Park | 1.10 | 0.994 | 0–3 | 0 | 1 | 2 | 7 (70) |
| Jamaica Plain | 4.46 | 6.13 | 0–15 | 0 | 1 | 10 | 8 (61.5) |
| Mattapan | 5.40 | 2.97 | 1–9 | 1 | 5 | 8 | 5 (100) |
| Mission Hill | 9.50 | 6.36 | 5–14 | 5 | 9.5 | 14 | 2 (100) |
| Roslindale | 0.86 | 1.22 | 0–3 | 0 | 0 | 2 | 3 (42.9) |
| Roxbury | 12.53 | 7.27 | 1–23 | 1 | 13 | 20 | 15 (100) |
| South Boston | 1.5 | 1.20 | 0–3 | 0 | 1.5 | 2.75 | 6 (75) |
| South End | 4.5 | 4.73 | 1–11 | 1 | 3 | 9.50 | 4 (100) |
| West Roxbury | 0 | 0 | 0 | 0 | 0 | 0 | 0 (0) |
Results
Descriptive Statistics
Between 2012 and 2015, there were 678 shooting incidents in the study area (Fig. 1a). Most shooting incidents took place in two neighborhoods, Dorchester (43.5%) and Roxbury (27.9%). Dorchester (67.0%) and Roxbury (68.4%) residents primarily identify as persons of color, either Latino or African-American. Mattapan, however, has the largest proportion of black and/or Latino residents (92.1%) among all Boston neighborhoods. Medium income is lowest in Roxbury ($26,280) compared to all other neighborhoods; median income in Dorchester is higher ($46,965) whereas median income is highest in West Roxbury ($78,670) and Charlestown ($89,828). West Roxbury (73.3%) and Charleston (75.8%) are majority white neighborhoods.
Fig. 1.

a Shooting locations around school locations. b Intensity of shooting incident locations
First- and Second-Order Properties of Shooting Incident Locations
To explore the spatial pattern of the 678 shooting incidents, the K and G functions along with the intensity function vis-a-vis the point patterns were estimated using the spatstat function in the R statistical package. The point locations of the shooting incidents are displayed in the convex polygon boundary map that is shown in Fig. 1a.
The intensity of shootings in the study area is shown in Fig. 1b. Smoothing was based on the optimal bandwidth of 0.41. The average density was 5.1 shooting incidents per square kilometer. The results suggest that the peak of intensity of shootings took place in the Dorchester neighborhood of Boston.
Figure 2a shows the histogram of nearest neighbor distances. The mean nearest neighbor distance was 0.095, with a standard deviation of 0.181. The results revealed that most shooting incidents occurred within 0.5 km of each other. The nearest neighbor index (the ratio of the actual to the random nearest neighbor distance) was 0.335 (p < .001, O = 95.16 m, E = 284.41 m), indicating that the distribution of nearest neighbors of shooting locations is significantly smaller than what would be expected by chance. Results of the G function analysis are shown in Fig. 2b. Reading panel (b) in Fig. 2, the value G(r) = 0.5 (median) is achieved at about r = .06 km so the median of the distribution of nearest neighbor distance is about 60 m. Since the nearest neighbor distances of gun incidents are shorter than they are for a Poisson process, the results suggest a clustered pattern of gun shooting incidents. Figure 3 shows the results from the estimated L function (Lest in spatstat) using the Ripley’s edge correction. For all shooting incidents, the observed K function was above the expected value for all distances between 0 and 3.2 km. Similarly, since the observed values lie outside of both the 95% confidence interval and the expected values for all distances up to 3.2 km, the plot of the linear transformation (L(t) − t vs. distance) (Fig. 3a) presents strong evidence of statistically significant clustering of shootings incidents. As shown from the figure, after adjusting for intensity, a typical shooting point pattern has more clustered neighbors than what would be observed if shooting incidents were located randomly throughout the city.
Fig. 2.

a Histogram of nearest neighbor distances of shooting incidents. b Clustering of shooting locations in Boston (2012 - 2015) using G Function analysis
Fig. 3.

Linear transformation of the Ripley’s K function (Lest in spatstat) using the edge correction method with 95% simulation envelopes (left) and log of g(r) pairwise correlation function (right).
The pair correlation function was used to explore the spatial scale of the shooting incident patterns (Fig. 3b). The pair correlation identifies different spatial processes that may be operating at different distances (e.g., inhibition at short distances and clustering at larger distances). In contrast to the K and L functions, the pcf function addresses how likely it is to observe a shooting incident at some distance, r, away (e.g., 0.01, 1, or 10 km), conditional on the presence of a shooting incident at a fixed location (Fig. 3b). The scale of the spatial patterning is clarified by the plot of g(t). The function was log standardized so that a value of log(g(r)) = 0 is consistent with CSR; log(g(r)) < 0 indicates that interpoint distances less than r are less frequent than would be expected for CSR; and log(g(r)) > 0 indicates that the interpoint distance is more frequent than expected for CSR, which suggests clustering. As shown from the figure, g(r) is well above 0 when r is small, indicating that shootings tend to cluster at smaller spatial scales. Therefore, there are more pairs of events at smaller distances than would be expected to occur by chance. As distance increases, the plot shows that the spatial patterning of shooting incidents approaches a completely spatially random (CSR) process.
Proximity of Schools to Gun Violence
Figure 4 presents a distribution of the number of schools and number of shootings within the 400-m buffer zone. As shown by Fig. 4, 41 schools had no shootings, 44 had 1–4 shootings, 21 schools had 5–9 shootings, 15 schools had 10–15 shootings, and 13 schools had 16 or more shootings within the 400-m radius. The map presented in Fig. 5 shows the location of shootings and schools included in the analyses and indicates schools with at least one shooting within 400 m. Figure 6 zooms in on the 400 m buffers (the circles on the map) around a select number of schools in the neighborhoods of Roxbury and Dorchester. The darker lines show the neighborhood boundary while the faded lines show the census block group. The number of shootings in each census block group is displayed on the map. Two schools were tied for the most gun violence—the Burke High School and the Holland Elementary School, with 54 shooting incidents occurring in the 400-m buffer zone over the 4-year period. Seven and half percent of schools (10 of 133) experienced just over 30% percent of gunfire incidents within 400-m.
Fig. 4.

Histogram of number of school shootings in Boston (2012–2015) within a 400-m radius from school
Fig. 5.

Location of Boston shootings and schools included in the analyses and indicates schools that have at least one shooting within 400 m (2012–2015)
Fig. 6.

Buffer zones around schools and shooting counts within blocks surrounding school buffer zone
Table 1 presents the number of schools and shooting incidents and the distance from any school to the nearest shooting location in Boston overall and within each stratum of neighborhood characteristics. In Boston, the mean and median distance from any school to the nearest shooting location was 0.35 and 0.33 km, respectively (Table 1). Table 1 also shows the average distance of shooting incidents by neighborhood, suggesting that average distance varies across place. For example, smallest and largest average distances were 0.13 and 1.19 in the neighborhoods of Roxbury and West Roxbury, respectively. The most shooting incidents took place in Dorchester (292) and Roxbury (188). In these neighborhoods, the mean and median distance from any school to the nearest shooting location was 0.20 and 0.18 km in Dorchester and 0.16 and 0.09 km in Roxbury. The neighborhood of West Roxbury had no shooting incidents within the 400 m buffer of any of its seven schools. The mean and median distance of shootings near schools was greater in neighborhoods with higher levels of median income and persons of color.
Associations between racial composition and median income and both average distance from any school to the nearest shooting incident and number of shooting incidents within 0.25 miles of the school buffer zone were tested using Poisson regression. Results indicated that racial composition, but not median income, significantly predicted both mean distance from any school to the nearest shooting incident χ2 = 14.76, p < .001) and number of shooting incidents (χ2 = 9.23, p = .01). To make the output more tangible, the margin command was used to predict the expected average distance from any school to the nearest shooting incident and number of shooting incidents, respectively, at each level of racial composition. The predicted mean distance from any school to the nearest shooting incident distance for neighborhoods with high, medium, and low levels of minority residents was 0.25, 0.36, and 0.62, respectively. However, predicted differences across levels of median income were statistically indistinguishable (0.42, 0.39, and 0.38). Similarly, the predicted number of shootings within 0.25 miles for neighborhoods with high, medium, and low levels of minority residents was 13.5, 4.1, and 2.7, respectively. The predicted number of shooting incidents within 0.25 miles across levels of median income was not statistically significant (5.78, 6.73, and 7.86). Figures 7 and 8 plot the predicted average distance from any school to the nearest shooting incident and shooting incidents within 0.25 miles by racial composition quartile and across levels of income. The visual analysis confirms the statistical results. Holding median income constant, racial composition was significantly associated with the density and clustering of shooting incidents near schools.
Fig. 7.
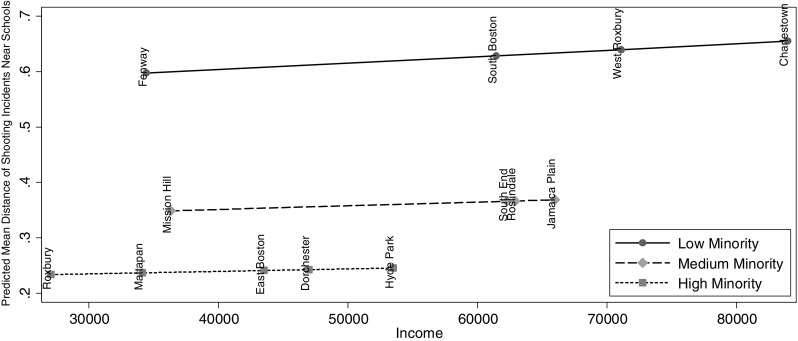
Shootings near schools by neighborhood racial composition and median income
Fig. 8.
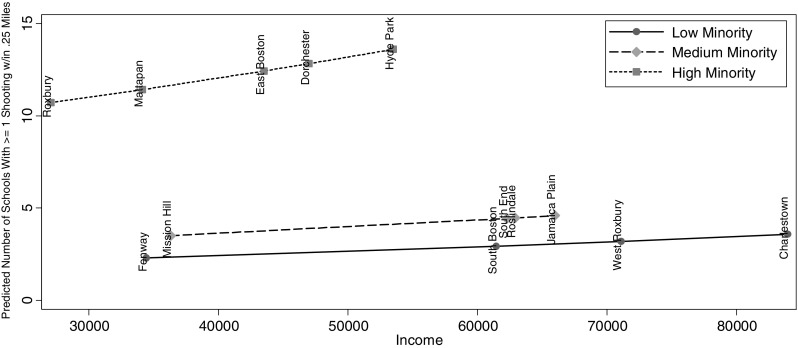
Shooting incidents within 400 m of schools by neighborhood racial composition and median income
Table 2 shows the means, medians, and ranges for the number of shootings in 400-m-radius buffers around schools. In Boston, overall, the number of shootings within 400 m of a school ranged from 0 to 27. The average number of shooting incidents was 5.14 (SD = 6.82, min = 0, max = 27). A majority (56%, 74/133) of schools in Boston had at least one shooting incident within 400 m (Fig. 5), which would take students approximately 5 min to walk if traveling by foot. Among the schools with at least one incident, the average number of shootings was 7.09 (SD = 7.13, min = 1, max = 27). For schools within regions stratified by neighborhood, the percentage of schools with at least one shooting incident within 400 m ranged from 0 to 100% (Table 2). In five Boston neighborhoods, Charlestown, Mattapan, Mission Hill, Roxbury, and South End, every school had at least one shooting within 400 m. One neighborhood, West Roxbury, had no shooting incidents within 400 m of any of its seven schools. Apart from these extremes, the percentage of schools with at least one shooting incident within 400 m ranged from 33.3 to 92.3%.
Spatial Clustering of Shooting Incidents near Schools
The next aim was to examine the spatial patterning between the shooting incidents and the location of each Boston school. Figure 9 shows the results of the cross-K analysis. The rows correspond to school locations and the columns to the shooting locations. The diagonal panels show the ordinary K functions for the school and shootings layers, respectively. The top right panel shows the cumulative distribution function of the distance from a shooting to the nearest school. The solid line represents the observed value of the K function, and the dotted line represents the expected value of the K function under the assumption of no spatial dependence between shooting locations and schools. The dashed lines represent the upper and lower bounds of the 95% confidence interval around the expected value dotted line. Confidence intervals are based on 499 simulations with the data under the assumption of no spatial dependence. The observed value of the cross-K function in Fig. 6 falls above the 95% confidence interval between distances of roughly 0.5 and 3 km on the x-axis, indicating that a significantly greater number of shootings are located within a short distance from schools than would be expected if there were no spatial dependence. Since the cross-K function is positive, increasing, and significant, there is evidence of an excess of shootings at very small distances from schools between 0.5 and 3.2 km.
Fig. 9.

K analysis with a school locations and b shooting locations. The upper plot shows the K function results for spatial dependence among shooting incidents, respectively. The lower plot shows the results from the Bivariate K analysis depicting spatial dependence between shooting incidents and school locations.
The K function makes it possible to estimate the excess proportion of shooting incidents near schools, which is a relevant summary of the clustering. This is easily estimated as K(t)/E[K(t)] − 1. Results suggest that about six and three times as many shooting incidents occur within an area up to 0.4 km (400 m) and 4 km from schools, respectively, than would be expected if the shootings were distributed throughout the city in a way that was unrelated to the location of schools (Fig. 10).
Fig. 10.

Relative concentration of shootings and distance from Boston Public School (km)
To investigate whether continuous shootings are more frequent (i.e., higher intensity) close to schools, a log linear regression estimated shooting intensity on distance to nearest school (log intensity = β0 + β1distance+error). A strong association was found between distance to the nearest school and the log intensity of continuous gun shootings. The slope was − 3.29 (p < .001) and intercept was 3.10 (p < .001). These results suggest that every additional kilometer distance from a school decreases the number of continuous shootings per square kilometer by 96%.
Discussion
This represents the first study to examine the spatial distribution of patterns of shooting locations in relation to schools in a large urban city. Results from this study contribute to our understanding of the intersection between environmental justice and children’s physical and mental well-being, particularly among youth of color living in violent neighborhoods. The present study is in accordance with previous research showing that gun violence is concentrated in neighborhood hot spots. This study adds to the extant literature by demonstrating that gun violence clusters in neighborhoods on blocks within short distances from schools. The analysis revealed that up to six times as many shootings occur within 400 m of schools than would be expected if the shootings were located around the city in a way unrelated to schools. In the city overall, the median distance from any school to the nearest shooting location was 330 m (0.330 km), indicating that in half the city’s schools, students need to walk less than 5 min before potentially encountering a violent shooting incident. More than half of schools in Boston had at least one shooting incident within 400 m. In two neighborhoods, Dorchester and Roxbury, the median distance from any school to the nearest shooting event was only 106 and 151 m, respectively. Two schools, the Burke High School and the Holland Elementary School, each had 54 shooting incidents occur within the 400 m buffer during the period in question. Just over 30% of the shootings were concentrated in only 10 of the 133 schools. The school closest to any shooting incident, the Greater Egleston High School, was located only a few feet away from gunfire.
Results from this study also suggest that gun violence clusters near schools located in low-income, racially homogenous areas (i.e., in hot spots). The analysis revealed higher concentrations of violence near schools in four specific Boston neighborhoods with larger proportions of non-white residents and lower concentrations of violence near schools in higher income, mostly white neighborhoods. Given the strong clustering pattern of gun violence near schools, the present study suggests that youth attending public schools in minority neighborhoods assume a higher risk of traumatic sequelae and poor psychosocial outcomes including academic achievement. Of course, it is impossible to know the racial composition of students attending schools, given the ecological nature of this study. Therefore, future research should continue to explore both individual and neighborhood characteristics as potential contributors to clusters of gun violence with short distances of school grounds.
In accordance with previous research demonstrating the effectiveness of proactive place-based strategies, these findings suggest that an exclusive focus on gun violence perpetration without incorporating the neighborhood characteristics in which schools are located is an ineffective approach to violence prevention. From the perspective of prevention and intervention, the results reinforce the importance of understanding co-occurring, cumulative, and competing risks for youth attending schools in areas with high levels of gun violence. In this regard, the current investigation may help shed light on the effectiveness of a place-based initiatives aimed at, among other things, enhancing student safety. One such initiative is Safe Routes to School (SRTS). Launched in 2016, the city of Boston, in collaboration with the Boston Public Health Commission and Boston Public Schools, implemented SRTS “to make walking to school safe, popular and fun []” [78]. The SRTS program aims to create safe environments and opportunities for children to use “active transportation” to school, with an overall goal to increase children’s physical activity levels [79]. A recent survey conducted by the Boston Public School system showed that approximately one in five (20%) K-8 students attending Boston public schools walk to and from school [78]. Part of the program’s strategy is to improve the city’s infrastructure by targeting the physical conditions that surround a school, establishing safer pathways to and from school, and providing police presence to enhance safety along travel routes [79]. As of August 2017, 18 schools have adopted the SRTS program. These schools are shown in the map below (Fig. 11) along with the number of shootings within the school’s 400 m buffer. As shown by the map, one third of the schools participating in the SRTS initiative were free from gun violence in each of the 4 years considered in this study. However, seven of the 18 participating schools experienced six or more shootings in this timeframe. While it is too soon to gauge the impact of this initiative on safety, these schools may benefit the most from safety enhancements for children who walk to and from school. To be successful in achieving their stated goal, it will be important for the SRTS initiative to understand how various strategies will play out in the adoption, implementation, and evaluation of the success of the SRTS initiative. Increasing children’s level of physical activity, while an important and worthwhile goal, should be weighed by the increased risk of violence exposure on the commute to and from school. To achieve its goals, the SRTS program, and similar initiatives, must adopt strategies that are tailored to the needs of the population. If they are not, then students attending schools in communities characterized by low levels of violence are going to be better off as a direct result of the program whereas students attending schools in violent areas will be relatively worse off. Future studies should attempt to gauge the effectiveness of these place-based initiatives using advanced spatial analyses to gain deeper understanding of measures to increase student safety and security near schools. Taken together, these studies point to the need for broader strategies that elucidate the structural characteristics of schools in neighborhoods that demonstrate spatial patterning of gun violence near schools potentially affecting their mental and physical health.
Fig. 11.

Concentration of Boston shootings within 400 m buffer zones of schools participating in the Safe Routes to School Program (2012–2015)
Despite the novel approach to exploring issues of student safety near school, the present study is not without limitations. First, ecological studies such as the present investigation are limited because aggregate measures cannot reliably be projected onto individuals. To move closer to causal interpretations, individual-level data must be collected and incorporated into the analyses. Moreover, because the data are from Boston, the results may not be generalizable to other cities. As well, the present research was not able to explore the correlates or consequences of specific acts of violence on long-term outcomes. This points to the need for additional analyses exploring how the chronicity and intensity of violence exposure in proximity to schools contributes to poor student achievement and mental and physical health.
Although widely publicized instances of mass school shootings have been deemed a major public health problem, they represent less than 1–2% of homicides against youth [1]. Current policies aimed at keeping student’s safe may feed into public perceptions that students are not safe at school but do little to address the broader social determinants of gun violence that perpetuate health and educational disparities. In high crime areas, for example, student safety measures are often punitive, harsh, and disproportionately impact black and brown students attending schools in high poverty neighborhoods. Interestingly, rather than focus on the mental health needs of students attending schools with high concentrations of gun violence in proximity to schools, studies have focused on the mental health needs of the communities following a mass school shooting event [80–82] or have emphasized school security measures and weapons-free schools. These measures may benefit students attending predominantly white schools in high income neighborhoods but do not address the broader needs of all students. Research has shown that social disorder and community distress operating through increased violence exposure contributes to an unpredictable and chaotic environment which results in hopelessness, avoidance, and hypervigilance. The frequency of these events “confronts people with the stark reality that their community’s capacity to offer safety and support may be shattered by violence and death at any time” [35]. Future research would benefit from exploring school violence from a spatio-temporal perspective to facilitate the enactment of proactive policies that minimize traumatic sequelae among students attending schools in racially homogenous and low-income neighborhoods with continuously high concentrations of shooting events in close proximity.
Acknowledgements
This research was supported by funding from the Youth Violence Prevention Collaborative through the State Street Foundation.
References
- 1.Borum R, Cornell DG, Modzeleski W, Jimerson SR. What can be done about school shootings? A review of the evidence. Educ Res. 2010;39(1):27–37. doi: 10.3102/0013189X09357620. [DOI] [Google Scholar]
- 2.Mayer MJ, Leone PE. School violence and disruption revisited: equity and safety in the school house. Focus Except Child. 2007;40(1):1. [Google Scholar]
- 3.Kupchik A, Brent JJ, Mowen TJ. The aftermath of Newtown: more of the same. Br J Criminol. 2015;55(6):1115–1130. doi: 10.1093/bjc/azv049. [DOI] [Google Scholar]
- 4.Bieler S, La Vigne N. Close-range gunfire around DC schools. Washington, D.C.: Urban Institute; 2014.
- 5.Fein RA. Threat assessment in schools: a guide to managing threatening situations and to creating safe school climates. Washington, D.C.: DIANE Publishing; 2002.
- 6.Kimmel M. Profiling school shooters and shooter’s schools. There is a gunman on campus: tragedy and terror at Virginia Tech. 2008;65.
- 7.Kaiser DA. School shootings, high school size, and neurobiological considerations. J Neurother. 2006;9(3):101–115. doi: 10.1300/J184v09n03_07. [DOI] [Google Scholar]
- 8.Thompson S, Kyle K. Understanding mass school shootings: links between personhood and power in the competitive school environment. J Prim Prev. 2005;26(5):419–438. doi: 10.1007/s10935-005-0006-8. [DOI] [PubMed] [Google Scholar]
- 9.Baird AA, Roellke EV, Zeifman DM. Alone and adrift: the association between mass school shootings, school size, and student support. Soc Sci J. 2017;54:261–270. doi: 10.1016/j.soscij.2017.01.009. [DOI] [Google Scholar]
- 10.Klein S, Merritt DH. Neighborhood racial & ethnic diversity as a predictor of child welfare system involvement. Child Youth Serv Rev. 2014;41:95–105. doi: 10.1016/j.childyouth.2014.03.009. [DOI] [Google Scholar]
- 11.Sherman LW, Gartin PR, Buerger ME. Hot spots of predatory crime: routine activities and the criminology of place. Criminology. 1989;27(1):27–56. doi: 10.1111/j.1745-9125.1989.tb00862.x. [DOI] [Google Scholar]
- 12.Weisburd D, Eck JE. What can police do to reduce crime, disorder, and fear? Ann Am Acad Pol Soc Sci. 2004;593(1):42–65. doi: 10.1177/0002716203262548. [DOI] [Google Scholar]
- 13.Braga AA, Papachristos AV, Hureau DM. The concentration and stability of gun violence at micro places in Boston, 1980–2008. J Quant Criminol. 2010;26(1):33–53. doi: 10.1007/s10940-009-9082-x. [DOI] [Google Scholar]
- 14.Barboza GE. The geography of child maltreatment: a spatiotemporal analysis using Bayesian hierarchical analysis with integrated nested Laplace approximation. J Interpers Violence. 2016. 10.1177/0886260516639583. [DOI] [PubMed]
- 15.Kennedy DM, Piehl AM, Braga AA. Youth violence in Boston: gun markets, serious youth offenders, and a use-reduction strategy. Law Contemp Probl. 1996;59(1):147–196. doi: 10.2307/1192213. [DOI] [Google Scholar]
- 16.Massachustts Co. 2013 Mortality report. http://www.mass.gov/eohhs/docs/dmr/reports/mortalityreport2013.pdf 2013.
- 17.Shaw CR, McKay HD. Juvenile delinquency and urban areas. Chicago: University of Chicago Press; 1942.
- 18.Shaw CR, McKay HD. Juvenile delinquency and urban areas. Revised edition. Chicago: Chicago University Press; 1969.
- 19.Sampson RJ, Groves WB. Community structure and crime: testing social-disorganization theory. Am J Sociol. 1989;94(4):774–802. doi: 10.1086/229068. [DOI] [Google Scholar]
- 20.Borum R. Evaluating violence risk in children and adolescents. The Oxford Handbook of Behavioral Emergencies and Crises 2016:60.
- 21.Chang LY, Wang MY, Tsai PS. Neighborhood disadvantage and physical aggression in children and adolescents: a systematic review and meta-analysis of multilevel studies. Aggress Behav. 2016;42(5):441–454. doi: 10.1002/ab.21641. [DOI] [PubMed] [Google Scholar]
- 22.Spano R, Pridemore WA, Bolland J. Are exposure to violence and violent behavior precursors for initiation of gun carrying for poor, urban minority youth? J Interpers Violence. 2012;27(1):158–176. doi: 10.1177/0886260511416471. [DOI] [PubMed] [Google Scholar]
- 23.Morenoff JD, Sampson RJ, Raudenbush SW. Neighborhood inequality, collective efficacy, and the spatial dynamics of urban violence. Criminology. 2001;39(3):517–558. doi: 10.1111/j.1745-9125.2001.tb00932.x. [DOI] [Google Scholar]
- 24.Korbin JE, Coulton CJ, Chard S, Platt–Houston C, Su M. Impoverishment and child maltreatment in African American and European American neighborhoods. D5ev Psychopathol. 1998;10(2):215–233. doi: 10.1017/S0954579498001588. [DOI] [PubMed] [Google Scholar]
- 25.Sampson RJ, & Wilson WJ. Toward a theory of race, crime, and urban inequality. In Gabbidon, S. L. & Greene, H. T. (Eds.), Race, crime, and justice: A reader; 1995. pp. 37–54. Abingdon, England: Taylor & Francis.
- 26.Bronfenbrenner U. Contexts of child rearing: problems and prospects. Am Psychol. 1979;34(10):844–850. doi: 10.1037/0003-066X.34.10.844. [DOI] [Google Scholar]
- 27.Garbarino J, Abramowitz RH. The ecology of human development. Children Fam Soc Environ. 1992;2:11–34. [Google Scholar]
- 28.Finkelhor D, Shattuck A, Turner HA, Hamby SL. Trends in children’s exposure to violence, 2003 to 2011. JAMA Pediatr. 2014;168(6):540–546. doi: 10.1001/jamapediatrics.2013.5296. [DOI] [PubMed] [Google Scholar]
- 29.McLaughlin KA, Koenen KC, Hill ED, Petukhova M, Sampson NA, Zaslavsky AM, Kessler RC. Trauma exposure and posttraumatic stress disorder in a national sample of adolescents. J Am Acad Child Adolesc Psychiatry. 2013;52(8):815–830. e814. doi: 10.1016/j.jaac.2013.05.011. [DOI] [PMC free article] [PubMed] [Google Scholar]
- 30.Overstreet S, Chafouleas SM. Trauma-informed schools: introduction to the special issue. Sch Ment Heal. 2016;8(1):1–6.
- 31.Perfect MM, Turley MR, Carlson JS, Yohanna J, Saint Gilles MP. School-related outcomes of traumatic event exposure and traumatic stress symptoms in students: a systematic review of research from 1990 to 2015. Sch Ment Heal. 2016;8(1):7–43. doi: 10.1007/s12310-016-9175-2. [DOI] [Google Scholar]
- 32.Campbell C, Schwarz DF. Prevalence and impact of exposure to interpersonal violence among suburban and urban middle school students. Pediatrics. 1996;98(3):396–402. doi: 10.1016/S0022-3476(96)70072-0. [DOI] [PubMed] [Google Scholar]
- 33.Fitzpatrick KM, Boldizar JP. The prevalence and consequences of exposure to violence among African-American youth. J Am Acad Child Adolesc Psychiatry. 1993;32(2):424–430. doi: 10.1097/00004583-199303000-00026. [DOI] [PubMed] [Google Scholar]
- 34.Messer SC, Gross AM. Childhood depression and aggression: a covariance structure analysis. Behav Res Ther. 1994;32(6):663–678. doi: 10.1016/0005-7967(94)90023-X. [DOI] [PubMed] [Google Scholar]
- 35.Horowitz K, Weine S, Jekel J. PTSD symptoms in urban adolescent girls: compounded community trauma. J Am Acad Child Adolesc Psychiatry. 1995;34(10):1353–1361. doi: 10.1097/00004583-199510000-00021. [DOI] [PubMed] [Google Scholar]
- 36.Slovak K. Gun violence and children: factors related to exposure and trauma. Health Soc Work. 2002;27(2):104–112. doi: 10.1093/hsw/27.2.104. [DOI] [PubMed] [Google Scholar]
- 37.Flannery DJ, Singer MI, Wester K. Violence exposure, psychological trauma, and suicide risk in a community sample of dangerously violent adolescents. J Am Acad Child Adolesc Psychiatry. 2001;40(4):435–442. doi: 10.1097/00004583-200104000-00012. [DOI] [PubMed] [Google Scholar]
- 38.Moses A. Exposure to violence, depression, and hostility in a sample of inner city high school youth. J Adolesc. 1999;22(1):21–32. doi: 10.1006/jado.1998.0198. [DOI] [PubMed] [Google Scholar]
- 39.Rivara FP, Shepherd JP, Farrington DP, Richmond P, Cannon P. Victim as offender in youth violence. Ann Emerg Med. 1995;26(5):609–614. doi: 10.1016/S0196-0644(95)70013-7. [DOI] [PubMed] [Google Scholar]
- 40.Widom CS. Child abuse, neglect, and violent criminal behavior. Criminology. 1989;27(2):251–271. doi: 10.1111/j.1745-9125.1989.tb01032.x. [DOI] [Google Scholar]
- 41.DuRant RH, Getts A, Cadenhead C, Emans SJ, Woods ER. Exposure to violence and victimization and depression, hopelessness, and purpose in life among adolescents living in and around public housing. J Dev Behav Pediatr. 1995;16(4):233-237. doi: 10.1097/00004703-199508000-00004. [DOI] [PubMed] [Google Scholar]
- 42.Cauffman E, Feldman S, Watherman J, Steiner H. Posttraumatic stress disorder among female juvenile offenders. J Am Acad Child Adolesc Psychiatry. 1998;37(11):1209–1216. doi: 10.1097/00004583-199811000-00022. [DOI] [PubMed] [Google Scholar]
- 43.Singer MI, Anglin TM, yu Song L, Lunghofer L. Adolescents’ exposure to violence and associated symptoms of psychological trauma. JAMA. 1995;273(6):477–482. doi: 10.1001/jama.1995.03520300051036. [DOI] [PubMed] [Google Scholar]
- 44.Slovak K, Singer M. Gun violence exposure and trauma among rural youth. Violence Vict. 2001;16(4):389–400. [PubMed] [Google Scholar]
- 45.Bowen NK, Bowen GL. Effects of crime and violence in neighborhoods and schools on the school behavior and performance of adolescents. J Adolesc Res. 1999;14(3):319–342. doi: 10.1177/0743558499143003. [DOI] [Google Scholar]
- 46.Burrow JD, Apel R. Youth behavior, school structure, and student risk of victimization. Justice Q. 2008;25(2):349–380. doi: 10.1080/07418820802025181. [DOI] [Google Scholar]
- 47.Fowler Jr WJ, Walberg HJ. School size, characteristics, and outcomes. Educ Eval Policy Anal. 1991;13(2):189–202. doi: 10.3102/01623737013002189. [DOI] [Google Scholar]
- 48.Haller EJ. High school size and student indiscipline: another aspect of the school consolidation issue? Educ Eval Policy Anal. 1992;14(2):145–156. doi: 10.3102/01623737014002145. [DOI] [Google Scholar]
- 49.Lee VE, Bryk AS. A multilevel model of the social distribution of high school achievement. Sociol Educ. 1989;62:172–192. doi: 10.2307/2112866. [DOI] [Google Scholar]
- 50.Pittman RB, Haughwout P. Influence of high school size on dropout rate. Educ Eval Policy Anal. 1987;9(4):337–343. doi: 10.3102/01623737009004337. [DOI] [Google Scholar]
- 51.Ratner HH, Chiodo L, Covington C, Sokol RJ, Ager J, Delaney-Black V. Violence exposure, IQ, academic performance, and children’s perception of safety: evidence of protective effects. Merrill-Palmer Q. 2006;52(2):264–287. doi: 10.1353/mpq.2006.0017. [DOI] [Google Scholar]
- 52.Ventura C. School violence to school safety: reframing the issue for school psychologists. Sch Psychol Rev. 1994;23(2):236–256. [Google Scholar]
- 53.Berman SL, Silverman WK, Kurtines WM. Youth exposure to crime and violence: its effects and implications for intervention. J Cogn Psychother. 2000;14(1):37–50. [Google Scholar]
- 54.Cooley-Quille MR, Turner SM, Beidel DC. Emotional impact of children’s exposure to community violence: a preliminary study. J Am Acad Child Adolesc Psychiatry. 1995;34(10):1362–1368. doi: 10.1097/00004583-199510000-00022. [DOI] [PubMed] [Google Scholar]
- 55.Hill HM, Levermore M, Twaite J, Jones LP. Exposure to community violence and social support as predictors of anxiety and social and emotional behavior among African American children. J Child Fam Stud. 1996;5(4):399–414. doi: 10.1007/BF02233862. [DOI] [Google Scholar]
- 56.Powell EC, Sheehan KM, Christoffel KK. Firearm violence among youth: public health strategies for prevention. Ann Emerg Med. 1996;28(2):204–212. doi: 10.1016/S0196-0644(96)70063-X. [DOI] [PubMed] [Google Scholar]
- 57.Buka SL, Stichick TL, Birdthistle I, Earls FJ. Youth exposure to violence: prevalence, risks, and consequences. Am J Orthopsychiatry. 2001;71(3):298–310. doi: 10.1037/0002-9432.71.3.298. [DOI] [PubMed] [Google Scholar]
- 58.Begic D, Jokic-Begic N. Violent behaviour and post-traumatic stress disorder. Curr Opin Psychiatry. 2002;15(6):623–626. doi: 10.1097/00001504-200211000-00011. [DOI] [Google Scholar]
- 59.Fagan J, Wilkinson DL. Guns, youth violence, and social identity in inner cities. Crime Justice. 1998;24:105–188. doi: 10.1086/449279. [DOI] [Google Scholar]
- 60.Garbarino J, Bradshaw CP, Vorrasi JA. Mitigating the effects of gun violence on children and youth. Futur Child. 2002:73–85. [PubMed]
- 61.Bingenheimer JB, Brennan RT, Earls FJ. Firearm violence exposure and serious violent behavior. Science. 2005;308(5726):1323–1326. doi: 10.1126/science.1110096. [DOI] [PubMed] [Google Scholar]
- 62.Barboza GE, Dominguez S. Longitudinal growth of post-traumatic stress and depressive symptoms following a child maltreatment allegation: an examination of violence exposure, family risk and placement type. Child Youth Serv Rev. 2017;81:368–378. doi: 10.1016/j.childyouth.2017.08.029. [DOI] [Google Scholar]
- 63.Barboza GE, Dominguez S, Pinder J. Trajectories of post-traumatic stress and externalizing psychopathology among maltreated foster care youth: a parallel process latent growth curve model. Child Abuse Negl. 2017;72:370–382. doi: 10.1016/j.chiabu.2017.09.007. [DOI] [PubMed] [Google Scholar]
- 64.Bath H. The three pillars of trauma-informed care. Reclaiming Children Youth. 2008;17(3):17. [Google Scholar]
- 65.Van der Kolk BA. Developmental trauma disorder: towards a rational diagnosis for chronically traumatized children. Prax Kinderpsychol Kinderpsychiatr. 2008;58(8):572–586. doi: 10.13109/prkk.2009.58.8.572. [DOI] [PubMed] [Google Scholar]
- 66.Sharkey PT, Tirado-Strayer N, Papachristos AV, Raver CC. The effect of local violence on children’s attention and impulse control. Am J Public Health. 2012;102(12):2287–2293. doi: 10.2105/AJPH.2012.300789. [DOI] [PMC free article] [PubMed] [Google Scholar]
- 67.Sharkey P, Schwartz AE, Ellen IG, Lacoe J. High stakes in the classroom, high stakes on the street: the effects of community violence on student’s standardized test performance. Sociol Sci. 2014;1:199–220. doi: 10.15195/v1.a14. [DOI] [Google Scholar]
- 68.Adams EJ. Healing Invisible Wounds: Why Investing in Trauma-Informed Care for Children Makes Sense. Washington, DC: Justice Policy Institute; 2010. [Google Scholar]
- 69.Layne CM, Pynoos RS, and Cardenas J. Wounded adolescence: School-based group psychotherapy for adolescents who sustained or witnessed violent injury. In School violence: Contributing factors, management, and prevention. M. Shafii and S. Shafii, eds. Washington, DC: American Psychiatric Press, 2001, pp. 163–86.
- 70.Pynoos RS, Nader K. Children’s exposure to violence and traumatic death. Psychiatr Ann. 1990;20(6):334–344. doi: 10.3928/0048-5713-19900601-11. [DOI] [Google Scholar]
- 71.Saltzman WR, Pynoos RS, Layne CM, Steinberg AM, Aisenberg E. Trauma-and grief-focused intervention for adolescents exposed to community violence: results of a school-based screening and group treatment protocol. Group Dyn: Theory Res Pract. 2001;5(4):291–303. doi: 10.1037/1089-2699.5.4.291. [DOI] [Google Scholar]
- 72.Bowen GL, Richman JM, Brewster A, Bowen N. Sense of school coherence, perceptions of danger at school, and teacher support among youth at risk of school failure. Child Adolesc Soc Work J. 1998;15(4):273–286. doi: 10.1023/A:1025159811181. [DOI] [Google Scholar]
- 73.Kwate NOA, Loh JM. Separate and unequal: the influence of neighborhood and school characteristics on spatial proximity between fast food and schools. Prev Med. 2010;51(2):153–156. doi: 10.1016/j.ypmed.2010.04.020. [DOI] [PubMed] [Google Scholar]
- 74.Austin SB, Melly SJ, Sanchez BN, Patel A, Buka S, Gortmaker SL. Clustering of fast-food restaurants around schools: a novel application of spatial statistics to the study of food environments. Am J Public Health. 2005;95(9):1575–1581. doi: 10.2105/AJPH.2004.056341. [DOI] [PMC free article] [PubMed] [Google Scholar]
- 75.Ellaway A, Macdonald L, Lamb K, Thornton L, Day P, Pearce J. Do obesity-promoting food environments cluster around socially disadvantaged schools in Glasgow, Scotland? Health Place. 2012;18(6):1335–1340. doi: 10.1016/j.healthplace.2012.06.001. [DOI] [PMC free article] [PubMed] [Google Scholar]
- 76.Berman M, Diggle P. Estimating weighted integrals of the second-order intensity of a spatial point process. J R Stat Soc Ser B Methodol. 1989:81–92.
- 77.Kwate NOA, Yau C-Y, Loh J-M, Williams D. Inequality in obesigenic environments: fast food density in New York City. Health Place. 2009;15(1):364–373. doi: 10.1016/j.healthplace.2008.07.003. [DOI] [PubMed] [Google Scholar]
- 78.Schools BP. Boston public schools at a glance 2015–2016. BPS Facts; 2016.
- 79.Macridis S, García Bengoechea E. Adoption of safe routes to school in Canadian and the United States contexts: best practices and recommendations. J Sch Health. 2015;85(8):558–566. doi: 10.1111/josh.12283. [DOI] [PubMed] [Google Scholar]
- 80.Fast JD. After columbine: how people mourn sudden death. Soc Work. 2003;48(4):484–491. doi: 10.1093/sw/48.4.484. [DOI] [PubMed] [Google Scholar]
- 81.Fein AH. There and back again: school shootings as experienced by school leaders. Lanham: Scarecrow Education; 2003.
- 82.Windham RC, Hooper LM, Hudson PE. Selected spiritual religious, and family factors in the prevention of school violence. Couns Values. 2005;49(3):208–216. doi: 10.1002/j.2161-007X.2005.tb01023.x. [DOI] [Google Scholar]