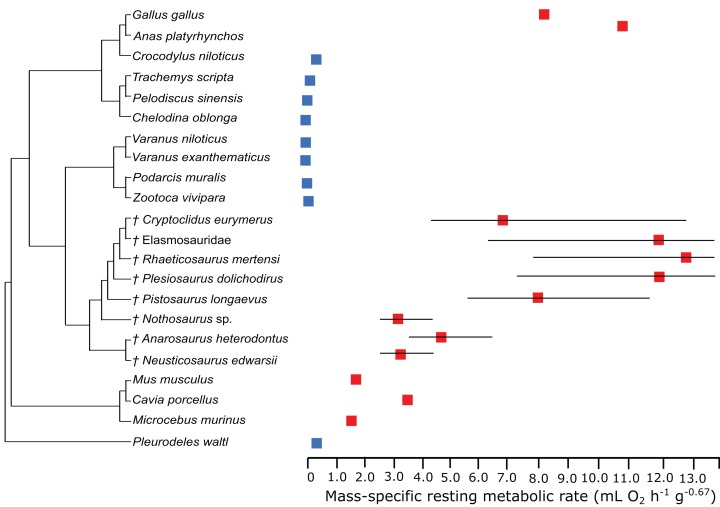
Figure 3. Measured and estimated mass-specific resting metabolic rate (RMR) with 95% confidence intervals.
Blue boxes indicate ectothermic species, red boxes indicate (possibly) endothermic species. All sauropterygians in the model have a RMR higher than the analyzed ectothermic species. For plesiosaurs, a RMR in the range of birds was even estimated.

