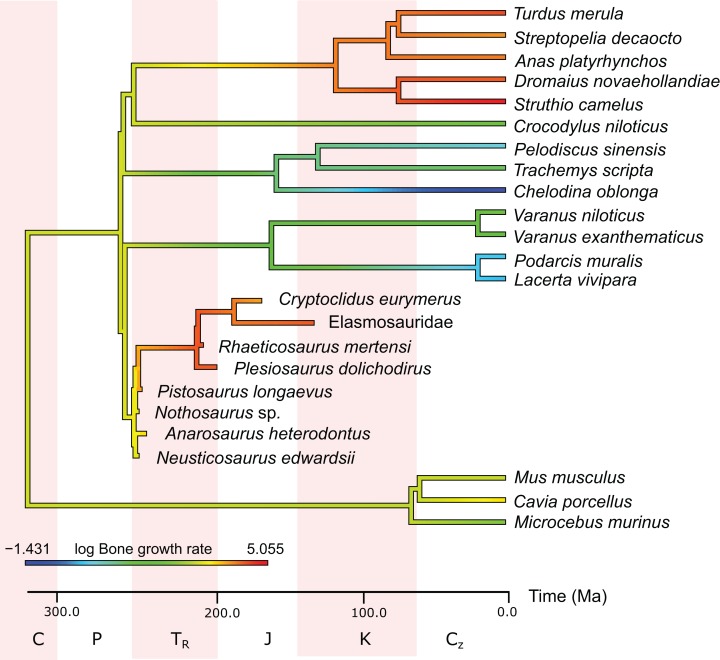
Figure 6. Measured and estimated bone apposition rate in log μm/day mapped color-coded on a phylogenetic tree.
In this comparison, blue represents low values, green and yellow intermediate values and red high values. Plesiosaurs have a growth rate in the range of birds. Within sauropterygians, growth rate increases, but even basal forms show values in the range of mammals or higher and far above the ectothermic species included in the model.

