Abstract
Our goal was to systematically quantify the collagen crimp morphology around the corneoscleral shell, and test the hypothesis that collagen crimp is not uniform over the globe. Axial longitudinal cryosections (30 μm) of three sheep eyes, fixed at 0 mmHg IOP, were imaged using polarized light microscopy to quantify the local collagen in 8 regions: two corneal (central and peripheral) and six scleral (limbus, anterior-equatorial, equatorial, posterior-equatorial, posterior and peripapillary). Collagen crimp period (length of one wave), tortuosity (path length divided by end-to-end length), waviness (SD of orientation), amplitude (half the peak to trough distance), and conformity (width of contiguous similarly oriented bundles) were measured in each region. Measurements were obtained on 8,216 collagen fiber bundles. When pooling measurements across the whole eye globe, the median crimp values were: 23.9 μm period, 13.2 μm conformity, 0.63 μm amplitude, 1.006 tortuosity, and 12.7° waviness. However, all parameters varied significantly across the globe. Median bundle periods in the central cornea, limbus, and peripapillary sclera (PPS) were 14.1 μm, 29.5 μm, and 22.9 μm, respectively. Median conformities were 20.8 μm, 14.5 μm, and 15.1 μm, respectively. Median tortuosities were 1.005, 1.007, and 1.007, respectively. Median waviness’ were 11.4°, 13.2°, and 13.2°, respectively. Median amplitudes were 0.35 μm, 0.87 μm, and 0.65 μm, respectively. All parameters varied significantly across the globe. All regions differed significantly from one another on at least one parameter. Regions with small periods had large conformities, and bundles with high tortuosity had high waviness and amplitude. Waviness, tortuosity, and amplitude, associated with nonlinear biomechanical behavior, exhibited “double hump” distributions, whereas period and conformity, representing tissue organization, were substantially different between sclera and cornea. Though the biomechanical implications and origin of the patterns observed remain unclear, our findings of well-defined patterns of collagen crimp across the corneoscleral shell, consistent between eyes, support the existence of mechanisms that regulate collagen characteristics at the regional or smaller levels. These results are experimental data necessary for more realistic models of ocular biomechanics and remodeling.
Keywords: Collagen, crimp, globe, biomechanics, cornea, sclera, microstructure
1. Introduction
The basic function of the eye as well as many diseases of the eye, including glaucoma and keratoconus, are intimately tied to the biomechanics of the corneoscleral shell.(Ethier et al., 2004) Corneoscleral biomechanics are, in turn, determined by the architecture of the underlying collagen. The collagen fibers of the eye, like those of other tissues, have a natural waviness known as crimp.(Andreo and Farrell, 1982; Gallagher and Maurice, 1977; Jan et al., 2017a; Jan and Sigal, 2018) Crimp has been noted in anatomy textbooks such as “Gray’s Anatomy”, which describes crimp as an innate property of Type I collagen fibers.(Standring, 2016) This crimp is central to eye biomechanics, as it largely determines the nonlinear (strain-dependent) biomechanical behavior of the tissues.(Fratzl, 2008; Holzapfel, 2001) Because of this importance, collagen crimp has been the focus of several studies. For example, the crimp in the cornea has been described by Andreo and Farrell,(Andreo and Farrell, 1982) and more recently by Newton and colleagues(Newton et al., 1996) and Liu and colleagues.(Liu et al., 2014) Crimp in the sclera was visualized by Ho and colleagues(Ho et al., 2014) using magnetic resonance imaging (MRI) and by Zyablitskaya and colleagues(Zyablitskaya et al., 2017) using second harmonic imaging. We have described collagen crimp patterns in the lamina cribrosa and adjacent sclera obtained using polarized light microscopy (PLM).(Jan et al., 2017a; Jan and Sigal, 2018) The studies above, while useful, only describe isolated relatively small regions. Grytz and colleagues(Grytz and Meschke, 2009, 2010) used inverse modeling to estimate crimp properties in the cornea and limbus, or the optic nerve head and posterior sclera. Their models, while elegant, were still limited to regions of the corneoscleral shell. Furthermore, the models involved strong assumptions on collagen properties and globe shape, and their predictions have not been validated experimentally.
The various regions of the eye have diverse biomechanical and structural roles, and therefore the demands on the architecture and microarchitecture of the underlying connective tissues also vary. In addition, the corneoscleral shell is a continuous, cohesive envelope, in which the biomechanical behavior of one region is dependent on its own properties, and on those of other regions. The lack of experimental measures of collagen fiber properties across the globe, and specifically of collagen crimp, is a significant barrier to understanding eye biomechanics. Experimental measures of crimp are necessary to understand how the microarchitecture determines the behavior of the eye, including mechanisms related to development, aging, and pathology.
Our goals in this study were to measure the collagen fiber crimp around the entire corneoscleral shell, and to test the hypothesis that collagen crimp properties are not uniform around the globe. Specifically, we quantified the collagen crimp period, conformity, tortuosity, waviness, and amplitude across two corneal and six scleral regions.
2. Methods
On the terminology
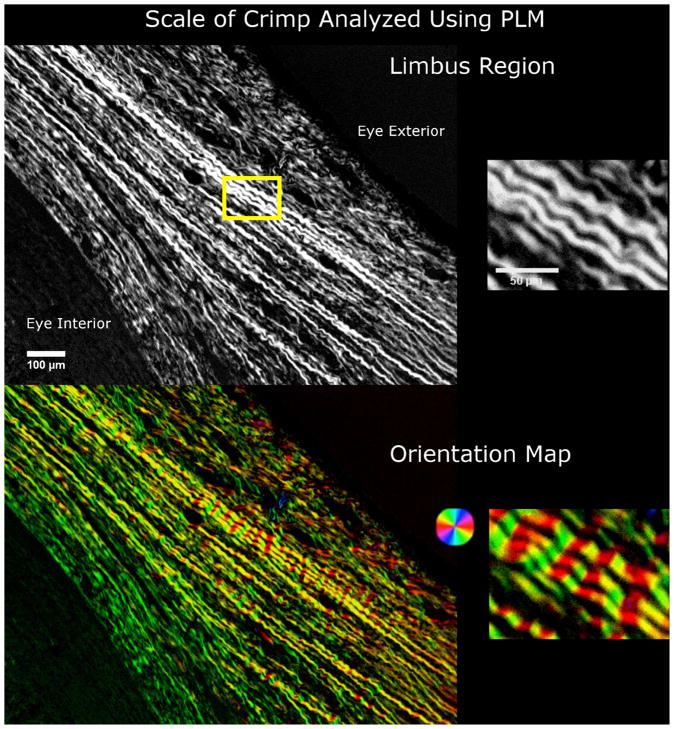
It is imperative to recall that collagen architecture and hierarchical organization are complex and vary throughout the eye.(Fratzl, 2008) In some regions this organization has been well-characterized, such as in the cornea, which is a lamellar structure containing evenly-spaced fibrils approximately 35 nm in diameter, which are highly parallel to one-another within each lamella.(Andreo and Farrell, 1982; Gallagher and Maurice, 1977; Quantock et al., 2015) Collagen in the sclera forms what are often referred to as “bundles”. Our goal in this manuscript was not to do a detailed characterization of the collagen hierarchies over the globe. Thus, for clarity, throughout the manuscript we have used the terms “fiber bundles” or “group of collagen fibers”. With respect to our use of the term “crimp”, please see Figure 1 for an illustration of the scale of the fiber undulations studied.
Figure 1.
The scale of collagen crimp analyzed using PLM. On the left hand side are wide-field views of the limbus region. The wavy patterns in the collagen fibers are clearly discernible and emphasized using a color map of orientation. The close up images on the right hand side show the periodic waviness analyzed in this work.
Sample preparation
Three eyes of 2-year old sheep were obtained from a local abattoir. The eyes were processed within 8 hours of death following previously described methods, (Jan et al., 2017a; Jan et al., 2015; Jan et al., 2017b; Jan and Sigal, 2018) with slight modifications for the longitudinal sectioning of whole globes instead of transverse sections of optic nerve heads. Briefly, the muscles, fat, and episcleral tissues were carefully removed from each eye. The eyes were cannulated through the anterior chamber to a set pressure of 0 mmHg IOP using a saline reservoir. The pressure was set by first increasing the IOP slightly to 3–5 mmHg, by raising the reservoir, to restore normal globe shape, and then lowered to 0 mmHg IOP by lowering the reservoir. The pressure was held at 0 mmHg for 15 min to allow normalization from viscoelastic effects before fixation. After the pressure had been set, the eyes were fixed by immersing them in a 10% formalin solution overnight. We have previously shown that, using formalin fixation causes only minimal changes in shape or size of ocular tissues at the macro,(Tran et al., 2017) and microscales,(Jan et al., 2015) including negligible effects on crimp. Intact whole globe eyes were embedded in such a way that all eyes lined up in the nasal-temporal and superior-inferior anatomical directions for cryosectioning. The eyes were cryosectioned into axial slices, with a thickness of 30 μm. For all eyes, the sections were obtained consecutively without loss. Sections were held flat using a standard anti-roll plate and a cold fine-tip brush before adhering the section to the histological slide. A total of 28 sections passing through both the PPS and the central cornea and free of artifacts, such as folds, were selected for imaging and analysis.
Imaging
The selected sections were imaged with PLM using previously reported methods (Jan et al., 2017a; Jan et al., 2015; Jan et al., 2017b; Jan and Sigal, 2018) to visualize the collagen crimp and quantify the collagen fiber orientations (Figure 1, 2). Briefly, two filters (Hoya, Tokyo, Japan) were used; the polarizer filter was placed before the sample and the analyzer filter placed after the sample. Four images at filter orientations 45° apart were acquired. The relative changes in intensities at each pixel were used to determine the local collagen fiber orientation.(Shribak and Oldenbourg, 2003)
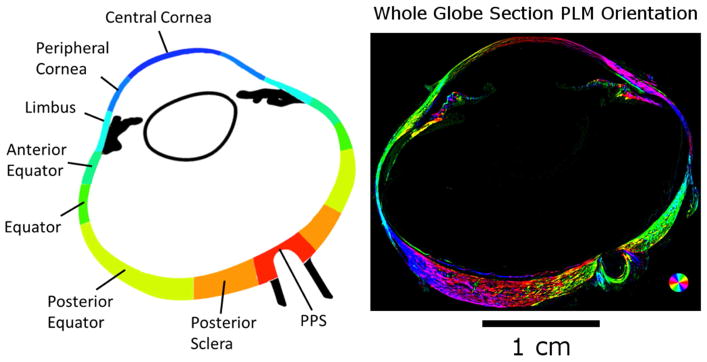
Figure 2.
A map of the eye globe. (Left) The 8 bilateral regions were analyzed for collagen crimp across the eye globe. PLM images of each region were analyzed for collagen fiber orientation. (Right) PLM image of the whole globe. Colors indicate local fiber collagen fiber orientation, whereas intensity was scaled according to an “energy” measure, as explained in the main text.
The images were acquired with an Olympus SZX16 microscope (11.5X magnification setting) with an Olympus DP80 camera (36-bit, RGB, pixel-shift setting), a 0.6X reducer, and a 0.8X objective (numerical aperture [NA], 0.12) for a pixel size of 0.37 μm/pixel (Olympus, Tokyo, Japan). For analysis, the globe was divided into eight regions (Figure 2): PPS, posterior sclera, posterior equator, equator, anterior equator, limbus, peripheral cornea, and central cornea. Nasal and temporal regions were combined to focus on the anterior-posterior patterns. Each region was imaged independently. For large or thick regions, multiple images were captured to cover the entire region in a mosaic. The mosaics were obtained with 20% overlap and stitched using Fiji is Just Image J (FIJI).(Preibisch et al., 2009; Schindelin et al., 2012) We have previously shown that our collagen fiber measurements using PLM are not affected by the microscope-camera pairing, mosaics, stitching, or section orientation.(Jan et al., 2017a; Jan et al., 2015; Jan et al., 2017b) For presentation only, orientation images are presented with the pixel intensities scaled by an “energy” parameter. (Jan et al., 2017a; Jan and Sigal, 2018)
PLM has a high angular resolution. We have shown that PLM derived orientation measurements of ocular tissue have repeatability, reproducibility, robustness to translations, rotations, and magnification settings on the order of one or two degrees.(Jan et al., 2015) PLM, x-ray, and light scattering methods all determine orientation without detection of fiber edges.(Girard et al., 2011; Pijanka et al., 2013) Each pixel analyzed depicts the orientation of the fibers represented within that pixel, without the need for context from neighboring pixels.
Quantifying collagen crimp
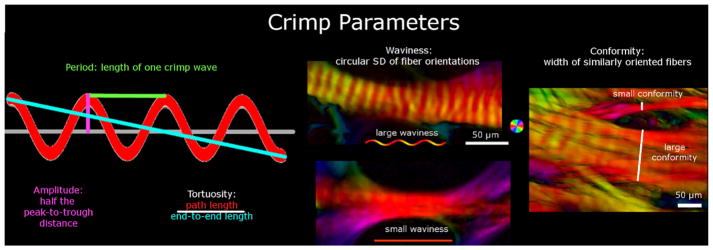
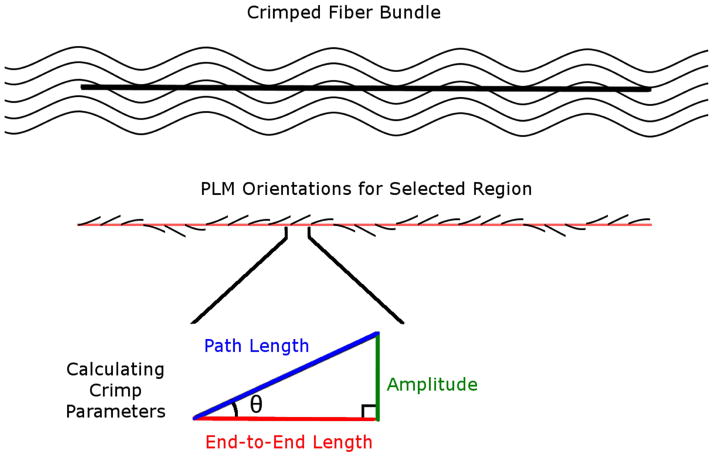
For clarity, we start with a general description of the methods before describing in detail how each crimp characteristic was defined and quantified. We studied five crimp characteristics: period, conformity, tortuosity, waviness, and amplitude. (Figure 3) Period and conformity were measured manually from “raw” PLM images, whereas tortuosity, waviness, and amplitude were measured semi-automatically using the orientation maps derived from PLM at manually-defined places of measurement. To calculate tortuosity, waviness, and amplitude, a straight line was placed along a collagen bundle to sample the orientations obtained with PLM. (Figure 4) Using custom Fiji code, we computed the tortuosity, waviness, and amplitude from this information using Riemann sums. In a preliminary study, we verified this method by using it first to measure the parameters of simulated bundles with known crimp. Next, we used the technique on images of longitudinal sections of tendon samples fixed without load so that they exhibit large crimp, similar to those used in Jan et al 2015. (Jan et al., 2015) Tendon has large, highly regular crimp, which can be easily resolved and is therefore suitable for manual crimp tracings to compare with our algorithm measurements. Finally, we analyzed ocular crimp in regions of large and highly visible crimp near the limbus. In all of these tests the crimp parameters calculated with this technique were within 2% of the known parameters or reference measurements obtained by fiber tracing. Because we sample the orientations across a manually placed pixel line from each group of collagen fibers, we tested to see if different samplings within the same group of collagen fibers would change crimp parameters. We found that lines within 15° of the main collagen fiber group direction and spanning at least one crimp cycle produced parameters within 3% of the reference ones. Because this PLM-based technique does not require resolving fiber edges, it is not affected by image resolution in the same way as gradient-based or edge-detection techniques such as the algorithms used in the Fiji plugin, OrientationJ.(Püspöki et al., 2016)When put together with the high angular resolution, the technique can provide more accurate quantifications of fiber crimp than trace-based techniques for images of the same resolution and pixel size. In practice, it means that it allows accurate measurement of crimp amplitudes of fractions of a micron and of fibers with small tortuosity.
Figure 3.
Crimp Parameters definitions. The crimp parameters that were quantified in this study were period, tortuosity, amplitude, waviness, and conformity. The period and conformity were measured manually, while the other parameters were measured semi-automatically using custom-scripts. The leftmost panel shows an idealized collagen fiber crimp to illustrate the measurement of period, amplitude and tortuosity. The middle and right-most panel shows example PLM images presented as in Figure 1. The middle panel shows two collagen bundles, one with large waviness (top) and another with small waviness (bottom). The right-most panel is of a region with multiple bundles to illustrate small and large conformities. Note that this middle panel exemplifies the importance of the high angular resolution of PLM. Individual fibers and their crimp may not be directly discerned, but the orientations derived from PLM show clear evidence of undulations. Recall that the orientation analysis is done pixel by pixel and any organization and structure arise naturally. From these angles it is possible to deduce the crimp characteristics with high detail.
Figure 4.
Calculating crimp parameters. A straight line was marked manually along a bundle. Trigonometric identities were then used pixel by pixel along this path to calculate the local amplitude and lengths based on the orientation information derived from PLM. Local amplitude and lengths were then integrated to compute bundle crimp amplitude, path and end-to-end lengths.
All parameters were measured from lines drawn manually. However, the parameters were obtained in two different ways. For period and conformity, we directly used the length of the lines drawn to determine the parameter (divided by three for the period). For tortuosity, waviness and amplitude, the line was used to select the pixels to sample. The orientation information in the sampled pixels was then analyzed to calculate the parameters. Below we describe the measurement of each parameter. Because the lines were drawn manually, we did additional tests to quantify the repeatability and reproducibility of the parameters obtained from them. In addition, because of the large number of lines that had to be drawn manually, the work was split into three people. To ensure consistency, an additional person with several years of experience in imaging and PLM measurement of crimp properties verified the crimp measurements (NJJ).
1) Period
The period was defined as the length of the collagen crimp through one wave, and measured manually using a previously described method.(Jan et al., 2017a) Briefly, because of the direct relationship between intensity and orientation, the period could be visually identified using the inflection points between bright and dark bands, where each band corresponds to half of a crimp period. A straight line was used to measure the length of three sequential crimp periods by identifying three bright and dark bands. The period was then calculated by dividing the length of the line by 3 to get the average crimp period. We have shown that our method for manually measuring crimp period from PLM images of coronal sections of the PPS has excellent repeatability and reproducibility.(Jan et al., 2017a)
2) Tortuosity
Tortuosity was defined as the ratio of the path length of a fiber trace to its end-to-end length. A perfectly straight fiber would therefore have a tortuosity of 1, and a wavy fiber would have a tortuosity greater than 1. Tortuosity is sometimes also referred to as slack, as it relates to how much a fiber can be straightened before it becomes fully straight or taut. The path length of the fiber was calculated using a Riemann sum method based on the fiber orientation in each pixel of a line segment along a collagen bundle. The end-to-end length was computed from the number of pixels in the line.
3) Waviness
Waviness was defined as the circular standard deviation of the fiber orientations along a collagen bundle. A perfectly straight fiber, or set of fibers, would have a constant angle value along the bundle, and therefore would have a waviness of 0, whereas a wavy fiber would have waviness greater than 0.
4) Amplitude
Amplitude was defined as half of the peak-to-trough distance in a wave. A straight fiber would therefore have an amplitude of 0, whereas a wavy fiber would have an amplitude greater than 0. Similar to tortuosity, the amplitude was calculated using a Riemann sum method based on the fiber orientation in each pixel of a line segment across a collagen bundle. The amplitude for each fiber bundle was averaged across two periods.
5) Conformity
The conformity was defined as the width of a group of contiguous similarly oriented fibers and recognizable as a group or bundle in the images. Whereas the other parameters are intuitive or have already been used elsewhere to describe wavy collagen, conformity requires further explanation: Collagen fibers aggregate into larger structures, such as bundles and lamellae. Initially, we considered measuring fiber bundle or lamellae width. In small regions this works well, but over the globe things are more complex. Bundles and lamellae are interwoven, splitting and/or merging. We reasoned that measuring the width of a group of fibers of similar orientation would be a more useful representation of the collagen organization than artificially defining boundaries. Our use of conformity, thus, has the advantage of not requiring the fibers to belong to a single bundle or lamellae, and instead assumes only that they all appear together. (Figure 5) For example, in regions with wide lamellae, like the cornea, multiple collagen bundles were oriented similarily, resulting in high conformity. Other regions, like the sclera, could have interweaving collagen bundles at large angles to each other, resulting in low conformity. Thus, conformity was measured by the length of a straight line manually placed perpendicular to the main direction of the bundles.
Figure 5.
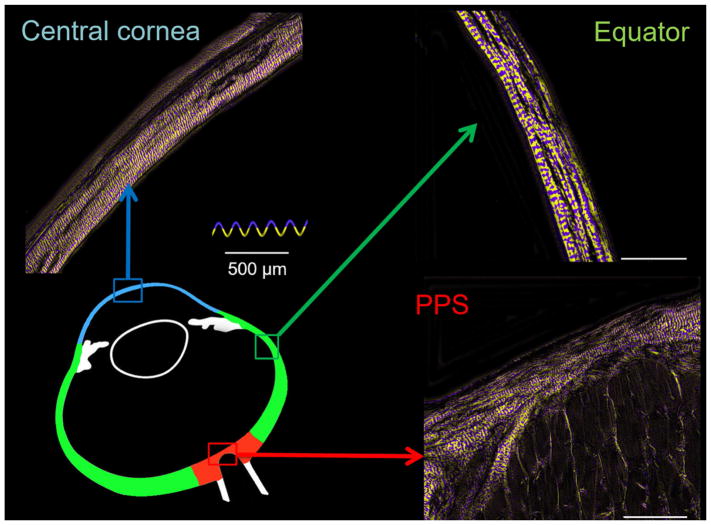
Crimp in different areas of the eye. Using a yellow and purple color-scheme to highlight the collagen crimp period, we can see the collagen fibers in the cornea, sclera, and PPS had very different collagen structure. In the cornea, the majority of the collagen bundles run in the same orientation and therefore have large conformity. In the equator and PPS, the collagen bundles have more heterogeneity in their orientation, resulting in small conformity.
When marking the images, care was taken to distribute the marks evenly over a region. We were also careful to place them only on well-defined collagen bundles and lamellae that were long and bright. This limits the analysis to fibers in the section plane. Elsewhere it has been shown that the signal intensity in PLM encodes information on the relative orientation of the collagen fibers and the section, and imaging, plane. (Yang et al., 2017) As such, in our PLM implementation, in-plane fibers appear brighter than fibers perpendicular to this plane. Thus, dark regions may be collagen oriented orthogonal to this plane, or other tissue components (e.g. keratocytes).(Yang et al., 2017)
Statistical Analyses
1) Repeatability and reproducibility of manual-only collagen crimp measurements, period and conformity
To determine the repeatability and reproducibility of measuring the collagen crimp period and conformity in axial whole-globe sections of the eye, each person made manual period and conformity measurements in the same locations across the 8 regions three times. For each location, the standard deviation of each person’s three crimp period and conformity measurements was calculated as well as the standard deviation of the pooled measurements. We report the largest standard deviations across all locations within each person as a worst-case measure of repeatability, and across all people as a worst-case measure of reproducibility.
2) Crimp distributions in each region
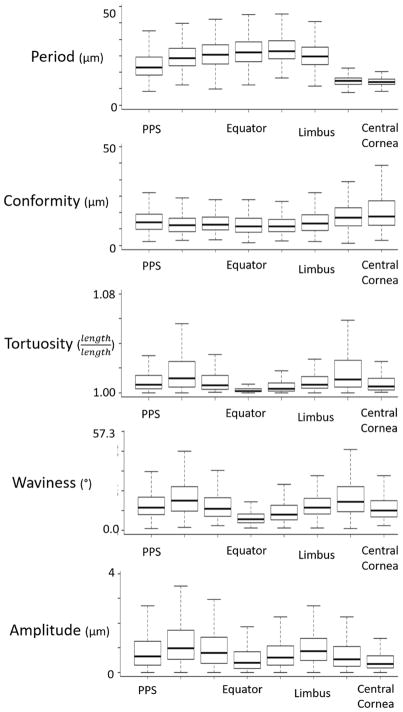
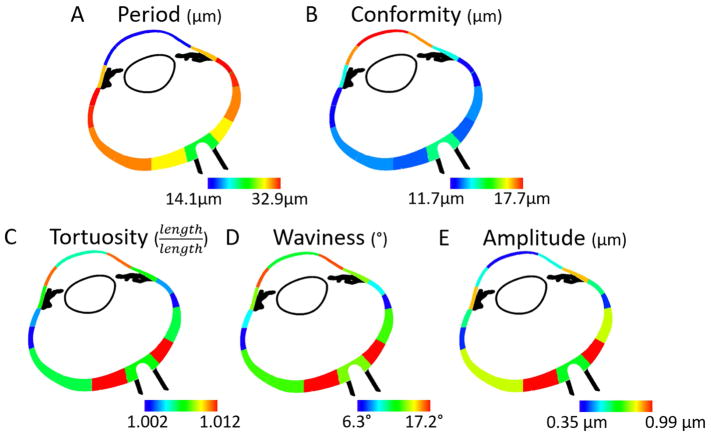
The medians, averages, and standard deviations for each crimp parameter and each region were calculated. In addition, the distributions are presented in a series of box plots in Figure 6 and heat maps in Figure 7.
Figure 6.
Boxplots of the distribution of each crimp parameter in each region. The regions are ordered from posterior (PPS) to anterior (central cornea). Period and conformity had generally opposite trends while tortuosity, waviness, and amplitude had similar trends. Note that each box in the plots above represents between 100 and 1200 measurements.
Figure 7.
Heat maps of the mean of each collagen crimp parameter in each region. Blue was used to designate the smallest value within each heat map, and red to represent the highest value.
3) Regional differences in crimp distributions
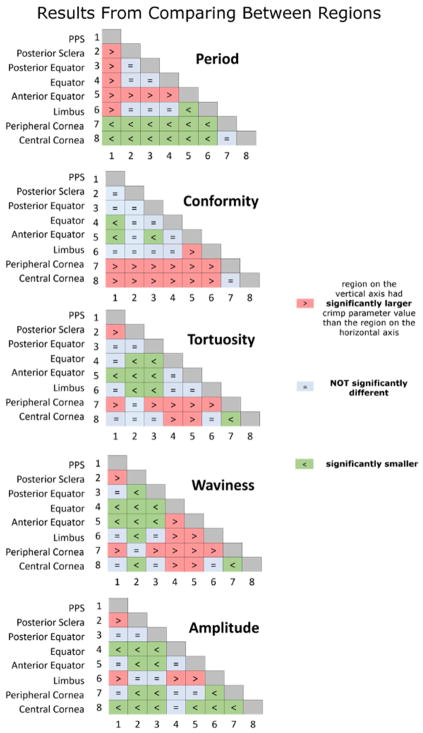
Linear mixed effect (LME) models accounting for autocorrelation of measurements from the same section, eye, and animal were used to determine if the period, conformity, tortuosity, waviness, or amplitude were significantly different between any two regions. Linear mixed effect models are linear models that incorporate fixed and random variables.(Gałecki and Burzykowski, 2013) Fixed variables are our variables of interest, such as period and random variables are factors that may affect the sampling population, such as whether there are different number of measurements in different regions or in different sections. We used a significance level of alpha = 0.05. Using a Bonferroni correction to account for the same test being done 28 times for each region pairing, we divided alpha by 28 for a significance level of alpha = 0.0018. The results of these tests are shown in Figure 8, with a table for each crimp parameter.
Figure 8.
Matrices of LME tests comparing crimp between regions. The distributions for each crimp parameter were compared between the 8 regions. Each matrix entry depicts a comparison between two regions. The colors and symbols indicate whether the region in the vertical axis was larger (red), smaller (green) or not significantly different (light blue) than the one on the horizontal axis.
4) Bundle by bundle crimp associations in each region and across the globe
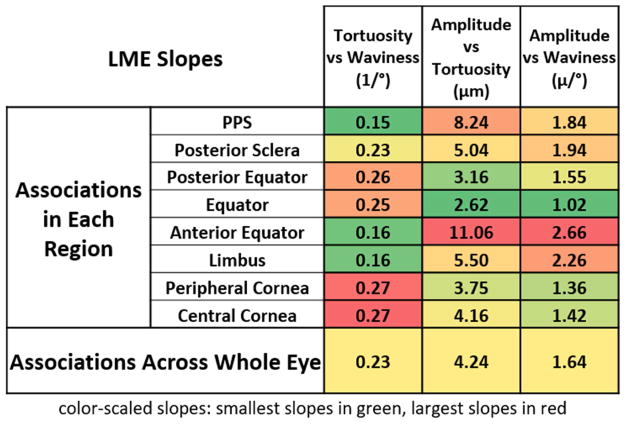
LMEs accounting for autocorrelation of measurements from the same section, eye, and animal were used to determine if there were significant associations between the crimp parameters, both pooled across all regions and within each of the 8 regions. A significance level of alpha = 0.05 was used. Applying a Bonferroni correction for the test being done 8 times for each region, we divided 0.05 by 8 to obtain a significance level of alpha = 0.00625, for the tests done within each region. In addition, the correlation coefficients, or LME slopes, were also calculated to compare the strengths of the associations. The results of the associations between tortuosity, waviness, and amplitude are shown in Figure 9.
Figure 9.
The LME slopes of bundle-by-bundle crimp associations in each region. Tortuosity, waviness, and amplitude were all significantly associated with one another for each region and across all eyes. The numbers shown on the table are the slopes of the associations obtained from the linear mixed effect models. To simplify distinguishing trends, the cells are colored according to the magnitude of the slope. Largest in red, lowest in green. For tortuosity vs waviness, the largest slopes occurred in the cornea, whereas for amplitude vs tortuosity and amplitude vs waviness, the largest slopes occurred in the anterior equator.
3. Results
Crimp Distributions in Each Region
A total of 8,216 collagen fiber bundles were measured, with at least 1,500 fiber bundles per eye. The manual-only crimp parameters had small standard deviations between and across the three markers. The period measurements had a repeatability of 1.9 μm and reproducibility of 3.1 μm, whereas the conformity measurements had a repeatability of 1.8 μm and a reproducibility of 3.3 μm.
Tortuosity, waviness and amplitude exhibited similar “double hump” or “M-shaped” distributions over the globe (Figure 6 and 7). All three parameters had lower values, or “troughs” at the PPS, equator and central cornea (left, middle and right in the plots), and higher, or “peak” values in-between. However, both tortuosity and waviness had its second peak in the peripheral cornea, whereas amplitude had its second peak in the limbus. The posterior sclera region had the largest median tortuosity (1.012), waviness (17.2°), and amplitude (1.0 μm). The average±SD tortuosity was 1.028±0.060, the waviness was 20.3±13.2°, and the amplitude was 1.2±0.9 μm, respectively for this region. The equator had the smallest median (average±SD) tortuosity of 1.002 (1.008±0.045) and waviness with a median of 6.2° (8.3±8.4°) whereas the central cornea had the smallest amplitude with a median of 0.35 μm (0.59±0.69 μm).
Period and conformity did not exhibit a double hump pattern. Instead, period in the sclera increased progressively from PPS to anterior equatorial sclera, decreasing slightly to the limbus and then dropping substantially in the cornea. The anterior equator had the largest median period of 32.9 μm (31.1±9.7 μm), whereas the central cornea had the smallest, with median of 14.1 μm (14.3±2.5 μm).
Conformity exhibited a pattern roughly the opposite of the period, although the variations were smaller. Conformity changed little throughout the sclera, with a slight trough at the anterior equator and an increase at the cornea. The central cornea had the largest average conformity of 17.7 μm (20.7±12.5 μm), whereas the anterior equator had the smallest conformity of 11.7 μm (12.6±5.6 μm).
Regional Differences in Crimp Distribution
The matrices of comparisons between region pairings are shown in Figure 8. For every region pairing, at least one of the five crimp parameters was significantly different. Even though tortuosity, waviness, and amplitude have similar region to region patterns (Figure 6 and 7), they did not have the same results when comparing between regions.
Peripheral and central cornea had significantly different collagen crimp, whereby the peripheral cornea had larger tortuosity, waviness, and amplitude than the central cornea. The period and conformity of the fibers in these two regions, however, were not significantly different.
When comparing the limbus and equator regions, we found that bundles from these two regions were not significantly different in period, conformity, and tortuosity. The limbus had larger waviness and amplitude than the equator.
When comparing the PPS and corneal regions, we found that the PPS had larger period, smaller conformity than the cornea. The PPS had smaller waviness and tortuosity than the peripheral cornea, though there was no significant difference when comparing the waviness and tortuosity of the PPS vs. the central cornea. In contrast, the PPS had larger amplitude than the central cornea, but there was no significant difference between the amplitudes of the PPS and the peripheral cornea.
Bundle by Bundle Crimp Associations
When separating the bundles by region, we found that for all the regions, tortuosity, waviness, and amplitude were positively significantly associated with one another. When measurements were pooled for all bundles across the globe, again the tortuosity, waviness, and amplitude were also positively associated with one another. Within each region and across the globe, bundles with larger tortuosity were likely to have larger waviness and amplitude. Period and conformity relationships with other parameters were region specific, meaning that, in some regions bundles with larger period had larger conformity whereas in some regions they had smaller conformity, and in the rest they had no significant associations.
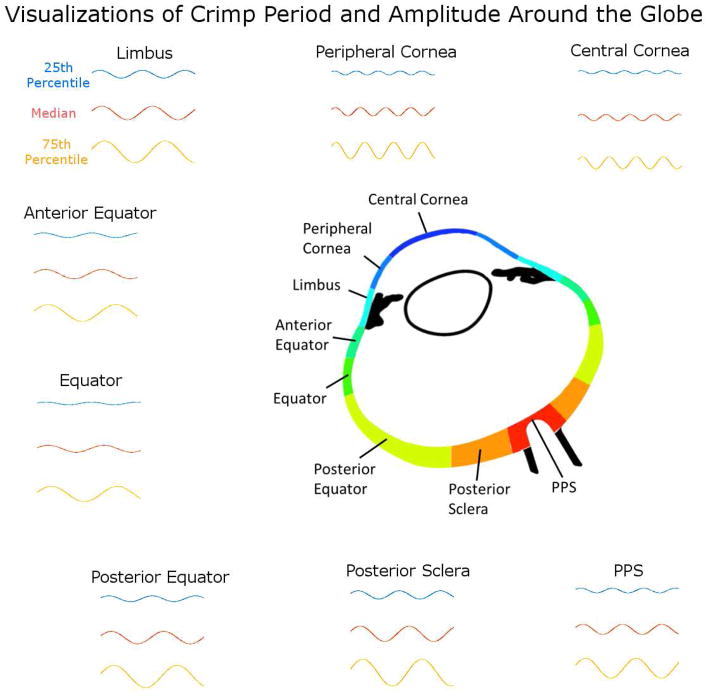
To facilitate understanding the meaning of the parameters variations measured, we constructed visualization of the variation in crimp from each region using the values of period and amplitude. (Figure 10).
Figure 10.
Comparing crimp period and amplitude across regions. The 25th percentile, 50th percentile (median), and 75th percentile period and amplitude values were used to generate representative fibers for each region as sinusoidals. Note that these visualizations are not intended to represent any specific fibril, fiber, fiber bundle or lamellae, but are intended to visualize how the crimp differs between regions.
4. Discussion
Our goals were to carry out a systematic quantification of the crimp morphology over the corneoscleral shell, and to test the hypothesis that collagen crimp is not uniform over the globe, but instead that there are regional patterns. We characterized the collagen crimp properties in 8 regions of the eye, two corneal regions and six scleral regions. Three main results arise from this work. First, all the collagen crimp parameters varied substantially and significantly over the globe. Second, regions with small period were likely to have large conformity, whereas regions with high tortuosity were likely to have high waviness and amplitude. Third, fiber bundles with high tortuosity were likely to also have high waviness and amplitude. Let us consider each of these in turn.
Collagen crimp parameters varied substantially and significantly over the globe
Collagen crimp properties are a critical determinant of tissue biomechanical properties.(Fratzl, 2008; Holzapfel, 2001) Our results show that these parameters are neither uniform nor vary randomly from region to region. Instead, we found that these parameters have distinct patterns over the globe, where regions have specific combinations of parameters. (Figures 6 and 7) This, in turn, points to the existence of a mechanism that controls the collagen fiber properties at the regional level.
Central corneal fiber bundles were significantly different than the peripheral fiber bundles in 4 out of the 5 crimp parameters. Only conformity was not significantly different between the central and peripheral cornea. (Figure 8) The differences in the remaining parameters indicate that the peripheral region is biomechanically distinct from the central region. Other studies have found that the peripheral cornea has a different immunohistochemistry,(Hamrah et al., 2003) and ultrastructure than the central cornea, different thickness(Martola and Baum, 1968) and curvature,(Read et al., 2006) and different collagen fiber architecture, including density and anisotropy.(Meek and Boote, 2009)
Regions with small period were likely to have large conformity while, regions with high tortuosity were likely to have high waviness and amplitude
As a reminder, conformity is not the width of each collagen bundle, but the width of contiguous similarly oriented bundles, which could include several collagen bundles. Generally, the larger the conformity, the more uniform and organized a region is because more of the fiber bundles are oriented in the same direction. This indicates that collagen fiber bundles that have smaller periods tend to stack together to form large groups of bundles with similar orientations. This stacking pattern may also be related to the collagen fibril diameters in these regions. Further work is needed to understand the full extent of the relationship between the crimp characteristics and the local structure. This stacking pattern may also be related to the collagen fibril diameters in these regions. Quigley and colleagues reported that the collagen fibril diameters were larger in the equator and smaller in the PPS,(Quigley et al., 1991) following a similar pattern to what we found for crimp period. The fibers of the cornea had the largest conformities and smallest periods, consistent with this region being organized more regularly compared to the sclera.(Han et al., 2005; Meek and Fullwood, 2001) The sclera anterior to the equator, on the other hand, had the largest period and smallest conformity. This evidence points to the period and conformity as parameters representative of the overall level of structural organization in a tissue region.
Fiber bundles with high tortuosity were likely to have high waviness and amplitude
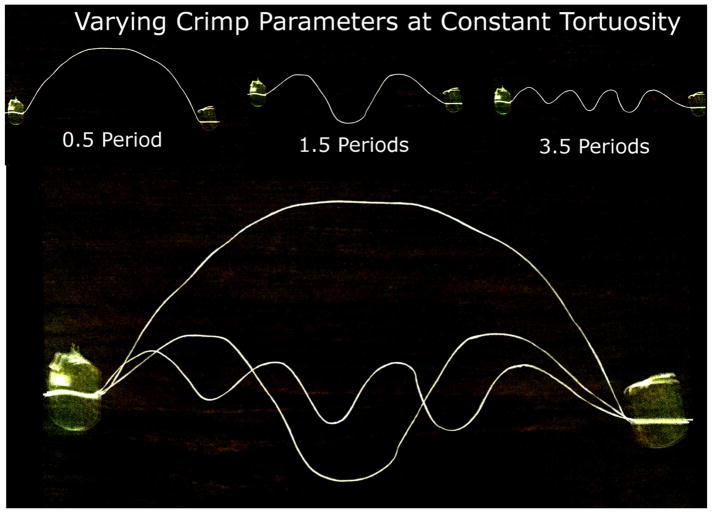
Fiber bundle’s tortuosity, waviness, and amplitude were significantly related across the whole globe as well as within each of the 8 regions. (Figure 9) This indicates that individual fiber bundles with larger tortuosity tend to have larger waviness and amplitude, and that these associations are not region specific. For any specific fiber, tortuosity, waviness, and amplitude will vary together with stretch. (Figure 11) However, it is possible to define two fibers that have the same tortuosity, but have different waviness and amplitude (Figure 12). Even though these fibers could exist, we found that ocular collagen fibers followed a distinct pattern, in which fibers with larger tortuosity have larger waviness and amplitude. There are fewer ocular fibers with high waviness and small amplitude, high tortuosity with small amplitude, or high waviness and small tortuosity, and vice versa. This means that the individual fibers generally have similar shapes, and are proportionally larger or smaller depending on the region. (Figure 10) Further studies are needed to fully understand this relationship.
Figure 11.
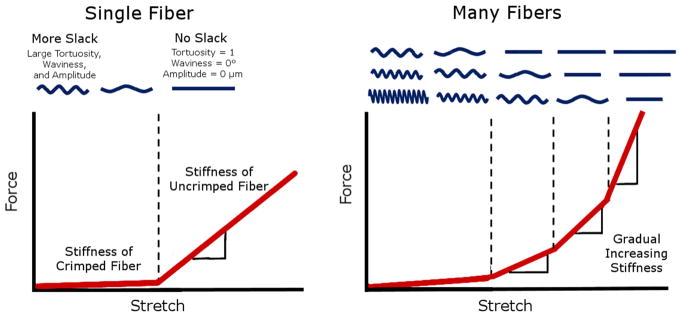
How crimp can influence gradual stiffening in tissue. Stretching an uncrimped fiber usually requires a larger force than stretching the same fiber when it is crimped. (Left) The amount of stretch needed to trigger this stiffening is related to the amount of slack in the fiber. When many fibers of different slack are stretched together, more and more fibers straighten with stretch, gradually increasing the overall stiffness of the tissue. (Right) Figure modified from (Jan et al., 2017a)
Figure 12.
Demonstration of different crimp parameters that can result when the tortuosity is held constant. Consider two fibers with the same tortuosity, one with a large amplitude but low waviness, and the other with low amplitude and large waviness. One way to visualize these different fibers is to fix the endpoints of a piece of string, with some slack, which forces the tortuosity to a constant value. Constraining the string to having a sinusoidal crimp pattern, one notices that increasing the frequency of the waves (decreasing the period) decreases the amplitude and increases the waviness. By taping the ends of a string, we held the amount of slack, or the tortuosity, of the string constant. Increasing the frequency, or number of periods, resulted in smaller periods and amplitudes, and larger waviness.
Interpreting the crimp parameters
Mechanically, stretching a crimped fiber will cause an increase in period, but a decrease in tortuosity, waviness, and amplitude. (Figure 11) Thus, studies of collagen fiber crimp typically associate larger periods with larger tortuosity, waviness and amplitude. (Diamant et al., 1972) However, two fibers can have the same period with different tortuosity, waviness, and amplitude. Hence, in a population of fibers, the period may or may not be associated with the tortuosity, waviness, or amplitude. It is therefore essential to distinguish parameters representing a population of fibers from parameters representing a specific fiber. Similarly, it is important to distinguish between parameter associations between globe regions and parameter associations within a region. Our results show that regional changes in period are more intimately related to the conformity, a structural organization parameter, rather than with the tortuosity, waviness, and amplitude. Why the period is related to the conformity in ocular collagen fibers is still unknown and warrants further study.
The similar spatial trends between tortuosity, waviness, and amplitude may indicate that these three parameters have a close-knit relationship. These three parameters are related to the amount of “slack” in a crimped fiber, which largely determines the nonlinear biomechanics of the tissue.(Fratzl, 2008; Holzapfel, 2001) Generally, stretching a straight collagen fiber requires substantially more force than straightening a crimped fiber. The process of progressive tissue stiffening due to uncrimping fibers is called recruitment. (Figure 11) Although recruitment is central to the nonlinear stiffening in collagenous soft tissues, there are also other ways that collagen can stretch and stiffen, such as fiber reorientation and fibril or molecular slippage. (Bell et al., 2018) Experimental characterization of these may require techniques other than PLM, such as the X-ray scattering, as recently demonstrated by Bell and colleagues.(Bell et al., 2018) Fibers with more slack require more stretch to get to a straight, stiffer state. In a population of fibers with more variable slack, this stiffening is more gradual, since more and more fibers will become recruited with increasing stretch. The equatorial region had lower mean and less variable fiber tortuosity, waviness, and amplitude compared to other regions. The fibers in this region may therefore require less stretch to straighten, and would stiffen less gradually compared to other regions. The posterior sclera, on the other hand, had larger and more variable tortuosity, waviness, and amplitude. The crimped fibers in this region may require more stretch in order to straighten, and stiffen more gradually compared to those in other regions. A mechanical role for the low slack and low slack variability in the PPS and cornea is consistent with the thought that these regions would benefit from small deformations and uniform stiffening at moderate IOPs. Uniform deformations and stiffening would help maintain cornea shape and sharp optics. For the PPS, uniform stiffening and small deformations would help protect the neural tissues from excessive deformations that could cause neuropathy and vision loss. The role and potential biomechanical advantages, if any, of low slack and low slack variability in the equator is not clear and should be investigated. Our findings, however, suggest that the equator likely does not behave as a soft “mechanical absorber” to protect other regions from large acute volume or IOP increases. This is consistent a recent study in which we found that globe equatorial diameter did not change with increasing IOP.(Voorhees et al., 2017) Alternatively, our results could be interpreted as suggesting that the posterior sclera and peripheral cornea stiffen at higher strains, perhaps serving the role of absorbers.
Crimp has been studied experimentally in several soft tissues, like tendon,(Diamant et al., 1972) arteries,(Hill et al., 2012) and pulmonary valves,(Joyce et al., 2009) because it is recognized as a key characteristic of collagen, and central to its mechanical behavior (Figure 11). Nevertheless, we are not aware of previous reports quantifying collagen crimp across the globe. In this study, the average corneal crimp period was 14.4 μm, consistent with past studies which have shown images of the cornea on which we estimate crimp periods of approximately 15 μm.(Andreo and Farrell, 1982; Gallagher and Maurice, 1977) This may not be the only scale at which crimp exists in the eye, as Liu and colleagues reported crimp periods ~2 μm, using transmitted electron microscopy (TEM).(Liu et al., 2014)
Reports of collagen fiber crimp in the eye go back, at least, 40 years. In 1977, Gallagher and Maurice found striations in the corneal stroma, corresponding to collagen fiber waves.(Gallagher and Maurice, 1977) Since then, others have visualized the crimp in the eye with methods such as brightfield,(Newton et al., 1996; Ostrin and Wildsoet, 2016) electron microscopy,(Andreo and Farrell, 1982) nonlinear microscopy,(Kamma-Lorger et al., 2010; Mega et al., 2012; Midgett et al., 2016; Winkler et al., 2011; Zyablitskaya et al., 2017) and MRI.(Ho et al., 2014) We have also previously visualized and quantified the collagen crimp period and waviness in the optic nerve head.(Jan et al., 2017a; Jan and Sigal, 2018) These studies, however, only focused on small regions. In a modeling study, Grytz and colleagues considered the globe as an integrated structure.(Grytz and Meschke, 2009, 2010; Grytz et al., 2011) Their inverse models predicted that the corneal fiber bundles had a larger crimp angle than the sclera, which agrees with our findings. Later studies with more refined modeling and highly detailed sclera deformation data have been used to make predictions of crimp changes with age.(Fazio et al., 2014; Grytz et al., 2014) However, the predictions have not been validated. We show in this study that the pattern is more complex than just a difference between anterior and posterior poles.
This study is not the first to find regional differences in collagen properties across the globe. Detailed qualitative descriptions of the collagen fiber orientation across the sclera, optic nerve head, and nerve sheath with depth were reported in 1933.(Becher and Osterhage, 1933; Fischer, 1933) There have also been studies testing strips from different regions of the sclera which showed different mechanical properties from the anterior to the posterior pole.(Curtin, 1969; Ischreyt, 1898) Norman and colleagues quantified the corneoscleral shell thicknesses through the globe in 15 equally spaced regions across the axial length of the eye and found that the sclera is thinnest at the equator.(Norman et al., 2010) Recently, a study by Whitford and colleagues used ex vivo whole globe inflation tests to find regional differences in stiffness throughout 9 regions of the corneoscleral shell.(Whitford et al., 2016) They found that the limbus and equatorial regions were the stiffest, with the stiffness decreasing progressively towards the posterior pole. These studies emphasize the importance of understanding the regional differences in the collagen structure and biomechanics across the globe. The studies mentioned above are a small subset. Many other aspects of the regional differences across the corneoscleral shell have been studied, though none of these studies experimentally quantified the collagen crimp morphology.
One possible reason for the distinct lack of experimental measures of crimp in the eye may be due to most imaging methods lacking the sensitivity, resolution, or the field of view for measuring the collagen crimp that PLM has.(Jan et al., 2015; Jan et al., 2017b) Methods like small angle light scattering (SALS)(Girard et al., 2011) and wide angle x-ray scattering (WAXS)(Pijanka et al., 2013) can quantify the collagen fiber orientation across large areas of the eye with high angular resolution, similar to PLM. In a recent study, Bell and colleagues combined these methods with digital image correlation to measure load-induced molecular tilt of fibrillar collagen in cornea.(Bell et al., 2018) However, due to its low lateral resolution this orientation information combines the large-scale tissue anisotropy with the collagen crimp, making it very difficult to characterize the collagen crimp.(Pierlot et al., 2014) The majority of past studies have focused on the macro-scale patterns in the collagen structure.(Brown et al., 2007; Coudrillier et al., 2015; Girard et al., 2011; Ivers et al., 2011; Pijanka et al., 2012; Pijanka et al., 2015; Sigal et al., 2014; Thale and Tillmann, 1993) We have shown that PLM has the appropriate sensitivity, resolution, and field of view to quantify the crimp in ocular tissue.(Jan et al., 2017a; Jan et al., 2015; Jan et al., 2017b) It has been shown that the PLM signal correlates with the orientation of collagen fibers.(Bromage et al., 2003; Diamant et al., 1972; Keikhosravi et al., 2017) In addition, PLM has been used extensively for quantifying crimp in other tissues, such as the vitreous, (Filas et al., 2014) tendon (Diamant et al., 1972; Franchi et al., 2007; Hansen et al., 2001) and ligament.(Boorman et al., 2006; Shah et al., 1977)
We quantified collagen crimp properties on eyes fixed at 0 mmHg IOP. Characterization of the crimp without IOP at 0 mmHg is essential for developing biomechanical models of the eye.(Grytz et al., 2011; Sigal et al., 2013) In recent studies, we characterized the crimp in the optic nerve head at baseline(Jan et al., 2017a) as well as with increasing IOP.(Jan and Sigal, 2018) This work presented here is the first step towards extending this understanding from the optic nerve head to the whole globe by characterizing crimp at 0 mmHg IOP. Future studies are needed to determine how the crimp parameters and their relationships change with load. This could be accomplished, for example by using PLM to track how the collagen crimp in individual bundles and a population of bundles in an ocular region change with mechanical stimuli.(Jan et al., 2016)
When interpreting the results in this work, it is important for readers to consider the complex hierarchy of architecture and mechanics of collagenous tissues. Fully understanding the behavior of the cornea and sclera requires a comprehensive approach that incorporates the structure-mechanics relationship at various scales. The crimp patterns we report represent but one of the scales that can impact tissue mechanics.
In this study, we used sheep eyes. Sheep eyes are similar to human eyes in that they have a collagenous lamina cribrosa, but differ in having a ventral groove in the optic nerve head, similar to that in pig.(Brooks et al., 1998) In addition, the sheep globe is larger and less symmetric than the human eye, with different axial lengths and equatorial diameters, as well as more variable tissue thicknesses in the corneoscleral shell.(El-Maghraby et al., 1995; Voorhees et al., 2017) Though it is possible that the crimp patterns found in sheep are not the same in humans, it is important to understand sheep as an animal model.(Candia et al., 2014; Gerometta et al., 2010) Future work should include additional animal models as well as human eyes.
We did not distinguish between nasal and temporal regions of the cornea and sclera. Future studies could consider comparing more regions of the eye, including nasal and temporal, and superior and inferior quadrants. There could also be potential artifacts from using ex vivo tissues and histological processing, such as fixation and cryosectioning. However, we have shown elsewhere that our method of formalin fixation has minimal effects on ocular tissue size, shape, and crimp.(Jan et al., 2015; Tran et al., 2017)
The crimp measurements may be affected by the angle of the collagen fibers relative to the plane of the section, which could underestimate the crimp period, and overestimate conformity, tortuosity, waviness, and amplitudes. We have limited this effect by only analyzing bundles with small out-of-plane components. In addition, it is possible that the collagen crimp in the corneoscleral shell may not have the form of a 2D wave as in some tendons. (Gathercole and Keller, 1991) It may, for instance, form a 3D helix. It is also possible that the form of the crimp varies over the globe, as the cornea lamellae have different spacing and deformation constraints from bundles in the PPS. Future studies should incorporate 3D orientation information into consideration for more accurate crimp shape characterization.(Yang et al., 2017)
We have presented the first experimental quantifications of collagen crimp in eight regions in the corneoscleral shell. These numbers can be used to develop more accurate collagen microstructure constitutive models of the eye. These models could, for example, be used to study what type of crimp characteristics are most likely to cause pathologic deformations to the retinal ganglion cell axons in the optic nerve head, which may, in turn, allow identifying patients at a higher risk for glaucomatous vision loss.
In conclusion, to the best of our knowledge, we have demonstrated the first systematic experimental characterization of the collagen crimp properties in the corneoscleral shell. We have demonstrated spatial patterns of collagen crimp period, conformity, tortuosity, waviness, and amplitude in 8 regions of the eye. This is important because collagen crimp largely determines the nonlinear biomechanical properties of the eye. An important motivation for this work was to provide experimental data on the baseline crimp characteristics needed for the development of robust fiber-based microstructure constitutive models of the eye. Our crimp measurements also provide a basis to understand how microstructure governs larger scale tissue mechanics. The origin and biomechanical implications of the observed collagen crimp patterns remain unclear. Whole globe regulation of collagen is likely insufficient to produce the well-defined regional patterns observed, suggesting that the mechanisms regulating these parameters must act at the regional, and perhaps, at the local levels. This information helps reveal the role of microstructure on eye physiology, in aging, and in biomechanics-related diseases, such as glaucoma.
Research Highlights.
Collagen crimp parameters vary substantially and significantly over the globe.
Waviness, tortuosity, and amplitude, associated with nonlinear biomechanical behavior, exhibited “double hump” distributions.
Period and conformity, representing tissue organization, were substantially different between sclera and cornea.
Parameters representing a population of fibers may not represent any specific fiber.
Our results support the existence of mechanisms that regulate collagen characteristics at the regional level.
Acknowledgments
Funding: This work was supported by the National Institutes of Health R01-EY023966, T32-EY017271, and P30-EY008098, Research to Prevent Blindness, and the Eye and Ear Foundation (Pittsburgh, Pennsylvania).
We would like to acknowledge the people that have helped with the histology, imaging, image processing, manual measurements, or code used in this study: Yoonsoo Kim, Michael Iasella, Mason Lester, Yujie Mu, Andrew Levandoski, Shumeng Yang, Eric Dong, Nicholas Krall, Emma Hundertmark, Mikayla Ferchaw, Brienna Roys, and Jennifer Panza.
Footnotes
Conflict of Interest: None
Publisher's Disclaimer: This is a PDF file of an unedited manuscript that has been accepted for publication. As a service to our customers we are providing this early version of the manuscript. The manuscript will undergo copyediting, typesetting, and review of the resulting proof before it is published in its final citable form. Please note that during the production process errors may be discovered which could affect the content, and all legal disclaimers that apply to the journal pertain.
References
- Andreo R, Farrell R. Corneal small-angle light-scattering theory: wavy fibril models. Journal of the Optical Society of America. 1982;72:1479–1492. doi: 10.1364/josa.72.001479. [DOI] [PubMed] [Google Scholar]
- Becher H, Osterhage K. Über die morphologischen und funktionellen Bezichungen zwischen kollagenen und elastischen Fasern in der Sklera des Rinderauges. Anatomy and Embryology. 1933;101:294–306. [Google Scholar]
- Bell J, Hayes S, Whitford C, Sanchez-Weatherby J, Shebanova O, Vergari C, Winlove C, Terrill N, Sorensen T, Elsheikh A. The hierarchical response of human corneal collagen to load. Acta Biomater. 2018;65:216–225. doi: 10.1016/j.actbio.2017.11.015. [DOI] [PMC free article] [PubMed] [Google Scholar]
- Boorman RS, Norman T, Matsen FA, Clark JM. Using a freeze substitution fixation technique and histological crimp analysis for characterizing regions of strain in ligaments loaded In Situ. J Orth Res. 2006;24:793–799. doi: 10.1002/jor.20081. [DOI] [PubMed] [Google Scholar]
- Bromage TG, Goldman HM, McFarlin SC, Warshaw J, Boyde A, Riggs CM. Circularly polarized light standards for investigations of collagen fiber orientation in bone. The Anatomical Record. 2003;274:157–168. doi: 10.1002/ar.b.10031. [DOI] [PubMed] [Google Scholar]
- Brooks DE, Arellano E, Kubilis PS, Komaromy AM. Histomorphometry of the porcine scleral lamina cribrosa surface. Veterinary Ophthalmology. 1998;1:129–135. doi: 10.1046/j.1463-5224.1998.00029.x. [DOI] [PubMed] [Google Scholar]
- Brown DJ, Morishige N, Neekhra A, Minckler DS, Jester JV. Application of second harmonic imaging microscopy to assess structural changes in optic nerve head structure ex vivo. Journal of biomedical optics. 2007;12:024029. doi: 10.1117/1.2717540. [DOI] [PubMed] [Google Scholar]
- Candia OA, Gerometta RM, Danias J. Tissue plasminogen activator reduces the elevated intraocular pressure induced by prednisolone in sheep. Experimental eye research. 2014;128:114–116. doi: 10.1016/j.exer.2014.10.004. [DOI] [PMC free article] [PubMed] [Google Scholar]
- Coudrillier B, Pijanka J, Jefferys J, Sorensen T, Quigley HA, Boote C, Nguyen TD. Collagen structure and mechanical properties of the human sclera: analysis for the effects of age. Journal of biomechanical engineering. 2015;137:041006. doi: 10.1115/1.4029430. [DOI] [PMC free article] [PubMed] [Google Scholar]
- Curtin BJ. Physiopathologic aspects of scleral stress-strain. Transactions of the American Ophthalmological Society. 1969;67:417. [PMC free article] [PubMed] [Google Scholar]
- Diamant J, Keller A, Baer E, Litt M, Arridge R. Collagen; ultrastructure and its relation to mechanical properties as a function of ageing. Proceedings of the Royal Society of London B: Biological Sciences. 1972;180:293–315. doi: 10.1098/rspb.1972.0019. [DOI] [PubMed] [Google Scholar]
- El-Maghraby HM, Nyland TG, Bellhorn RW. Ultrasonographic and biometric evaluation of sheep and cattle eyes. Veterinary Radiology & Ultrasound. 1995;36:148–151. [Google Scholar]
- Fazio MA, Grytz R, Morris JS, Bruno L, Gardiner SK, Girkin CA, Downs JC. Age-related changes in human peripapillary scleral strain. Biomechanics and modeling in mechanobiology. 2014;13:551–563. doi: 10.1007/s10237-013-0517-9. [DOI] [PMC free article] [PubMed] [Google Scholar]
- Filas BA, Shah NS, Zhang Q, Shui YB, Lake SP, Beebe DC. Quantitative imaging of enzymatic vitreolysis-induced fiber remodeling. Invest Ophthalmol Vis Sci. 2014;55:8626–8637. doi: 10.1167/iovs.14-15225. [DOI] [PMC free article] [PubMed] [Google Scholar]
- Fischer E. Die konstruktive Anordnung der kollagenen Fasern in der Sklera und den Sehnervenscheiden des Rinderauges. Zeitschrift für Anatomie und Entwicklungsgeschichte. 1933;101:168–210. [Google Scholar]
- Franchi M, Fini M, Quaranta M, De Pasquale V, Raspanti M, Giavaresi G, Ottani V, Ruggeri A. Crimp morphology in relaxed and stretched rat Achilles tendon. J Anat. 2007;210:1–7. doi: 10.1111/j.1469-7580.2006.00666.x. [DOI] [PMC free article] [PubMed] [Google Scholar]
- Fratzl P. Collagen: structure and mechanics. Springer Science & Business Media; New York City, NY: 2008. [Google Scholar]
- Gałecki A, Burzykowski T. Linear mixed-effects model, Linear Mixed-Effects Models Using R. Springer; 2013. pp. 245–273. [Google Scholar]
- Gallagher B, Maurice D. Striations of light scattering in the corneal stroma. Journal of ultrastructure research. 1977;61:100–114. doi: 10.1016/s0022-5320(77)90009-0. [DOI] [PubMed] [Google Scholar]
- Gathercole LJ, Keller A. Crimp morphology in the fibre-forming collagens. Matrix. 1991;11:214–234. doi: 10.1016/s0934-8832(11)80161-7. [DOI] [PubMed] [Google Scholar]
- Gerometta R, Spiga MG, Borrás T, Candia OA. Treatment of sheep steroid–induced ocular hypertension with a glucocorticoid-inducible MMP1 gene therapy virus. Investigative Ophthalmology & Visual Science. 2010;51:3042–3048. doi: 10.1167/iovs.09-4920. [DOI] [PMC free article] [PubMed] [Google Scholar]
- Girard MJ, Dahlmann-Noor A, Rayapureddi S, Bechara JA, Bertin BME, Jones H, Albon J, Khaw PT, Ethier CR. Quantitative Mapping of Scleral Fiber Orientation in Normal Rat Eyes. Investigative Ophthalmology & Visual Science. 2011;52:9684–9693. doi: 10.1167/iovs.11-7894. [DOI] [PubMed] [Google Scholar]
- Grytz R, Fazio MA, Libertiaux V, Bruno L, Gardiner S, Girkin CA, Downs JC. Age- and Race-Related Differences in Human Scleral Material Properties. Investigative Ophthalmology & Visual Science. 2014;55:8163–8172. doi: 10.1167/iovs.14-14029. [DOI] [PMC free article] [PubMed] [Google Scholar]
- Grytz R, Meschke G. Constitutive modeling of crimped collagen fibrils in soft tissues. Journal of the Mechanical Behavior of Biomedical Materials. 2009;2:522–533. doi: 10.1016/j.jmbbm.2008.12.009. [DOI] [PubMed] [Google Scholar]
- Grytz R, Meschke G. A computational remodeling approach to predict the physiological architecture of the collagen fibril network in corneo-scleral shells. Biomechanics and Modeling in Mechanobiology. 2010;9:225–235. doi: 10.1007/s10237-009-0173-2. [DOI] [PubMed] [Google Scholar]
- Grytz R, Meschke G, Jonas JB. The collagen fibril architecture in the lamina cribrosa and peripapillary sclera predicted by a computational remodeling approach. Biomechanics and Modeling in Mechanobiology. 2011;10:371–382. doi: 10.1007/s10237-010-0240-8. [DOI] [PubMed] [Google Scholar]
- Hamrah P, Huq SO, Liu Y, Zhang Q, Dana MR. Corneal immunity is mediated by heterogeneous population of antigen-presenting cells. J Leukocyte Biol. 2003;74:172–178. doi: 10.1189/jlb.1102544. [DOI] [PubMed] [Google Scholar]
- Han M, Giese G, Bille JF. Second harmonic generation imaging of collagen fibrils in cornea and sclera. Optics express. 2005;13:5791–5797. doi: 10.1364/opex.13.005791. [DOI] [PubMed] [Google Scholar]
- Hansen KA, Weiss JA, Barton JK. Recruitment of Tendon Crimp With Applied Tensile Strain. Journal of Biomechanical Engineering. 2001;124:72–77. doi: 10.1115/1.1427698. [DOI] [PubMed] [Google Scholar]
- Hill MR, Duan X, Gibson GA, Watkins S, Robertson AM. A theoretical and non-destructive experimental approach for direct inclusion of measured collagen orientation and recruitment into mechanical models of the artery wall. J Biomech. 2012;45:762–771. doi: 10.1016/j.jbiomech.2011.11.016. [DOI] [PMC free article] [PubMed] [Google Scholar]
- Ho LC, Sigal IA, Jan NJ, Squires A, Tse Z, Wu EX, Kim SG, Schuman JS, Chan KC. Magic Angle–Enhanced MRI of Fibrous Microstructures in Sclera and Cornea With and Without Intraocular Pressure Loading. Investigative Ophthalmology & Visual Science. 2014;55:5662–5672. doi: 10.1167/iovs.14-14561. [DOI] [PMC free article] [PubMed] [Google Scholar]
- Holzapfel GA. Handbook of Materials Behavior Models. Academic Press; San Diego, CA: 2001. [Google Scholar]
- Ischreyt G. Zur Mechanik der Sklera. Graefe’s Archive for Clinical and Experimental Ophthalmology. 1898;46:677–705. [Google Scholar]
- Ivers KM, Li C, Patel N, Sredar N, Luo X, Queener H, Harwerth RoS, Porter J. Reproducibility of measuring lamina cribrosa pore geometry in human and nonhuman primates with in vivo adaptive optics imaging. Investigative ophthalmology & visual science. 2011;52:5473–5480. doi: 10.1167/iovs.11-7347. [DOI] [PMC free article] [PubMed] [Google Scholar]
- Jan NJ, Gomez C, Moed S, Voorhees AP, Schuman JS, Bilonick RA, Sigal IA. Microstructural Crimp of the Lamina Cribrosa and Peripapillary Sclera Collagen Fibers. Investigative Ophthalmology & Visual Science. 2017a;58:3378–3388. doi: 10.1167/iovs.17-21811. [DOI] [PMC free article] [PubMed] [Google Scholar]
- Jan NJ, Grimm JL, Tran H, Lathrop KL, Wollstein G, Bilonick RA, Ishikawa H, Kagemann L, Schuman JS, Sigal IA. Polarization microscopy for characterizing fiber orientation of ocular tissues. Biomedical Optics Express. 2015;6:4705–4718. doi: 10.1364/BOE.6.004705. [DOI] [PMC free article] [PubMed] [Google Scholar]
- Jan NJ, Iasella M, Lester M, Hu D, Lathrop KL, Voorhees AP, Tran H, Wollstein G, Schuman JS, Sigal IA. Novel method reveals heterogeneous micro-scale response of sclera collagen bundles to homogeneous macro-scale stretch. Investigative Ophthalmology & Visual Science. 2016;57:3566–3566. [Google Scholar]
- Jan NJ, Lathrop K, Sigal IA. Collagen Architecture of the Posterior Pole: High-Resolution Wide Field of View Visualization and Analysis Using Polarized Light Microscopy. Investigative Ophthalmology & Visual Science. 2017b;58:735–744. doi: 10.1167/iovs.16-20772. [DOI] [PMC free article] [PubMed] [Google Scholar]
- Jan N-J, Sigal IA. Collagen fiber recruitment: a microstructural basis for the nonlinear response of the posterior pole of the eye to increases in intraocular pressure. Acta Biomater. 2018 doi: 10.1016/j.actbio.2018.03.026. In Press. [DOI] [PMC free article] [PubMed] [Google Scholar]
- Joyce EM, Liao J, Schoen FJ, Mayer JE, Jr, Sacks MS. Functional Collagen Fiber Architecture of the Pulmonary Heart Valve Cusp Annals of Thoracic Surgery. 2009;87:1240–1249. doi: 10.1016/j.athoracsur.2008.12.049. [DOI] [PMC free article] [PubMed] [Google Scholar]
- Kamma-Lorger CS, Boote C, Hayes S, Moger J, Burghammer M, Knupp C, Quantock AJ, Sorensen T, Di Cola E, White N. Collagen and mature elastic fibre organisation as a function of depth in the human cornea and limbus. Journal of Structural Biology. 2010;169:424–430. doi: 10.1016/j.jsb.2009.11.004. [DOI] [PubMed] [Google Scholar]
- Keikhosravi A, Liu Y, Drifka C, Woo KM, Verma A, Oldenbourg R, Eliceiri KW. Quantification of collagen organization in histopathology samples using liquid crystal based polarization microscopy. Biomedical optics express. 2017;8:4243–4256. doi: 10.1364/BOE.8.004243. [DOI] [PMC free article] [PubMed] [Google Scholar]
- Liu X, Wang L, Ji J, Yao W, Wei W, Fan J, Joshi S, Li D, Fan Y. A Mechanical Model of the Cornea Considering the Crimping Morphology of Collagen Fibrils. Investigative Ophthalmology & Visual Science. 2014;55:2739–2746. doi: 10.1167/iovs.13-12633. [DOI] [PubMed] [Google Scholar]
- Martola EL, Baum JL. Central and peripheral corneal thickness: a clinical study. Archives of Ophthalmology. 1968;79:28–30. doi: 10.1001/archopht.1968.03850040030009. [DOI] [PubMed] [Google Scholar]
- Meek KM, Boote C. The use of X-ray scattering techniques to quantify the orientation and distribution of collagen in the corneal stroma. Progress in Retinal and Eye Research. 2009;28:369–392. doi: 10.1016/j.preteyeres.2009.06.005. [DOI] [PubMed] [Google Scholar]
- Meek KM, Fullwood NJ. Corneal and scleral collagens—a microscopist’s perspective. Micron. 2001;32:261–272. doi: 10.1016/s0968-4328(00)00041-x. [DOI] [PubMed] [Google Scholar]
- Mega Y, Robitaille M, Zareian R, McLean J, Ruberti J, DiMarzio C. Quantification of lamellar orientation in corneal collagen using second harmonic generation images. Optics Letters. 2012;37:3312–3314. doi: 10.1364/OL.37.003312. [DOI] [PMC free article] [PubMed] [Google Scholar]
- Midgett DE, Quigley HA, Pease ME, Franck C, Toyjanova J, Nguyen TD. Inflation test of the human optic nerve head using digital volume correlation. In: Tekalur SA, Zavattieri P, Korach CS, editors. Mechanics of Biological Systems and Materials. Vol. 6. Springer; Orlanda, FL: 2016. pp. 7–15. [Google Scholar]
- Newton RH, Brown JY, Meek K. Polarized light microscopy technique for quantitatively mapping collagen fibril orientation in cornea, BiOS Europe’96. International Society for Optics and Photonics. 1996:278–284. [Google Scholar]
- Norman RE, Flanagan JG, Rausch SM, Sigal IA, Tertinegg I, Eilaghi A, Portnoy S, Sled JG, Ethier CR. Dimensions of the human sclera: thickness measurement and regional changes with axial length. Experimental eye research. 2010;90:277–284. doi: 10.1016/j.exer.2009.11.001. [DOI] [PubMed] [Google Scholar]
- Ostrin LA, Wildsoet CF. Optic nerve head and intraocular pressure in the guinea pig eye. Experimental eye research. 2016;146:7–16. doi: 10.1016/j.exer.2015.12.007. [DOI] [PMC free article] [PubMed] [Google Scholar]
- Pierlot CM, Lee JM, Amini R, Sacks MS, Wells SM. Pregnancy-induced remodeling of collagen architecture and content in the mitral valve. Ann Biomed Eng. 2014;42:2058–2071. doi: 10.1007/s10439-014-1077-6. [DOI] [PubMed] [Google Scholar]
- Pijanka JK, Abass A, Sorensen T, Elsheikh A, Boote C. A wide-angle X-ray fibre diffraction method for quantifying collagen orientation across large tissue areas: application to the human eyeball coat. Journal of Applied Crystallography. 2013;46:1481–1489. [Google Scholar]
- Pijanka JK, Coudrillier B, Ziegler K, Sorensen T, Meek KM, Nguyen TD, Quigley HA, Boote C. Quantitative mapping of collagen fiber orientation in non-glaucoma and glaucoma posterior human sclerae. Investigative Ophthalmology & Visual Science. 2012;53:5258–5270. doi: 10.1167/iovs.12-9705. [DOI] [PMC free article] [PubMed] [Google Scholar]
- Pijanka JK, Spang MT, Sorensen T, Liu J, Nguyen TD, Quigley HA, Boote C. Depth-Dependent Changes in Collagen Organization in the Human Peripapillary Sclera. PloS one. 2015;10:e0118648. doi: 10.1371/journal.pone.0118648. [DOI] [PMC free article] [PubMed] [Google Scholar]
- Preibisch S, Saalfeld S, Tomancak P. Globally optimal stitching of tiled 3D microscopic image acquisitions. Bioinformatics. 2009;25:1463–1465. doi: 10.1093/bioinformatics/btp184. [DOI] [PMC free article] [PubMed] [Google Scholar]
- Püspöki Z, Storath M, Sage D, Unser M. Focus on Bio-Image Informatics. Springer; 2016. Transforms and operators for directional bioimage analysis: a survey; pp. 69–93. [DOI] [PubMed] [Google Scholar]
- Quantock AJ, Winkler M, Parfitt GJ, Young RD, Brown DJ, Boote C, Jester JV. From nano to macro: studying the hierarchical structure of the corneal extracellular matrix. Experimental Eye Research. 2015;133:81–99. doi: 10.1016/j.exer.2014.07.018. [DOI] [PMC free article] [PubMed] [Google Scholar]
- Quigley HA, Dorman-Pease ME, Brown AE. Quantitative study of collagen and elastin of the optic nerve head and sclera in human and experimental monkey glaucoma. Current eye research. 1991;10:877–888. doi: 10.3109/02713689109013884. [DOI] [PubMed] [Google Scholar]
- Read SA, Collins MJ, Carney LG, Franklin RJ. The topography of the central and peripheral cornea. Investigative ophthalmology & visual science. 2006;47:1404–1415. doi: 10.1167/iovs.05-1181. [DOI] [PubMed] [Google Scholar]
- Schindelin J, Arganda-Carreras I, Frise E, Kaynig V, Longair M, Pietzsch T, Preibisch S, Rueden C, Saalfeld S, Schmid B. Fiji: an open-source platform for biological-image analysis. Nat Methods. 2012;9:676–682. doi: 10.1038/nmeth.2019. [DOI] [PMC free article] [PubMed] [Google Scholar]
- Shah J, Jayson M, Hampson W. Low tension studies of collagen fibres from ligaments of the human spine. Ann Rheum Dis. 1977;36:139. doi: 10.1136/ard.36.2.139. [DOI] [PMC free article] [PubMed] [Google Scholar]
- Shribak M, Oldenbourg R. Techniques for fast and sensitive measurements of two-dimensional birefringence distributions. Appl Opt. 2003;42:3009–3017. doi: 10.1364/ao.42.003009. [DOI] [PubMed] [Google Scholar]
- Sigal I, Grimm J, Jan NJ, Bilonick R, Wollstein G, Kagemann L, Ishikawa H, Schuman J, Davoli K, Lathrop K. IOP elevation reduces the waviness of the load bearing collagen fibers in the lamina cribrosa. Investigative Ophthalmology & Visual Science. 2013;54:3158–3158. [Google Scholar]
- Sigal IA, Grimm JL, Jan NJ, Reid K, Minckler DS, Brown DJ. Eye-Specific IOP-Induced Displacements and Deformations of Human Lamina Cribrosa. Investigative ophthalmology & visual science. 2014;55:1–15. doi: 10.1167/iovs.13-12724. [DOI] [PMC free article] [PubMed] [Google Scholar]
- Standring S. Gray’s anatomy: the anatomical basis of clinical practice. 41. Elsevier Limited; New York: 2016. [Google Scholar]
- Thale A, Tillmann B. The collagen architecture of the sclera--SEM and immunohistochemical studies. Ann Anat. 1993;175:215–220. doi: 10.1016/s0940-9602(11)80004-x. [DOI] [PubMed] [Google Scholar]
- Tran H, Jan NJ, Hu D, Voorhees A, Schuman JS, Smith MA, Wollstein G, Sigal IA. Formalin Fixation and Cryosectioning Cause Only Minimal Changes in Shape or Size of Ocular Tissues. Scientific Reports. 2017;7:12065. doi: 10.1038/s41598-017-12006-1. [DOI] [PMC free article] [PubMed] [Google Scholar]
- Voorhees AP, Ho LC, Jan NJ, Tran H, van der Merwe Y, Chan K, Sigal IA. Whole-globe biomechanics using high-field MRI. Experimental Eye Research. 2017;160:85–95. doi: 10.1016/j.exer.2017.05.004. [DOI] [PMC free article] [PubMed] [Google Scholar]
- Whitford C, Joda A, Jones S, Bao F, Rama P, Elsheikh A. Ex vivo testing of intact eye globes under inflation conditions to determine regional variation of mechanical stiffness. Eye and Vision. 2016;3:21. doi: 10.1186/s40662-016-0052-8. [DOI] [PMC free article] [PubMed] [Google Scholar]
- Winkler M, Chai D, Kriling S, Nien CJ, Brown DJ, Jester B, Juhasz T, Jester JV. Nonlinear optical macroscopic assessment of 3-D corneal collagen organization and axial biomechanics. Investigative Ophthalmology & Visual Science. 2011;52:8818–8827. doi: 10.1167/iovs.11-8070. [DOI] [PMC free article] [PubMed] [Google Scholar]
- Yang B, Jan NJ, Lam P, Lathrop KL, Sigal IA. Collagen architecture in the third dimension: 3D polarized light microscopy (3DPLM) for mapping in-plane (IP) and out-of-plane (OOP) collagen fiber architecture. Investigative Ophthalmology & Visual Science. 2017;58:4825–4825. doi: 10.1167/iovs.16-20772. [DOI] [PMC free article] [PubMed] [Google Scholar]
- Zyablitskaya M, Takaoka A, Munteanu EL, Nagasaki T, Trokel SL, Paik DC. Evaluation of Therapeutic Tissue Crosslinking (TXL) for Myopia Using Second Harmonic Generation Signal Microscopy in Rabbit Sclera. Investigative ophthalmology & visual science. 2017;58:21–29. doi: 10.1167/iovs.16-20241. [DOI] [PMC free article] [PubMed] [Google Scholar]


