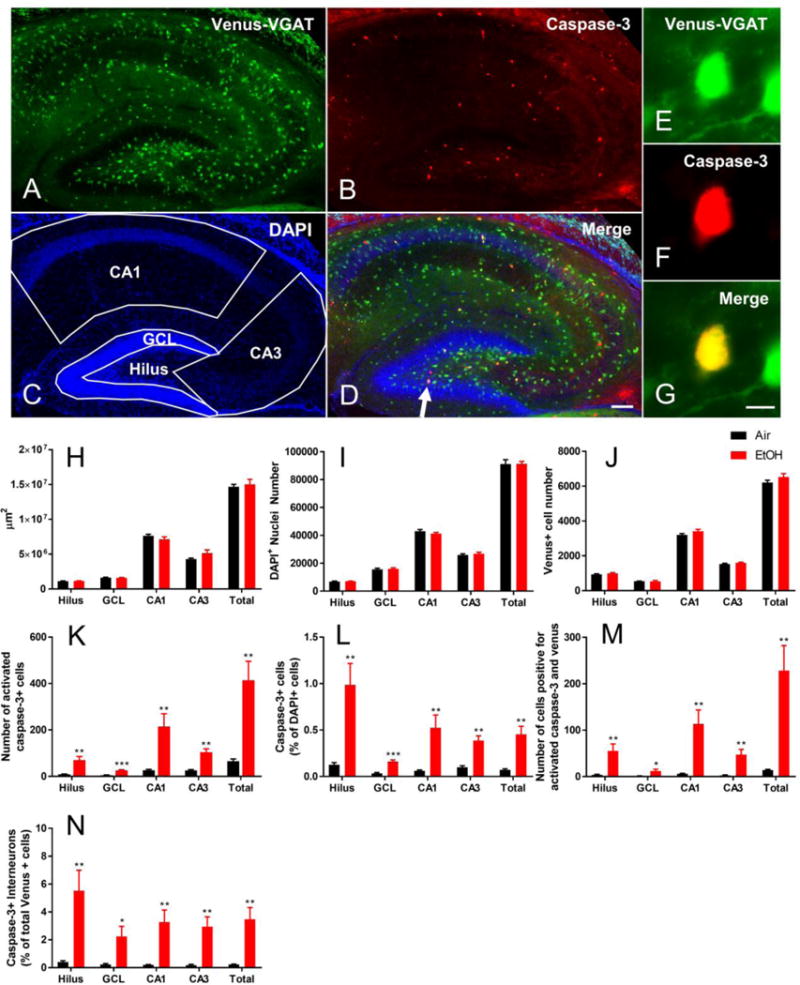
Figure 1.

Exposure to EtOH at P7 activates apoptotic pathways in interneurons of the mouse hippocampus. An example of activated caspase-3 immunohistochemistry from an EtOH-exposed Venus-VGAT+ mouse is presented in A-D (10× objective; scale bar = 100μm), with a high magnification image of an activated-caspase-3 expressing Venus+ interneuron shown in E-G (40× objective, scale bar = 10 μm). (A) Venus fluorescence driven by VGAT promoter in hippocampal interneurons. (B) Activated caspase-3 immunochemistry. (C) DAPI staining of nuclei within the hippocampus, along with contours used for counting interneurons, cleaved caspase-3 positive cells, and cleaved caspase-3 positive interneurons. (D) Merged image used for colocalization. The arrow points to the cell used for high magnification images shown in E-G. (E) Venus fluorescence at high magnification. (F) Cleaved caspase-3 immunofluorescence at high magnification. (G) Merged Venus and cleaved caspase-3 demonstrating colocalization at high magnification. (H) The total area in μm2 of each hippocampal region analyzed for both vapor chamber exposure conditions is presented. (I) The total number of DAPI+ nuclei in each hippocampal region. (J) The number of Venus positive interneurons in the hippocampus. (K) Cleaved caspase-3 positive cells in each hippocampal region. (L) Cleaved caspase-3 positive cells as a percentage of total DAPI nuclei in the hippocampus. (M) Number of activated-caspase-3 expressing Venus+ interneurons in the hippocampus. (N) Percent of Venus+ cells that were positive for activated caspase-3. Data are presented as mean + SEM. Black bars represent air-exposed mice, red bars represent EtOH-exposed mice. Asterisk(*) denotes a significant between-subjects effect of vapor chamber exposure condition within region from repeated measures ANOVA at p < 0.05, ** p < 0.01, *** p < 0.001. n = 5 mice per vapor chamber exposure condition.
