Abstract
Purpose
3D printed patient specific vascular models provide the ability to perform precise and repeatable benchtop experiments with simulated physiological blood flow conditions. This approach can be applied to CT-derived patient geometries to determine coronary flow related parameters such as Fractional Flow Reserve (FFR). To demonstrate the utility of this approach we compared bench-top results with non-invasive CT-derived FFR software based on a computational fluid dynamics algorithm and catheter based FFR measurements.
Materials and Methods
Twelve patients for whom catheter angiography was clinically indicated signed written informed consent to CT Angiography (CTA) before their standard care that included coronary angiography (ICA) and conventional FFR (Angio-FFR). The research CTA was used first to determine CT-derived FFR (Vital Images) and second to generate patient specific 3D printed models of the aortic root and three main coronary arteries that were connected to a programmable pulsatile pump. Benchtop FFR was derived from pressures measured proximal and distal to coronary stenosis using pressure transducers.
Results
All 12 patients completed the clinical study without any complication, and the three FFR techniques (Angio-FFR, CT-FFR, and Benchtop FFR) are reported for one or two main coronary arteries. The Pearson correlation among Benchtop FFR/Angio-FFR, CT-FFR/ Benchtop FFR, and CT-FFR/ Angio-FFR are 0.871, 0.877, and 0.927 respectively.
Conclusions
3D printed patient specific cardiovascular models successfully simulated hyperemic blood flow conditions, matching invasive Angio-FFR measurements. This benchtop flow system could be used to validate CT-derived FFR diagnostic software, alleviating both cost and risk during invasive procedures.
Description of Purpose
Cardiovascular disease (CVD) is one of the main causes of death in the United States with an estimated 92.1 million adults currently effected by at least one form of CVD.1 One form of CVD is coronary artery disease (CAD), characterized by atherosclerotic coronary stenosis. Treatment for CAD includes drug-based therapies, endovascular procedures such as angioplasty, and bypass grafting, the later reserved for severe disease or total occlusions. Endovascular procedures have an established risk profile2; however the decision for revascularization is best guided with data regarding hemodynamic significance, and this traditionally requires FFR via catheterization and direct pressure measurements. The degree of lesion stenosis does not entirely correlate with hemodynamic significance, particularly for lesions of intermediate stenosis, and thus if anatomy alone (e.g. CTA) is to be used as a noninvasive gatekeeper for revascularization, a better assessment method for these lesions is required.
Angio-Fractional Flow Reserve (FFR) is considered the reference standard to determine the hemodynamic significance of lesions. FFR measures blood flow conditions by invasively navigating a pressure wire through the artery and reading out a ratio of the pressure both proximal and distal to the stenosis.3,4 This method allows for lesions of intermediate stenosis to be better analyzed with regards to hemodynamics. Typically, a threshold FFR ratio of 0.8 determines whether or not a stent will be used to treat the stenosis. However, there are drawbacks associated with invasive FFR. These drawbacks include the potential for complications, and costs for the equipment and professional services. These drawbacks lead to a need for a non-invasive assessment method for coronary lesion significance.
One such method is CT-derived FFR (CT-FFR). This non-invasive diagnostic method utilizes CT coronary geometry and computational fluid dynamics to estimate FFR. By being able to accurately and non-invasively diagnose CAD using these methods, the associated risks and costs with the invasive FFR procedures can be reduced. However, currently CT-FFR software can only be optimized with the use of theoretical models driven by large-scale clinical trials.
3D printing offers the ability to reduce the need for large-scale clinical trials by providing the ability to accurately replicate patient-specific anatomy and physiology in a tangible way with precise functional performance. Geometry extension and inclusion of pathologies such as atherosclerotic plaques or surrounding anatomical structures gives rise to 3D printed models in which flow measurements can be accurately tested4. This study leverages 3D printing to build patient specific phantoms that closely mimic the arterial wall mechanics as a validation tool for a diagnostic software.
We 3D printed patient specific coronary phantoms for 12 patients who underwent 320-detector coronary CTA (Aquilion ONE, Canon Medical Systems). Subjects were scanned using a CT-FFR protocol and FFR was measured via pressure wire in the catheterization lab as part of the subjects’ normal clinical workflow. This project uses a CT-FFR research software (Canon Medical Systems) available on a Vitrea workstation (Vital images). The algorithm is based on a computational fluid dynamics algorithm and is designed to detect the ratio of pressures distal and proximal to an occlusion. This ratio is estimated under conditions which the ratio of the pressures is proportional to the ratio of the flows and can thus be used analogous to interventional FFR to estimate the hemodynamic significance of coronary lesions.5 For each patient we 3D printed a phantom 2–9 which was used in a benchtop simulation where flow conditions were measured with high accuracy using flow and pressure sensors.4
This is one of the first studies where patient specific coronary models are being used to validate a CT-FFR. In this paper, we present the results and the comparison between the CT-FFR software, the Benchtop FFR, and the Angio-FFR to validate the CT-FFR software. Therefore; we have created a new approach to determine FFR through use of 3D printing with the ability to simulate hyperemic blood flow conditions matching invasive Angio-FFR measurements.
Materials and Methods
Study Design and Patient Inclusion Criteria
Collection and analyses of all scan and patient data has been performed within the scope of a research protocol approved by the University at Buffalo Institutional Review Board (IRB). The study has been registered as a clinical trial under the same protocol approved by the university. (https://clinicaltrials.gov/show/NCT03149042)
Patients who were scheduled for clinically indicated elective invasive coronary angiography (ICA) at Buffalo General Hospital were consented to participate in the clinical trial. The study inclusion criteria were patients with coronary artery disease scheduled for catheterization to characterize the disease severity. The exclusion criteria were as follows: less than 30 years of age, atrial fibrillation, renal insufficiency (estimated glomerulus filtration rate <60 mL/min/1.73m2), active bronchospasm prohibiting the use of beta blockers, body mass index >40kg/m2, contraindication to iodinated contrast, patients not showing coronary calcification during calcium scoring procedures, and pregnancy.
The study schema is outlined in Figure 1. The University at Buffalo cardiologists associated with the clinical trial verified the list of patients a week prior to the scheduled catheter interventions. They notified the engineers whenever a patient qualified for the study. On the day of the ICA procedure, informed consent was obtained from the patient to participate in the trial. Immediately before the planned ICA procedure, enrolled patients underwent a research CCTA scan on a 320x0.5 mm detector-row CT (Aquilion ONE, Canon Medical Systems, Japan). The phase window width for acquisition was 70–99% of the R-R cardiac wave cycle.
Figure 1.
The clinical trial outline is displayed in the figure above starting with scheduling an Angio-FFR procedure and followed by the flow in which the patient is consented and the data is collected for research purposes.
CT-FFR Software
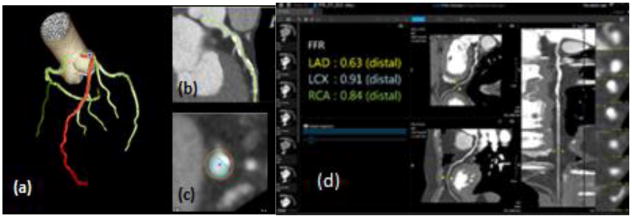
Reconstructed CCTA images were imported into Vitrea segmentation software with specific cardiac functionality. Within Vitrea, a CT-FFR diagnostic algorithm software provided output CT-derived FFR estimates, also allowing for anatomical visualization as a multi-planar reformation, vessel centerlines and contours. (Figure 2) The algorithm takes four volumes from the CCTA scan between 70–99% of the cardiac R-R cycle and determines the FFR based on a computational fluid dynamics algorithm detecting hemodynamically significant coronary lesions. The user selects the phase with the least motion artifact and proceeds to the segmentation phase. He/she must verify that the software has selected the correct three main arteries. If needed, the contours and centerlines are manually edited. An FFR value is outputted for each of the three main coronary arteries (LAD, LCX, RCA) at a distal location that can be moved to a desired location. For this study the location of measurement was based on the lesion length to match that of the interventional FFR location.
Figure 2.
3D reconstructed data volumes uploaded to Vital Images. (a) Automatic segmentation of main coronary arteries (LAD, LCX, RCA) with the LAD highlighted in red. (b) Visualization in a multi-planar view (c) in order to draw centerlines and contours (d) The FFR was calculated via Vitrea algorithm for each of the three main coronary arteries.
ICA Procedure
Each patient then underwent ICA where a catheter is threaded under x-ray imaging from typically the femoral artery or occasionally the brachiocephalic artery, through the aorta and then to the diseased region of the coronary vessel. A pressure catheter is inserted into the diseased vasculature and navigated to the desired location. Contrast is injected into the vessels after the pressure catheter insertion. The physicians recorded FFR, referred to as ‘Angio-FFR’ in this study, in the coronary vessels where it deems appropriate, and only those which were of clinical interest – one or two vessels per patient typically (Figure 3). The FFR value was measured at two lesion lengths below the distal throat of the lesion. For the purpose of this clinical trial and reflecting clinical practice, only lesion in the three main coronary arteries were included.
Figure 3.
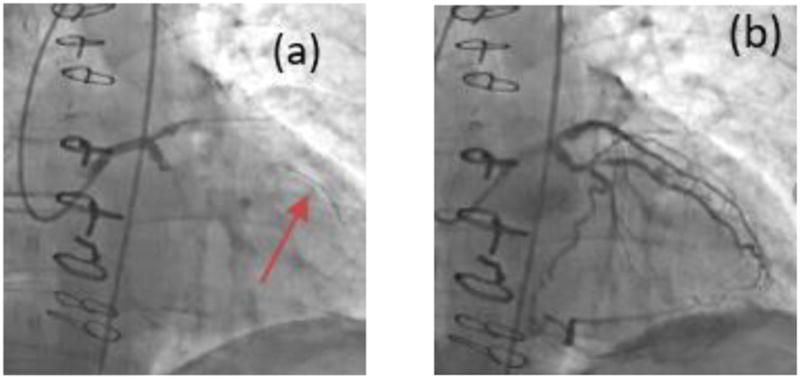
Raw data from the procedure was obtained for each patient. (a)The pressure catheter (pointed at by the red arrow) is navigated through the Left Main coronary artery to determine FFR during ICA. (b) Contrast injection after pressure catheter insertion.
Benchtop Cardiovascular Model Design
Using the Vitrea workstation, the aortic root and three main coronary arteries were segmented for each patient. The centerlines of each of the three main coronary arteries were edited as necessary to improve segmentation. The segmentation included the aortic root and coronary lumens for the 3 main coronary arteries. All heart tissue and calcium was excluded. A stereolithographic (STL) file of the segmentation containing only the aortic root and the three main coronary arteries was then created and exported by the software.
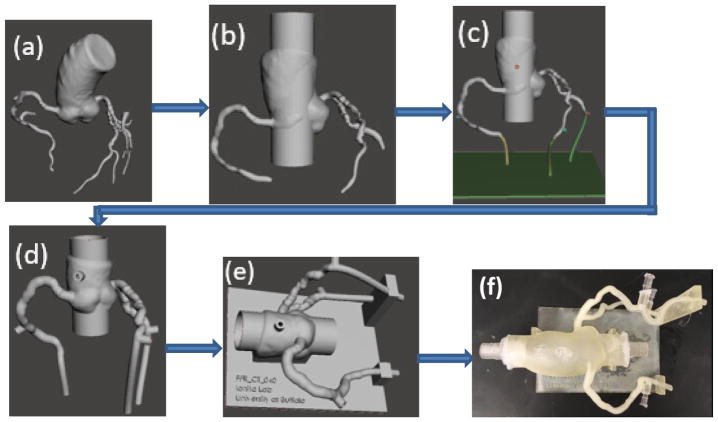
The STL file was then imported into Autodesk Meshmixer (Figure 4a). The mesh was simplified and smoothed where needed. The aortic root was extruded at both the inflow and outflow, by appending a 30 mm cylinder through the root (Figure 4b). The three main coronary arteries were also extruded at the outlets. Pressure ports were appended to the aortic and the three main coronary arteries with 4 mm diameters acting as sites to place fluid pressure sensors for flow testing purposes (Figure 4c). The Meshmixer “make solid” command was employed with an offset thickness of 2mm. The inner lumen was combined to the solid mesh to form a hollow 3D printable vasculature.1,6,8 The inlets and outlets of the model were finally cut to allow for interior flow immersion (Figure 4d).
Figure 4.
Flow diagram showing the steps used in the Targeted Outflow Compliance Approach from the time the STL is imported into Meshmixer to the completion of the segmentation process. (a) Initial STL imported from Vitrea (b) Removing smaller vessel branches, sculpting and smoothing (c) Outlets extended by adding tubing to each branch and pressure sensor port appendage both proximal and distal to the atherosclerotic region. (d)Make solid with 2 mm offset distance. (e)Support appended. (f) 3D printed model.
A support structure for the 3D printable anatomy was then designed in SolidWorks, which allowed for support at each vessel outlet as well as at the aortic root. The support structure was imported into Meshmixer and oriented around the vasculature. The Boolean Difference operation was performed between the support structure and the anatomy. The support and the vasculature was then combined to create a single structure (Figure 4e). This completed design was then exported from Meshmixer as an STL file. An Object Polyjet 3D printer, Model260 V (Objet-Stratasys, Inc. Eden Prairie, MN) was used to print the model in TangoPlus (Figure 4f). Figure 4 displays the workflow involved in converting the luminal anatomy STL file to the final 3D-printable model.
Benchtop Cardiovascular Flow Determination
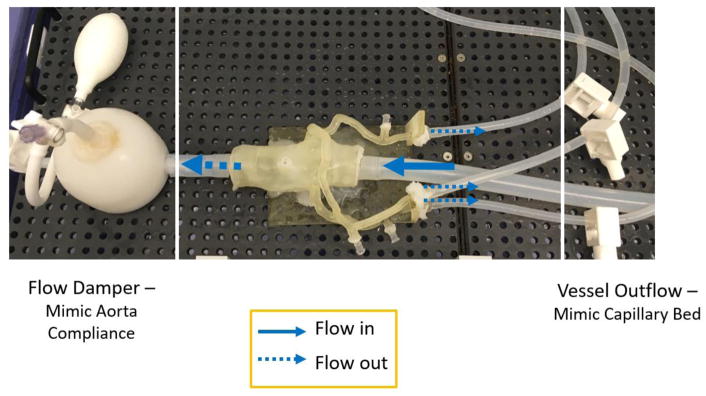
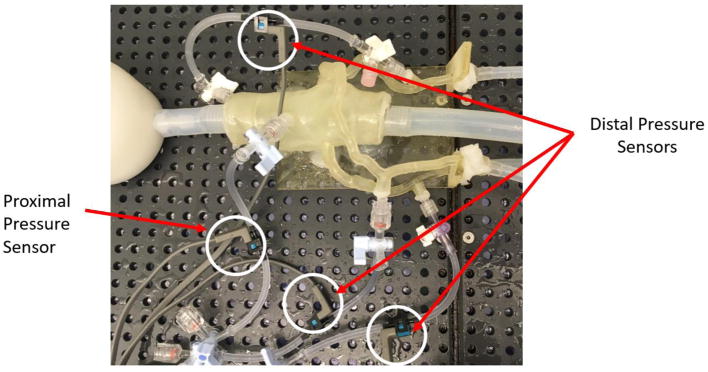
The 3D printed patient-specific cardiovascular models were connected to a programmable pulsatile pump, Compu-Flow 1000 (Shelley Medical London, Ontario Canada), and pressure was measured both proximal and distal to the stenosis using pressure transducers. A water/ glycerol solution was formulated to simulate the viscosity of the blood and aids in physiologically accurate resistance across the vessels. The flow rate was maintained within a physiologically accurate range and the distal resistance also remained constant with the incorporation of mechanical clamps simulating capillary bed resistance. The pressure data was collected using an NI Max ELVIS breadboard and LabVIEW program, enabling calculation of the Benchtop FFR from the recorded pressure drops under pulsatile flow. Figure 5 and Figure 6 display the benchtop system setup with the incorporation of the 3D printed model, mechanical clamps, damper and pressure sensors.
Figure 5.
The benchtop setup includes a 3D printed patient specific coronary model attached to a flow loop pumping a glycerol/water mixture to simulate the viscosity of blood. A flow damper is used to mimic the compliance of the aorta as well as distal resistance clamps to represent distal resistance acting on the vessels from the capillary beds.
Figure 6.
The 3D printed phantom is connected to pressure sensors at the center of the aorta and distal on the LAD, LCX, and RCA. The pressure sensors are wired to a bread board and the pressure measurements are computed via a LabVIEW program.
Results
Twelve patients were included in this study and successfully underwent all three FFR techniques: Angio-FFR, CT-FFR, and Benchtop FFR. Table 1 displays the FFR data obtained for all patients. Of the patients, eight had stenosis present in the left anterior descending (LAD) artery, three in the left circumflex (LCX) artery, and one in the right coronary artery (RCA). The results for Patient #4 and Patient #10 are further examined as these cases differ greatly in stenosis severity with an Angio-FFR of 0.94 for Patient #4 and an Angio-FFR of 0.49 for Patient #10.
Table 1.
The measured fractional flow reserve using all three FFR techniques (CT-FFR, Benchtop FFR, and Angio-FFR) was determined for twelve patients.
| Patient | Coronary Vessel | CT-FFR | Benchtop FFR | Angio-FFR |
|---|---|---|---|---|
| #1 | LAD | 0.88 | 0.83 | 0.81 |
| #2 | LCX | 0.91 | 0.80 | 0.85 |
| #3 | LAD | 0.74 | 0.76 | 0.76 |
| #4 | LAD | 0.88 | 0.81 | 0.94 |
| #5 | LAD | 0.9 | 0.92 | 0.90 |
| #6 | LCX | 0.94 | 0.91 | 0.98 |
| #7 | LAD | 0.92 | 0.98 | 0.88 |
| #8 | LAD | 0.79 | 0.73 | 0.70 |
| #9 | LCX | 0.94 | 0.85 | 0.93 |
| #10 | LAD | 0.41 | 0.48 | 0.49 |
| #11 | RCA | 0.76 | 0.89 | 0.81 |
| #12 | LAD | 0.7 | 0.73 | 0.76 |
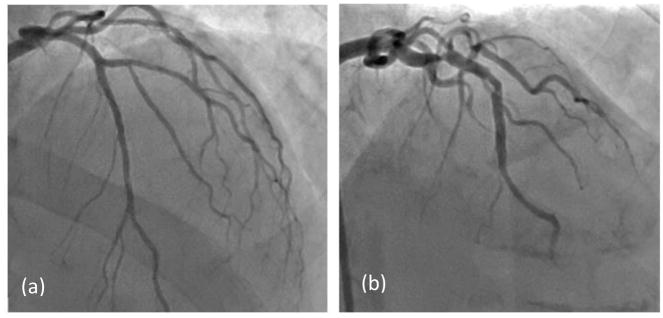
For purposes of the below analysis, Angio-FFR is considered the reference standard of the FFR value, and compared against the Benchtop FFR and CT-FFR values. We are then able to validate the CT-FFR measurements with the Benchtop-FFR results. In Figure 7 angiography results are compared for Patients #4 (Figure 7a) and #10 (Figure 7b), both of which contained stenosis present in the left anterior descending (LAD) artery.
Figure 7.
Angiography comparison of the stenosis severity in the LAD. (a) Patient #4 with an FFR value of 0.94. (b) Patient #10 with an FFR value of 0.41.
CCTA data was used to determine CT-FFR (Canon Medical Systems and Vital Images). Figure 8 displays a multi-planar reconstruction of the target vessels for Patient #4 and Patient #10. The stenosis appears as the highly contrasted, ovular regions within the vessels. Manual vessel contouring and centerline manipulation occurs at this stage in which the user segments the vessel lumen from the stenosis.
Figure 8.
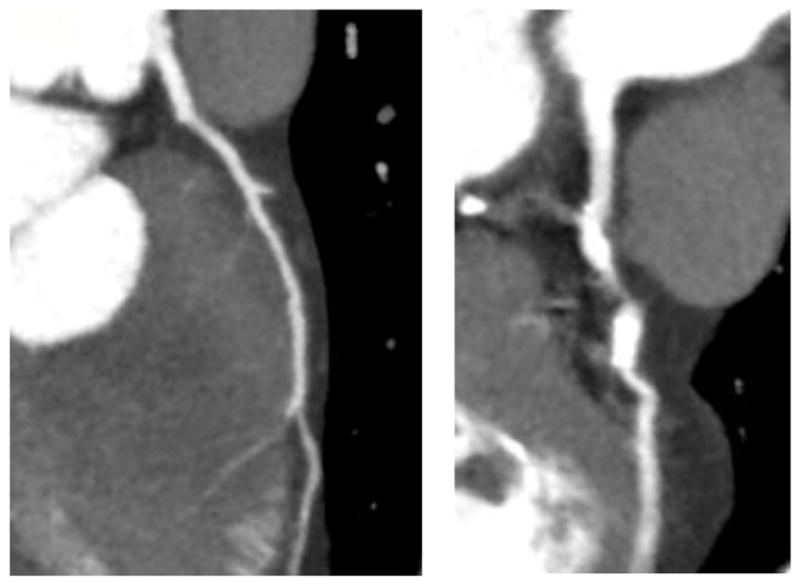
MPR view of the target vessels for (a) Patient #4 and (b) Patient #10 are displayed and the variation in stenosis can be greatly differentiated. This view in Vital Images gives the user the capability to visualize the stenosis for segmentation purposes in this study.
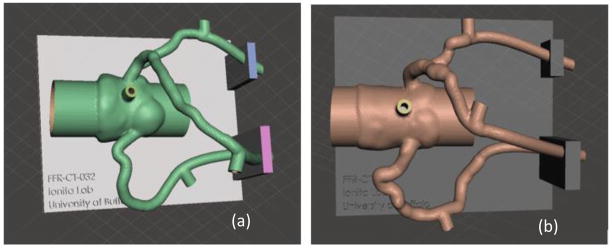
An STL file is exported from Vital Images after both automatic and manual lumen segmentation. The vascular geometry is transformed into a 3D mesh with hollowed out vessel lumens and appended pressure sensors ports, compatible for 3D printing. Figure 9 displays the aortic root and three main coronary arteries within Autodesk Meshmixer with a support structure created in Solidworks.
Figure 9.
The three main coronary arteries and aortic root are transformed into 3D printable meshes with a support structure created in Solidworks appended to the vasculature. The stenosis severity can be differentiated between (a) Patient #4 with mild stenosis in the LAD and (b) Patient #10 with severe stenosis in the LAD.
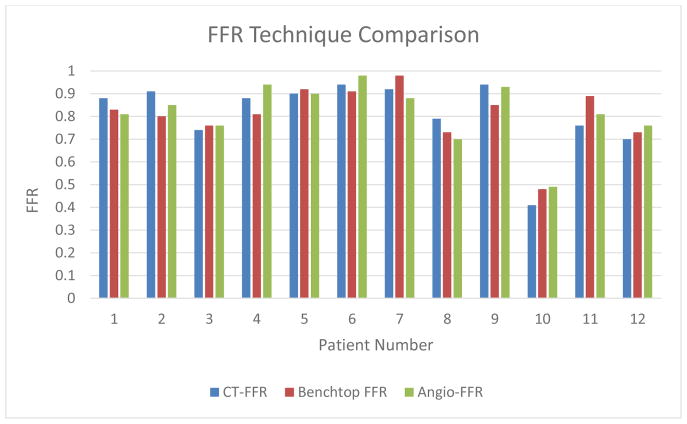
Figure 10 displays a visual comparison of the three FFR determination methods. With Angio-FFR being the “true value,” the Benchtop FFR and CT-FFR are both compared to the Angio-FFR and various statistical analysis measures are used to analyze the data below.
Figure 10.
FFR Technique Comparison (CT-FFR, Benchtop FFR, and Angio-FFR) for all 12 patients currently analyzed for the study.
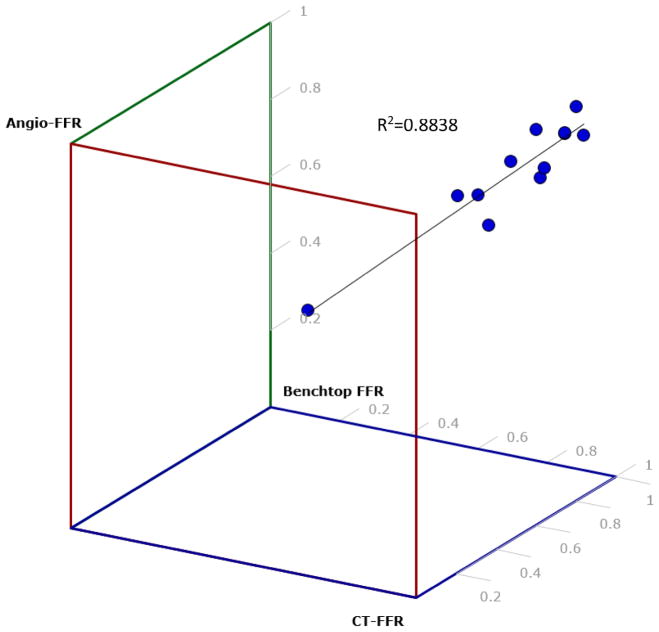
Figure 11 displays a 3D scatter plot of Angio-FFR, CT-FFR, and Benchtop FFR which depicts the correlation between these three FFR determination strategies. With R2 being 0.8838, the percentage of variance from the line of regression proves that our results have a strong relationship estimation between the linear model and the response variable.
Figure 11.
A 3D scatter plot was created to determine the correlation between Angio-FFR, Benchtop FFR, and CT-FFR. Each dot represents a patient from out study. R2=0.88 which shows that the data is lightly fitted to the line of regression. This estimates a strong relationship between the linear model and the response variable.
We analyzed our data between Angio-FFR/ Benchtop FFR, Angio-FFR/ CT-FFR, and Benchtop FFR/ CT-FFR through Pearson Correlation (Table 2). Pearson correlation, being a strength measurement of linear association, reveals that the three comparisons prove to be highly correlated. This validates the accuracy of the Benchtop-FFR and CT-FFR in parallel with Angio-FFR as well as between each other.
Table 2.
A Pearson Correlation was calculated among the three different FFR techniques in order to validate accuracy of CT-FFR.
| FFR Technique Comparison | Pearson Correlation |
|---|---|
| CT-FFR/ Benchtop FFR | 0.877 |
| CT-FFR/ Angio- FFR | 0.927 |
| Benchtop FFR/ Angio-FFR | 0.871 |
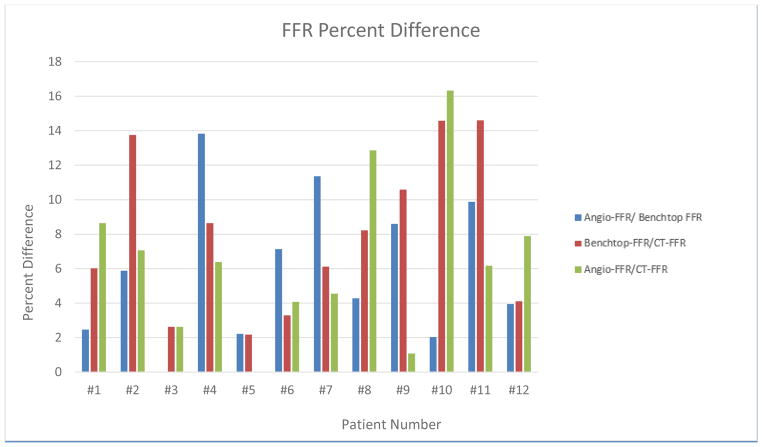
Figure 12 displays a graphical representation of the percent difference between the three FFR determination techniques, Angio-FFR/Benchtop FFR, Benchtop FFR/CT-FFR, and Angio-FFR/CT-FFR. The sum of the percent difference of all 12 patients is 71.66, 94.75, and 69.77, respectively. The average percent difference is 5.97, 7.89, and 6.47, respectively.
Figure 12.
FFR Percent Difference determined between Angio-FFR/Benchtop FFR, Benchtop FFR/CT-FFR, and Angio-FFR/CT-FFR.
Discussion
In this study we demonstrate the preliminary results of using the patient specific 3D printed coronary models to simulate blood flow conditions similar to those observed in humans. High printing resolution, advance printing polymers, precise segmentation software (Vitrea, Vital Images) and intuitive mesh manipulation software (Autodesk Meshmixer) can allow researchers to build patient specific vascular models with high anatomical and mechanical accuracy. These precise patient specific vascular phantoms can be further use to perform reliable blood flow simulation experiments and allow for measurement of physiological parameters associated with vascular disease. Previous compliance testing data by Sommer et. al. demonstrated that the material properties of our 3D printed models to accurately simulate human coronary vasculature.2 Cardiac blood flow analysis has further advanced our abilities to program pulsatile waveforms and reported flow rates into our pulsatile pump. Therefore, we have built a non-invasive tool to further advance the analysis of coronary lesions with regards to hemodynamic significance, information which currently is mainly retrieved through invasive Angio-FFR determination.
The pressure readings we have obtained through our benchtop models prove to be strongly correlated to Angio-FFR with a Pearson correlation of 0.871. The Pearson correlation between Benchtop-FFR and CT-FFR is 0.877 which indicates that our benchtop models can be used to validate CT-FFR software, specifically an algorithm which incorporates hemodynamic significance. A Pearson correlation of 0.927 between CT-FFR and Angio-FFR proves the accuracy of the CT-FFR software in comparison to the “gold standard” Angio-FFR.
With an R-value of 0.8838 between all three FFR determination methods (Angio-FFR, Benchtop FFR, CT-FFR), it can be concluded that the data is tightly fitted to the line of regression, that being a linear model. This test of linearity concludes a depiction of FFR readings that have very little deviation from one another, confirming that Benchtop FFR is accurate when being compared to Angio-FFR as well as CT-FFR having a strong correlation to both Benchtop FFR and Angio-FFR.
The average of the percent difference of Angio-FFR/Benchtop FFR, Benchtop FFR/CT-FFR, and Angio-FFR/CT-FFR is 5.97, 7.89, and 6.47, respectively. With average percent differences of <8%, the accuracy of our pressure data proves that anatomic and physiological accuracy are maintained in our benchtop models and the CT-FFR software. Benchtop FFR is highly accurate in comparison to the “gold standard” Angio-FFR and can therefore be used as a tool to validate CT-FFR software and any other image-based diagnostic software.
3D printed patient specific cardiovascular models can therefore be used to simulate in vivo hyperemic blood flow conditions and thus used to validate CT-FFR diagnostic software giving the medical community an estimation of atherosclerotic lesion severity pre-ICA.
Conclusions
We presented a straightforward workflow for data acquisition and creation of physiologically and geometrically accurate 3D printed cardiovascular coronary models that can be used to perform physiologically accurate blood flow simulations at hyperemic in vivo conditions. These models can be used to optimize and validate CT-FFR software that provides an estimation of atherosclerotic lesion severity under physiologically accurate flow conditions. 3D printed benchtop models are a tool which can be used pre-ICA to both reduce the cost and the risks during invasive procedures.
References
- 1.Benjamin Emelia J, Blaha Michael J, Chiuve Stephanie E, Cushman Mary, Das Sandeep R, Deo Rajat, de Ferranti Sarah D, Floyd James, et al. On behalf of the American Heart Association Statistics Committee and Stroke Statistics Subcommittee. 2017. Heart Disease and Stroke Statistics—2017 Update: A Report From the American Heart Association. [Google Scholar]
- 2.Qureshi Adnan I, Luft Andreas R, Sharma Mudit, Guterman Lee R, Nelson Hopkins L. Prevention and Treatment of Thromboembolic and Ischemic Complications Associated with Endovascular Procedures: Part I—Pathophysiological and Pharmacological Features. Neurosurgery. 2000 Jun 1;46(6):1344–1359. doi: 10.1097/00006123-200006000-00012. https://doi.org/10.1097/00006123-200006000-00012. [DOI] [PubMed] [Google Scholar]
- 3.Sommer Kelsey N, Izzo Richard L, Shepard Lauren, Podgorsak Alexander R, Rudin Stephen, Siddiqui Adnan H, Wilson Michael, Angel Erin, Zaid Said, Springer Michael E, Ionita Ciprian N. Design optimization for accurate flow simulations in 3D printed vascular phantoms derived from computed tomography angiography. Proceedings of SPIE. 2017;10138:101380R. doi: 10.1117/12.2253711. [DOI] [PMC free article] [PubMed] [Google Scholar]
- 4.Shepard Lauren, Sommer Kelsey N, Izzo Richard L, Podgorsak Alexander R, Wilson Michael, Zaid Said, Rybicki Frank J, Mitsouras Dimitrios, Rudin Stephen, Angel Erin, Ionita Ciprian N. Initial simulated FFR investigation using flow measurements in patient-specific 3D printed coronary phantoms. Proceedings of SPIE. 2017;10138:101380S. doi: 10.1117/12.2253889. [DOI] [PMC free article] [PubMed] [Google Scholar]
- 5.Brown BG, et al. Quantitative coronary arteriography: estimation of dimensions, hemodynamic resistance, and atheroma mass of coronary artery lesions using the arteriogram and digital computation. Circulation. 1977;55(2):329. doi: 10.1161/01.cir.55.2.329. [DOI] [PubMed] [Google Scholar]
- 6.Izzo RL, O'Hara RP, Iyer V, Hansen R, Meess KM, Nagesh SS, Siddiqui AH, Rudin S, Springer M, Ionita CN. 3D printed cardiac phantom for procedural planning of a transcatheter native mitral valve replacement. SPIE Medical Imaging. 2016:978908-978908–978916. doi: 10.1117/12.2216952. [DOI] [PMC free article] [PubMed] [Google Scholar]
- 7.Ionita CN, Mokin M, Varble N, Bednarek DR, Xiang J, Snyder KV, Siddiqui AH, Levy EI, Meng H, Rudin S. Challenges and limitations of patient-specific vascular phantom fabrication using 3D Polyjet printing. Proc SPIE Int Soc Opt Eng. 2014;9038:90380M. doi: 10.1117/12.2042266. [DOI] [PMC free article] [PubMed] [Google Scholar]
- 8.Russ M, O'Hara R, Nagesh SS, Mokin M, Jimenez C, Siddiqui A, Bednarek D, Rudin S, Ionita C. Treatment planning for image-guided neuro-vascular interventions using patient-specific 3D printed phantoms. SPIE Medical Imaging. 2015:941726-941726–941711. doi: 10.1117/12.2081997. [DOI] [PMC free article] [PubMed] [Google Scholar]
- 9.O'Hara RP, Chand A, Vidiyala S, Arechavala SM, Mitsouras D, Rudin S, Ionita CN. Advanced 3D mesh manipulation in stereolithographic files and post-print processing for the manufacturing of patient-specific vascular flow phantoms. SPIE Medical Imaging. 2016:978909-978909–978910. doi: 10.1117/12.2217036. [DOI] [PMC free article] [PubMed] [Google Scholar]


