

Abstract
In eukaryotic cells, organelle-specific stress-response mechanisms are vital for maintaining cellular homeostasis. The Golgi apparatus, an essential organelle of the secretory system, is the major site of protein modification and sorting within a cell and functions as a platform for spatially regulated signaling. Golgi homeostasis mechanisms that regulate organelle structure and ensure precise processing and localization of protein substrates remain poorly understood. Using a chemical biology strategy to induce protein unfolding, we uncover a Golgi-specific transcriptional response. An RNA-sequencing profile of this stress response compared with the current state-of-the-art Golgi stressors, nigericin and xyloside, demonstrates the enhanced precision of Golgi targeting achieved with our system. The data set further reveals previously uncharacterized genes that we find to be essential for Golgi structural integrity. These findings highlight the Golgi’s ability to sense misfolded proteins and establish new aspects of Golgi autoregulation.
INTRODUCTION
The Golgi apparatus is a complex organelle that orchestrates many important functions in eukaryotic cells. As the central member of the secretory pathway, the Golgi is a major site of protein modification and sorting (De Matteis and Luini, 2008; Morre and Mollenhauer, 2009; Lippincott-Schwartz and Phair, 2010; Brandizzi and Barlowe, 2013; Progida and Bakke, 2016). Throughout the Golgi, proteins imported from the endoplasmic reticulum (ER) can acquire many posttranslational modifications, including the addition or removal of carbohydrates (Morre and Mollenhauer, 2009; Stanley, 2011; Moremen et al., 2012). These modifications occur without the use of templates and rely on the precise control of Golgi compartmentalization, reaction rates, and substrate/product concentrations (Varki, 1998; Stanley, 2011). Proteins destined to leave the Golgi are packaged into specific carriers for targeted trafficking to various cell compartments (De Matteis and Luini, 2008; Progida and Bakke, 2016). Golgi trafficking and processing events are tightly integrated with signaling pathways, such as those driven by Src and PKA, which can directly influence secretion and Golgi structural integrity (Muñiz et al., 1997; Martin et al., 2000; Cabrera et al., 2003; Bejarano et al., 2006; Pulvirenti et al., 2008; Mavillard et al., 2010; Giannotta et al., 2012). Moreover, the Golgi can serve as an assembly platform for major signaling complexes (Farhan and Rabouille, 2011; Mayinger, 2011; Makowski et al., 2017).
The structure and function of the Golgi change during different stages of the cell cycle and also during conditions of stress. Regulated structural disassembly occurs during cell division, after which the Golgi is reassembled in daughter cells (Shorter and Warren, 2002; Sütterlin et al., 2002; Corda et al., 2012). Additionally, the demands of increased protein secretion can influence Golgi size and capacity (Bierring, 1962; Rambourg et al., 1987). Stress related to disease can also alter Golgi structure (Bexiga and Simpson, 2013). In particular, a dispersed Golgi phenotype has been observed in several cancer cell lines and may play a central role in metastasis (Kellokumpu et al., 2002; Baschieri et al., 2014, 2015; Petrosyan et al., 2014). Additionally, in Alzheimer’s disease, the Golgi is known to undergo fragmentation, and it is thought that fortifying Golgi stability could be a potential therapeutic strategy (Stieber et al., 1996; Jiang et al., 2014; Joshi et al., 2014). Thus, to ensure proper function of Golgi processes not only basally but also during stress, the requirement for dedicated stress-response and homeostatic mechanisms is readily apparent.
Knowledge of Golgi homeostatic mechanisms is sparse due to limitations of current tools used to perturb and study the Golgi. Various pharmacological agents interfering with Golgi functions, such as ionophores (e.g., monensin and nigericin) that increase the pH of acidic endomembrane compartments, glycosylation inhibitors (e.g., xyloside and GalNAc-bn), and brefeldin A, which interferes with Golgi-related transport processes, have been used to induce Golgi stress (Oku et al., 2011; Miyata et al., 2013; Reiling et al., 2013; Taniguchi et al., 2015; Baumann et al., 2017). However, these stressors are not Golgi specific and possess a multitude of confounding effects, that is, ionophores affect the pH of several organelles, and glycosylation inhibitors affect many downstream processes involving glycosylated proteins (Okayama et al., 1973; Hamati et al., 1989; Mollenhauer et al., 1990; Freeze et al., 1993; Dinter and Berger, 1998). Thus, it is difficult to identify direct consequences of Golgi stress and mechanisms that directly influence Golgi homeostasis.
To overcome these limitations, we have developed a novel chemical biology–based cell system that allows us to precisely stress the Golgi with minimal nonspecific effects. Our approach is based on induced protein unfolding via small-molecule hydrophobic tagging of a HaloTag fusion protein, a strategy that has been used to study protein quality-control and stress-response mechanisms in the cytosol and ER (Neklesa et al., 2011, 2013; Encell et al., 2012; Tae et al., 2012; Raina et al., 2014). Here, we explore the transcriptional changes induced by nigericin, xyloside, and our protein unfolding–based system, thereby demonstrating that the selective and targeted unfolding of a Golgi-localized protein affects the Golgi with greater precision when compared with tool compounds currently used to study Golgi stress. We further characterize this Golgi stress transcriptional response to reveal novel genes that are vital for Golgi structural integrity. Furthermore, since our system is based on protein unfolding, we also report the novel finding that the Golgi apparatus has a dedicated response to protein unfolding.
RESULTS AND DISCUSSION
Development of a protein-unfolding system in the Golgi
Given the complex processes that occur within the Golgi apparatus and the importance of a functioning proteome for their fidelity, we hypothesized that protein misfolding would be capable of disturbing Golgi homeostasis. To this end, we used the hydrophobic tagging technology based on the HaloTag domain (Los et al., 2008; Encell et al., 2012). The HaloTag domain is derived from a bacterial dehalogenase and can covalently conjugate to chloroalkanes such as hydrophobic tags, which can induce HaloTag destabilization (Neklesa et al., 2011; Tae et al., 2012). We previously showed that destabilization of HaloTag2 (HT2) fusion proteins in the cytosol or the ER by hydrophobic tagging leads to degradation of the HT2 fusion protein and to the induction of cellular stress-response pathways (Neklesa et al., 2011, 2013; Raina et al., 2014). Prior studies have also demonstrated that the hydrophobic tag, HyT36, directly reduces protein stability of HaloTag7 in vitro (Tae et al., 2012). To gain insight into the destabilization of HT2 proteins by hydrophobic tagging, we monitored the effect of HyT36 on a luciferase-HT2 fusion construct in vitro. We synthesized a des-chloro derivative of HyT36, HyT36(-Cl) that is unable to bind HaloTag and serves as a negative control (Figure 1A). Activity assays upon treatment with HyT36, HyT36(-Cl) or vehicle control clearly demonstrate that conjugation of the hydrophobic tag to luciferase-HT2 leads to protein misfolding (Supplemental Figure S1A).
FIGURE 1:

The hydrophobic tagging system for protein destabilization in the Golgi. (A) Schematic of the GA-HT2 construct and chemical structures of the hydrophobic tag, HyT36, and control molecule, HyT36(-Cl). (B) Representative confocal microscopy images of GA-HT2 (green) colocalization with giantin (magenta) in HEK293 and HeLa cells. Nuclei are visualized with 4′,6-diamidino-2-phenylindole (DAPI; blue). Scale bar: 10 µm. (C) Left, representative Western blot of limited proteolysis of GA-HT2 HEK293 cells after treatment with HyT36, HyT36(-Cl), or DMSO. Right, quantitation of the high-molecular-weight (HMW) digestion product for HyT36 and HyT36(-Cl). Levels are normalized to DMSO control. Data represent mean ± SD (n = 2). (D) Western blot showing total GA-HT2 levels in HEK293 cells in duplicate after 24 h of doxycycline treatment followed by 8 h of HyT36 or DMSO treatment.
To explore homeostasis mechanisms in the Golgi apparatus, we designed enhanced green fluorescent protein (EGFP)-HT2 fusion protein localized to the Golgi apparatus (GA-HT2) via the transmembrane domain of the Golgi-resident protein B4GALT1 (Figure 1A). Induced expression of the construct in either HEK293 or HeLa Flp-In T-REx cell lines upon doxycycline treatment led to proper localization of the fusion protein as visualized by colocalization with the Golgi marker giantin (Figure 1B). Protein destabilization was induced using the HyT36 hydrophobic tag (Tae et al., 2012). Using a limited proteolysis assay, we confirmed that GA-HT2 is susceptible to HyT36-mediated destabilization. Specifically, HyT36 treatment increased GA-HT2 sensitivity to trypsin digestion in cell lysates (Figure 1C). Unlike the protein levels of cytosolic and ER-localized HT2 (Neklesa et al., 2011; Tae et al., 2012; Raina et al., 2014), protein levels of GA-HT2 were not reduced following HyT36 treatment, as measured by Western blotting (Figure 1D) and flow cytometry, even in the presence of cycloheximide and at extended incubation times (Supplemental Figure S1B). Conversely, HyT36 caused a slight increase (∼20–30%) in GA-HT2 protein levels compared with control, which is attributed to clonal variability. As expected, GA-HT2 mRNA levels also remained constant over time during HyT36 treatment (Supplemental Figure S1C). Hydrophobic tagging of HT2 fusion proteins in HeLa cells followed the same pattern of localization-dependent sensitivity to degradation as in HEK293 cells (Neklesa et al., 2011; Tae et al., 2012; Raina et al., 2014); while HyT36 did not affect the levels of Golgi-localized HT2, unfolded cytosolic and ER-localized HT2 fusion proteins were degraded (Supplemental Figure S1D).
Having established an inducible Golgi-specific protein-unfolding system, we compared its cellular effects with those of other Golgi stressors. In contrast to most other strategies used to study Golgi stress (e.g., nigericin treatment), hydrophobic tagging of GA-HT2 at 10 µM HyT36 is nontoxic and does not disrupt Golgi morphology. Toxicity was measured by cell counting after 24 h exposure of GA-HT2 HEK293 cells to various treatments (Supplemental Figure S1E). Nigericin caused an ∼55% reduction in cell number relative to control. Conversely, HyT36 had no effect on cell numbers in the absence of GA-HT2 expression, and in the presence of GA-HT2, HyT36 caused a nonsignificant reduction relative to HyT36(-Cl). Furthermore, hydrophobic tagging of GA-HT2 did not lead to any detectable ultrastructural changes in Golgi morphology compared with control in HeLa cells, as measured by transmission electron microscopy (Supplemental Figure S1F). Taken together, these results show that the GA-HT2 hydrophobic tagging system is well suited for studying Golgi-specific stress without the confounding effects of severe organelle disruption or cell death.
Protein destabilization in the Golgi elicits a unique and specific transcriptional response
Typically, organelle-specific stress responses are characterized by changes in gene expression that increase the functional capacity of the organelle. We hypothesized that a possible transcriptional response to protein misfolding in the Golgi would have genes in common with other stress responses induced by agents such as ionophores or glycosylation inhibitors (Oku et al., 2011; Taniguchi et al., 2015). Accordingly, we examined the ability of hydrophobic tagging in the Golgi to up-regulate genes known to be involved in Golgi structure and trafficking, such as the structural protein and tether GM130 and the SNARE STX3A, which have previously been shown to be responsive to Golgi stressors, including nigericin and xyloside (Oku et al., 2011; Taniguchi et al., 2015). As measured by quantitative PCR (qPCR), hydrophobic tagging induces changes in the expression of the same gene set previously reported to be induced by nigericin or xyloside treatment (Figure 2A). As expected, this response was dependent not only on expression of GA-HT2, but also on conjugation of the hydrophobic tag to the HT2 domain, as demonstrated by comparison to HyT36(-Cl) (Supplemental Figure S2A). Hydrophobic tagging of GA-HT2 also induced up-regulation of Golgi stress genes in HeLa cells, demonstrating the generality of this response among cell lines (Supplemental Figure S2B). To assess the dynamic range of stress gene induction, we performed qPCR experiments at a lower doxycycline concentration, which induced ∼45% lower GA-HT2 expression for the entire population of treated cells (Supplemental Figure S2C). These experiments reveal that the fold induction of stress genes scales with GA-HT2 expression levels (Supplemental Figure S2D). Moreover, when GA-HT2–expressing cells are treated with the HT2 stabilizer HALTS1 (Neklesa et al., 2013), the expression of some stress genes is reduced compared with control conditions, effectively increasing the dynamic range of the Golgi stress transcriptional response and further highlighting the relationship between GA-HT2 stability and stress gene expression levels (Supplemental Figure S2D).
FIGURE 2:

Destabilization of GA-HT2 induces a specific Golgi stress response. (A) qPCR of Golgi stress genes in HEK293 cells treated for 12 h with HyT36 in the absence or presence of doxycycline or with nigericin or xyloside in the absence of doxycycline. Fold up-regulation over DMSO control is shown. Data represent mean ± SEM (n = 2). *, p < 0.05; **, p < 0.01; ***, p < 0.001 (t test). (B) qPCR time course of selected Golgi and ER stress genes after treatment with HyT36 for 2, 12, and 24 h in HEK293 cells. Fold up-regulation with HyT36 over HyT36(-Cl) is shown. Data represent mean ± SEM (n = 2). (C) Venn diagram summarizing the overlap of genes significantly affected by a 12-h treatment with HyT36, nigericin, or xyloside. Significant genes were counted as those with an experimental log ratio of at least 0.5 and a maximum false-discovery rate of 0.06. (D) Correlation plots of significant genes identified by HyT36 treatment compared with their fold change induced by nigericin or xyloside.
To explore the relationship between the transcriptional response to HT2 unfolding in the Golgi and the unfolded protein response in the ER, we generated an analogous dox-inducible ER-HT2 cell line using a signal sequence derived from calreticulin and a C-terminal KDEL sequence, akin to the constitutive ER-HT2–expressing cell line used previously (Raina et al., 2014). Having established the GA- and ER-HT2 cell lines, we compared the kinetics of up-regulation of several Golgi and ER stress genes by qPCR after HyT36 treatment. Remarkably, the analyzed Golgi stress genes (WIPI49, FUT1, PCSK1, and STX3A) were activated only in the GA-HT2 cell line, peaking at around 12 h. These results suggest that this transcriptional response to protein misfolding–related stress is a unique response of the Golgi apparatus (Figure 2B). Furthermore, the GA-HT2 cell line shows only minimal up-regulation of the ER stress genes CHOP and ERDJ4 at their peak activation time of 2 h, as compared with the ER-HT2 line, thus emphasizing the specificity of the GA-HT2 system toward Golgi stress. Interestingly, we observed a slight up-regulation of ER stress genes in the GA-HT2 line at 12 h, suggesting possible cross-talk between the two stress responses. In summary, hydrophobic tagging of a Golgi-localized HT2 protein allowed us to uncover a unique and specific response to protein unfolding in the Golgi apparatus.
RNA sequencing was performed to enable a broader understanding of how the Golgi stressors nigericin, xyloside, and HyT36-induced HT2 unfolding influence transcription (Supplemental Table S1). HyT36 treatment significantly affected 207 genes with an experimental log ratio threshold of 0.5, while nigericin affected 2743 genes and xyloside affected 4687 genes under the same constraints (Figure 2C). HyT36 treatment affects the smallest subset of target genes, reinforcing that it is a more specific stressor than either nigericin or xyloside. We examined the similarity between HyT36 and the other stressors by comparing the fold change of the 207 genes affected by HyT36 to their fold change under nigericin or xyloside treatment. While there was no obvious relationship with xyloside, HyT36 exhibited a strong correlation with nigericin (Figure 2D). Notably, the slope of the correlation is close to 1, suggesting that HyT36 acts just as potently as nigericin in terms of inducing Golgi stress. This observation further suggests a mechanistic similarity between the types of Golgi stress induced by the two treatments. It is possible that at least one of the effects of nigericin on the Golgi is to induce protein destabilization, given its impact on the pH of the Golgi lumen and on protein transport bulk flow (Dinter and Berger, 1998). Conversely, there is no correlation between GA-HT2 destabilization and xyloside treatment, suggesting that xyloside may be inducing a different type of Golgi stress compared with that resulting from HyT36-induced protein destabilization and nigericin treatment.
The RNA-sequencing data sets provide insight into the effects of the small-molecule stressors on cells. To this end, a Gene Ontology term analysis underscored the specificity of the GA-HT2/HyT36 system to the Golgi apparatus. Categorizing the genes significantly affected by the three stressors revealed an enrichment of Golgi-associated genes in the HyT36 data set. In contrast, nigericin and xyloside both appeared to have broad cellular effects (Table 1). Together, these data show that HyT36-induced unfolding of GA-HT2 produces a transcriptional Golgi-specific stress signature that is similar to a part of the cellular effect of nigericin.
TABLE 1:
Gene Ontology cellular compartment analysis of significant genes from RNA sequencing (top 25).
| HyT36 | Nigericin | Xyloside | |||||||
|---|---|---|---|---|---|---|---|---|---|
| Rank | Term ID | Term | logP | Term ID | Term | logP | Term ID | Term | logP |
| 1 | GO:0005794 | Golgi apparatus | −7.27 | GO:0044424 | Intracellular part | −94.92 | GO:0005622 | Intracellular | −122.98 |
| 2 | GO:0012505 | Endomembrane system | −6.92 | GO:0005622 | Intracellular | −91.58 | GO:0044424 | Intracellular part | −119.21 |
| 3 | GO:0044420 | Extracellular matrix part | −6.70 | GO:0043229 | Intracellular organelle | −65.17 | GO:0043229 | Intracellular organelle | −87.34 |
| 4 | GO:0005719 | Nuclear euchromatin | −6.69 | GO:0043226 | Organelle | −59.93 | GO:0043226 | Organelle | −83.98 |
| 5 | GO:0005581 | Collagen trimer | −6.35 | GO:0043231 | Intracel. membrane-bd. orgl. | −57.98 | GO:0043227 | Membrane-bd. orgl. | −78.50 |
| 6 | GO:0005604 | Basement membrane | −6.25 | GO:0043227 | Membrane-bd. orgl. | −53.23 | GO:0043231 | Intracel. membrane-bd. orgl. | −78.05 |
| 7 | GO:0000791 | Euchromatin | −6.19 | GO:0005737 | Cytoplasm | −43.40 | GO:0005737 | Cytoplasm | −67.65 |
| 8 | GO:0030127 | COPII vesicle coat | −5.72 | GO:0044444 | Cytoplasmic part | −39.09 | GO:0044446 | Intracellular organelle part | −40.63 |
| 9 | GO:0043227 | Membrane-bd. orgl. | −5.32 | GO:0044446 | Intracellular organelle part | −36.24 | GO:0044444 | Cytoplasmic part | −40.24 |
| 10 | GO:0032587 | Ruffle membrane | −5.31 | GO:0044422 | Organelle part | −34.27 | GO:0044422 | Organelle part | −38.25 |
| 11 | GO:0005578 | Proteinaceous ECM | −5.29 | GO:0005829 | Cytosol | −33.08 | GO:0044464 | Cell part | −38.00 |
| 12 | GO:0044424 | Intracellular part | −5.25 | GO:0044464 | Cell part | −28.90 | GO:0005623 | Cell | −37.80 |
| 13 | GO:0005783 | Endoplasmic reticulum | −5.10 | GO:0005623 | Cell | −28.78 | GO:0005634 | Nucleus | −34.62 |
| 14 | GO:0005622 | Intracellular | −4.66 | GO:0031981 | Nuclear lumen | −22.50 | GO:0070013 | Intracellular organelle lumen | −23.45 |
| 15 | GO:0005595 | Collagen type XII trimer | −4.62 | GO:0005634 | Nucleus | −22.14 | GO:0044428 | Muclear part | −22.75 |
| 16 | GO:0005585 | Collagen type II trimer | −4.62 | GO:0070013 | Intracellular organelle lumen | −22.01 | GO:0043233 | Organelle lumen | −21.68 |
| 17 | GO:0043231 | Intracel. membrane-bd. orgl. | −4.44 | GO:0031974 | Membrane-enclosed lumen | −21.35 | GO:0005856 | Cytoskeleton | −21.39 |
| 18 | GO:0043226 | Organelle | −4.32 | GO:0043233 | Organelle lumen | −20.85 | GO:0031974 | Membrane-enclosed lumen | −21.09 |
| 19 | GO:0031012 | Extracellular matrix | −4.16 | GO:0044428 | Nuclear part | −18.23 | GO:0005912 | Adherens junction | −19.99 |
| 20 | GO:0048770 | Pigment granule | −4.15 | GO:0043228 | Nonmembrane-bd. orgl. | −16.27 | GO:0043228 | Nonmembrane-bd. orgl. | −19.65 |
| 21 | GO:0042470 | Melanosome | −4.15 | GO:0043232 | Intracel. nonmbr-bd. orgl. | −16.27 | GO:0043232 | Intracel. nonmbr-bd. orgl. | −19.65 |
| 22 | GO:0044431 | Golgi apparatus part | −3.93 | GO:0005654 | Nucleoplasm | −15.29 | GO:0012505 | Endomembrane system | −18.94 |
| 23 | GO:0005615 | Extracellular space | −3.83 | GO:0015630 | Microtubule cytoskeleton | −14.40 | GO:0031981 | Nuclear lumen | −18.92 |
| 24 | GO:0000139 | Golgi membrane | −3.71 | GO:0031090 | Organelle membrane | −12.73 | GO:0005829 | Cytosol | −18.55 |
| 25 | GO:0030662 | Coated vesicle membrane | −3.65 | GO:0005815 | Microtubule organizing center | −12.21 | GO:0070161 | Anchoring junction | −16.68 |
Identification of novel genes essential for Golgi structural integrity
Many of the genes that are induced in response to HyT36 treatment, such as GOLGA5, GOLGB1, GCP60 (ACBD3), and GM130 (GOLGA2), are highly Golgi specific and are involved in maintaining Golgi homeostasis during stress (Diao et al., 2003; Satoh et al., 2003; Barinaga-Rementeria Ramirez and Lowe, 2009). Therefore, we reasoned that the previously uncharacterized genes identified as being up-regulated by the GA-HT2/HyT36 system may also play a role in maintaining Golgi structural integrity. Of particular interest were genes predicted to be part of the secretory system, which may be directly involved in structural maintenance, as well as potential transcriptional regulators of the stress response. We confirmed by qPCR that HyT36 and nigericin induce the up-regulation of the previously uncharacterized genes FAM174B, LYSMD3, ZNF501, and ZNF643 in GA-HT2 HEK293 cells (Supplemental Figure S3A). To assess changes in protein levels, we performed Western blot analysis. Changes induced by HyT36 treatment are too small to be consistently detected; however, nigericin treatment increases overall levels of LYSMD3 in HEK293 cells, and this trend is also observed in HeLa cells (Supplemental Figure S3B). Moreover, nigericin treatment shifts the LYSMD3 band from a higher-molecular-weight form to a band that corresponds to the size of the unmodified protein, suggesting a defect in secretory pathway function. Notably, in HEK293 cells, expression of GA-HT2 by doxycycline treatment also increases the levels of LYSMD3.
We next examined the effect of lentiviral short hairpin RNA (shRNA) knockdown of FAM174B, LYSMD3, ZNF501, and ZNF643 on Golgi morphology and function. Knockdown of the targeted genes was confirmed by qPCR (and a Western blot for LYSMD3) in HEK293 and HeLa cell lines following viral transduction, although FAM174B and ZNF501 mRNA were undetectable in HeLa cells (Supplemental Figure S3C). Indeed, knockdown of these selected genes resulted in major changes in Golgi structure, both in HEK293 and HeLa cell lines (Figure 3A and Supplemental Figure S4A). Using giantin immunofluorescence to visualize the Golgi, we observed significantly more fragmentation in shRNA-expressing cells than in non-hairpin shRNA control cells. To quantify this morphological change, we determined the Golgi compactness index from projections of z-stack images as previously described (Figure 3B) (Bard et al., 2003). Ultrastructural changes in Golgi morphology were further monitored by electron microscopy (EM) (Supplemental Figure S4, B and C). The high-resolution images show that the Golgi cisternae are enlarged and swollen in the knockdown cell lines. To evaluate whether the observed Golgi disruption affects protein transport along the secretory pathway, we monitored secretion of the model substrate HRP (ssHRP). These experiments revealed that knockdown of LYSMD3 reduces secretion in HeLa cells (Figure 3C). Additionally, knockdown of ZNF501 reduces secretion in HEK293 cells (Supplemental Figure S4D), a trend that is also observed in HeLa cells (Figure 3C).
FIGURE 3:

Novel Golgi stress genes are involved in Golgi integrity and secretion. (A) Representative giantin immunofluorescence images of HeLa cells expressing the indicated shRNAs (maximum projections of z-stacks; scale bar: 10 µm). (B) Quantitation of Golgi fragmentation depicted in A. Non-hairpin: 16 cells; shLYSMD3 #1: 13 cells; #2: 16 cells; shFAM174B #1: 20 cells; #2: 21 cells; shZNF501: 14 cells; shZNF643: 13 cells; all data represent mean ± SEM. ***, p < 0.001, ****, p < 0.0001 (one-way analysis of variance [ANOVA] with Tukey’s multiple comparison). (C) Secretion of ssHRP over time in HeLa cells expressing the indicated shRNAs as measured by an HRP assay. Treatment with 2 µM nigericin was carried out 3 h before beginning the measurements. Data represent mean ± SEM (n = 2). *, p < 0.05; ***, p < 0.001; ****, p < 0.0001 (one-way ANOVA with Sidak’s multiple comparison). (D) Nigericin dose response measuring cell viability by CellTiter-Glo 17 h after treatment of HeLa cells expressing the indicated shRNAs. (E) Confocal microscopy images showing the localization of the indicated RFP fusion proteins (magenta) in HeLa cells expressing GA-HT2 (green). Nuclei are visualized with DAPI (blue). Top row shows low expression level and bottom row high expression level of the RFP fusion proteins (maximum projections of z-stacks; scale bar: 10 µm).
The stable shRNA cell lines could be cultured for multiple passages, despite disruption of the organelle and reduced protein transport capacity. To test whether knockdown of the newly identified Golgi stress genes would sensitize cells to treatment with nigericin, we carried out cell viability assays (Figure 3D). The knockdown cell lines did not show reduced viability in the presence of nigericin compared with the non-hairpin control cell line, suggesting that deletion of these individual Golgi stress-response genes is not sufficient to sensitize cells to nigericin or that the cytotoxic effect of the ionophore is not related to Golgi stress.
In silico analysis of LYSMD3 and FAM174B predicts that both proteins contain a transmembrane domain and that the latter additionally harbors an N-terminal signal sequence for cotranslational import into the ER (Figure 3E). We determined their subcellular localization by expression of red fluorescent protein (RFP) fusion constructs in HeLa cells (Figure 3E). RFP-LYSMD3 was primarily found at the Golgi apparatus and occasionally at the plasma membrane, depending on its expression level. FAM174B-RFP localized to the Golgi, to the plasma membrane, and to punctate structures distributed throughout the cytoplasm, pointing to a possible role in vesicular transport. Moreover, we found the two zinc-finger proteins ZNF501 and ZNF643 to be localized to the nucleus, with ZNF501 enriched in nucleoli, where it could potentially be involved in transcriptional regulation (Supplemental Figure S4E). These data show that our Golgi-specific stress system is a powerful tool that enables identification of new genes with essential roles in regulating Golgi organization.
Novel insight into a Golgi-specific transcriptional stress response
In this study, we used an induced protein-unfolding system to specifically target the Golgi apparatus (Figure 4). We found that destabilization of GA-HT2 induced up-regulation of a set of Golgi-related genes whose expression is affected with similar kinetics by other stress inducers that affect the Golgi, such as nigericin and xyloside (Oku et al., 2011; Taniguchi et al., 2015). Importantly, these genes were not affected by HT2 destabilization in the ER, highlighting the ability of the Golgi to respond to protein-folding stress independently and indicating the presence of a Golgi-specific unfolded-protein response. The difference in kinetics between the ER and Golgi stress response appears to be a common characteristic of different types of ER and Golgi stressors. While thapsigargin, tunicamycin, and the ER-HT2 protein-unfolding system induce a response that peaks at ∼2–4 h posttreatment, the transcriptional response to nigericin, monensin, and the GA-HT2 protein-unfolding system is detectable at later time points (∼8–24 h) (Yoshida et al., 2001; Oku et al., 2011; Raina et al., 2014; Baumann et al., 2017). For detailed studies on Golgi stress kinetics, it will be important to identify the direct molecular signal(s) that are sensed during Golgi stress and serve as the starting point for initiating the transcriptional response. This will support defining the threshold of stress that warrants activation of the transcriptional response. The lag phase of the Golgi transcriptional stress response could be inherent to the yet-to-be-identified stress-signaling cascade, or it could relate to initial buffering of the stress by nontranscriptional aspects of the Golgi stress response. Another difference between the Golgi and ER stress responses is the generally smaller transcriptional change of genes during Golgi stress. At this point, we can only speculate about the mechanistic basis of this phenomenon, but it may reflect the nature of the Golgi, which has a smaller volume than the ER, or the nature of the transcriptional response being a late-stage cellular response to Golgi stress.
FIGURE 4:
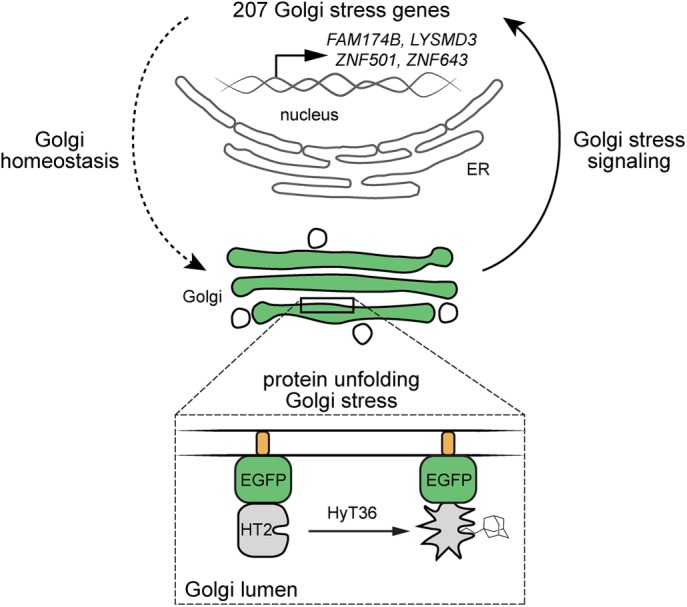
Model of Golgi stress induction. Expression of GA-HT2 and subsequent unfolding of the protein by conjugation of the hydrophobic tag HyT36 induces Golgi-specific stress. Up-regulation of Golgi stress genes, including FAM174B, LYSMD3, ZNF501, and ZNF643, is induced to restore homeostasis, illustrating a mechanism of Golgi autoregulation.
Transcriptome profiling by RNA sequencing of cells treated with the various stressors demonstrated that the GA-HT2 system affects genes associated specifically with the Golgi, while nigericin and xyloside induce broad changes. In addition to transcription, it will be important to characterize more proximal effects of Golgi stress. For instance, Src activation could alleviate Golgi stress through its control of intra-Golgi trafficking (Pulvirenti et al., 2008; Giannotta et al., 2012), or dephosphorylation of a Golgi structural protein like GRASP65 or GM130 could enhance Golgi stability (Nakamura et al., 1997; Wang et al., 2005). To this end, use of the GA-HT2 system will be especially effective, owing to the clarity provided by its reduced off-target effects relative to those of other Golgi stressors.
Previously characterized organelle-specific stress responses leverage many different strategies to restore homeostasis. So-called adaptive stress-response pathways regulate the capacity of the organelle in response to cellular needs. The ER stress response, for example, can affect ER structure and increase its capacity, increase export via ER-associated degradation or secretion, reduce import via translational down-regulation, and affect the folding capacity of the ER itself by specifically enhancing expression of protein chaperones (Hetz, 2012). The transcriptional response to Golgi stress reflects a number of potential adaptive strategies that the Golgi may use to restore homeostasis, such as by regulating vesicle-mediated transport, glycosylation, or Golgi structure. We further explored the roles of uncharacterized Golgi stress-responsive genes from our RNA-sequencing study and found that shRNA-mediated knockdown of FAM174B, LYSMD3, ZNF501, or ZNF643 led to disrupted Golgi morphology, implicating them in Golgi structural regulation. The observed Golgi disruption phenotype resembles that seen in different disease states, such as in specific types of cancers (Kellokumpu et al., 2002; Baschieri et al., 2014, 2015; Petrosyan et al., 2014). Exploring the regulation of the identified Golgi stress genes, specifically of FAM174B, LYSMD3, ZNF501, and ZNF643, in these contexts will help to further characterize the relationship between Golgi integrity and disease. Stress-response pathways are often part of the so-called nononcogenic addiction of cancer cells and have been used as the basis for development of therapeutics (Hetz et al., 2013). Accordingly, the Golgi-specific stress response could serve as a potential drug target.
Despite being sensed and inducing a transcriptional response, unfolded GA-HT2 remains at steady levels even after 48 h of destabilization, in contrast to unfolded HT2 in the cytosol or ER, which is degraded by the proteasome (Neklesa et al., 2011; Raina et al., 2014). This suggests that destabilized Golgi proteins may be subjected to a quality-control route that does not involve protein degradation, or perhaps the level of destabilization induced by hydrophobic tagging of HT2 is insufficient to warrant activation of Golgi-related degradation pathways. Linstedt and colleagues recently demonstrated that induced oligomerization of ectopically expressed Golgi proteins leads to lysosome-mediated degradation of the oligomer (Tewari et al., 2015). Thus, it is possible that the Golgi may respond differently to different degrees of protein-folding stress, with moderate protein destabilization inducing an acute stress that spares proteins from degradation and destabilization that is capable of producing aggregates inducing lysosome-mediated degradation. Our Golgi stress model is an important tool to further characterize the immediate response of the Golgi to unfolded proteins. Additionally, late-stage up-regulation of ER stress genes after hydrophobic tagging of GA-HT2 indicates that the Golgi might profit from aspects of the ER unfolded-protein response to maintain its own homeostasis.
Taken together, the developed Golgi stress model allowed us to uncover a Golgi-specific transcriptional stress response that comprises previously uncharacterized proteins involved in regulating Golgi structure. Their knockdown induces sustained Golgi disruption, and future work will focus on their roles during Golgi stress. This novel approach to induce a Golgi-specific stress is a valuable tool for the characterization of homeostasis mechanisms used by the Golgi apparatus and will be useful for future studies addressing the Golgi’s response to protein unfolding and Golgi-related protein quality-control pathways.
MATERIALS AND METHODS
Reagents
HyT36 was synthesized according to the procedure described previously (Tae et al., 2012). The synthesis of HyT36(-Cl) is described below. All other compounds were obtained from the following suppliers: nigericin (EMD Millipore), xyloside (Sigma), cycloheximide (Sigma), doxycycline (Sigma), HALTS1 (ChemBridge; #9074451), TMB-Plus Substrate-Chromogen (Agilent), zeocin (Invivogen), blasticidin (Invivogen), hygromycin (Thermo Fisher Scientific), puromycin (Invivogen). Antibodies: α-HA (Cell Signaling; 3724, 1:1000), α-tubulin (Sigma; T9026, 1:10,000), α-giantin (Abcam; ab24586, 1:1000), α-LYSMD3 (Proteintech; 24313-1-AP, 1:1000).
The shRNAs used in this study are shown in Table 2.
TABLE 2:
shRNAs used.
| Gene | Target sequence | TRC no. |
|---|---|---|
| Non-hairpin | CCGCAGGTATGCACGCGT | n/a |
| LYSMD3#1 | ATTCGTTACATAGGCTATATA | TRCN0000253829 |
| LYSMD3#2 | GAACCTCAATGAGGTAGTATC | TRCN0000253830 |
| FAM174B#1 | CCACAGTATTCGACATCAAAT | TRCN0000116173 |
| FAM174B#2 | CACAGTATTCGACATCAAATA | TRCN0000116174 |
| ZNF501 | CCCTGACATTAACTGAATAAA | TRCN0000107850 |
| ZNF643 | GCCAGAGAATACATCTTTCTA | TRCN0000016540 |
Cell culture and generation of stable cell lines
HEK293 Flp-In T-REx cells (Thermo Fisher Scientific), HeLa Flp-In T-Rex cells (gift from Stephen Taylor, University of Manchester), and HEK293T cells were cultured in DMEM (Thermo Fisher Scientific) supplemented with 10% fetal bovine serum (FBS; Thermo Fisher Scientific), 100 U/ml penicillin and 100 μg/ml streptomycin (Thermo Fisher Scientific), at 37°C and 5% CO2. Cell lines are periodically tested for mycoplasma contamination.
Stable cell lines containing a doxycycline-inducible HT2-fusion protein were generated using the Flp-In T-REx system (Thermo Fisher Scientific) according to the manufacturer’s protocol. Parental HEK293 Flp-In T-REx and HeLa Flp-In T-REx cells were cultured in 100 µg/ml zeocin and 15 µg/ml blasticidin, and 50 µg/ml zeocin and 4 µg/ml blasticidin, respectively. Stable cyto-HT2, ER-HT2 or GA-HT2 HEK293 and HeLa cells were selected and cultured in 100 µg/ml hygromycin and 15 µg/ml blasticidin, and 200 µg/ml hygromycin and 4 µg/ml blasticidin, respectively. Subclones were selected by isolating individual foci from 15-cm dishes.
shRNA knockdown cell lines were generated using a lentiviral system. Virus was generated in HEK293T cells by transfecting the pLKO, packaging (psPAX2), and envelope (pMD2) plasmids in a 10:10:1 ratio. Media were replenished after 12 h, and viral media were collected 48 h posttransfection and immediately transferred onto GA-HT2 HEK293 or HeLa cells in the presence of polybrene (Sigma). After 24–48 h, transduced HEK293 and HeLa were selected with 1.5 and 1 µg/ml puromycin, respectively.
For experiments involving HT2 destabilization, cells were first treated with 100 ng/ml doxycycline (Sigma) for 16–24 h before treatment with 10 µM HyT36 or HyT36(-Cl) for indicated times in the presence of doxycycline. HALTS1 treatments were performed at 10 µM concurrently with doxycycline treatment. The 1 µM nigericin (EMD Millipore) and 4 mM xyloside (Sigma) treatments were performed in the absence of doxycycline for the indicated times. Cotreatments with 20 µg/ml cycloheximide (Sigma) were performed for the final 8 h of the treatments described above. DNA transfections were performed using Lipofectamine 2000 Transfection Reagent (Thermo Fisher Scientific) according to the manufacturer’s protocol. For transient transfection of RFP fusion proteins, 200 ng DNA per well of a six-well plate was used.
Cloning
The GA-HT2 construct was created with the USER cloning strategy (Nour-Eldin et al., 2010). Briefly, the DNA fragments of interest were PCR amplified with uracil-containing primers using PfuTurbo Cx Hotstart DNA Polymerase (Agilent Technologies) according to the manufacturer’s protocol. Purified fragments were combined in a three-part assembly reaction using the USER Enzyme and DpnI (New England Biolabs). The fragments included the first 61 amino acids from B4GALT1 corresponding to its transmembrane domain, HA-EGFP-HT2 hemagglutinin-tag enhanced green fluorescent protein obtained from previously described constructs (Neklesa et al., 2011; Raina et al., 2014), and pcDNA5/FRT/TO (Thermo Fisher Scientific). For the described construct, the HA-EGFP-HT2 moiety faces the Golgi lumen. All other constructs were prepared with restriction enzyme–based cloning. Luciferase-HT2 (firefly luciferase-HA-HT2) was cloned from a previously described construct (Neklesa et al., 2011) into pET21a. ER-HT2 (Calreticulin(SS)-HA-EGFP-HT2-KDEL) and cyto-HT2 (HA-EGFP-HT2) were cloned from previously described constructs into pcDNA5/FRT/TO (Neklesa et al., 2011; Raina et al., 2014). These constructs are expressed as soluble proteins in the ER and the cytosol, respectively. FAM174B, LYSMD3, ZNF501, and ZNF643 were cloned from HEK293 cDNA. RNA was extracted as described in the section RNA extraction and qPCR, and cDNA was prepared with the Agilent AffinityScript cDNA Synthesis Kit according the manufacturer’s instructions. Obtained PCR products were digested and ligated into pcDNA3 already containing FLAG-mRFP or mRFP-FLAG in front of or after the multiple cloning site for generating C-terminal and N-terminal fusion proteins, respectively. A plasmid containing the signal sequence of HGH1 fused to horseradish peroxidase (HRP), referred to as ssHRP, was a gift from the Rothman lab, Yale University (Connolly et al., 1994).
Cell viability determination using CellTiter-Glo
HeLa cells were plated at a density of 750 cells/well in a 384-well plate. The following day, cells were treated by addition of 6× stocks of nigericin in culture medium to reach the final concentrations indicated in Figure 3D. After 17 h of incubation, cell viability was measured using the CellTiter-Glo Luminescent Cell Viability Assay (Promega; G7572) according to the manufacturer’s instructions.
HRP secretion assay
Cells were transiently transfected with the ssHRP plasmid. After 24–48 h of transfection and appropriate treatment, cells were washed twice with culture media. Subsequently, aliquots of media (80 μl from 2 ml) were collected at 0, 1, and 2 h postwash. After the last time point, cells were washed twice in phosphate-buffered saline (PBS) and lysed in 50 mM Tris (pH 8.0), 150 mM NaCl, 1% NP-40, and 1× Roche EDTA-free Complete Protease Inhibitor Cocktail. Media and lysate samples were cleared by centrifugation at 500 × g for 5 min. Fifteen microliters of each sample was mixed with 30 μl of TMB reagent and incubated for 15–60 min. The reaction was stopped by adding 30 μl 1 N H2SO4, and absorbance at 450 nm was measured on a Wallac Victor 2 Plate Reader (Perkin Elmer). For data analysis, the levels of ssHRP detected in the media were subtracted from the level at 0 h and then normalized to the level of ssHRP detected in the cell lysate.
Protein expression and purification
Luciferase-HT2 in pET21a was overexpressed in BL21(DE3) cells. Protein expression was induced with 250 μM isopropylβ-d-1-thiogalactopyranoside for 5 h at 25°C. Cells were harvested by centrifugation, resuspended in lysis buffer containing 50 mM Na2HPO4 (pH 8.0), 300 mM NaCl, and lysed by sonication. Cleared cell lysate was incubated with NiNTA agarose beads (Qiagen). After 60 min of incubation, the beads were washed by applying a stepwise imidazole gradient and the luciferase-HT2 protein was finally eluted using 150 mM imidazole in lysis buffer. Subsequently, the protein was subjected to size-exclusion chromatography using a Superdex 200 column (GE Healthcare) equilibrated with 50 mM HEPES (pH 7.5), 150 mM NaCl.
In vitro luciferase assays
For luciferase assays, 1 µM luciferase-HT2-His6 was incubated with 10 µM HyT36, HyT36(-Cl), or dimethyl sulfoxide (DMSO) for 30 min at room temperature. Reactions were transferred to a 96-well plate, and luciferase activity was measured on a Wallac Victor 2 Plate Reader (Perkin Elmer). A reaction mix of 1 mM d-luciferin, 1 mM ATP, 50 µM CoA in 20 mM potassium phosphate (pH 7.8), 15 mM MgSO4, 4 mM ethylene-bis(oxyethylenenitrilo)tetraacetic acid, and 1 mM dithiothreitol was added to each well, and luminescence was measured. Reactions were performed in triplicate, and data were normalized to DMSO control.
Cell counting
Cultured cells were trypsinized and resuspended in DMEM. Cell counting was done using a Bio-Rad TC20 automated cell counter according to the manufacturer’s protocol.
Confocal microscopy and image analysis
For microscopy experiments cells were grown on coverslips and, after the indicated treatment, fixed in 4% paraformaldehyde in PBS. For giantin immunofluorescence, cells were permeabilized, and blocked in 10% FBS in PBS + 0.01% Triton X-100, incubated with α-giantin primary antibody diluted in 3% BSA in PBS + 0.01% Triton X-100 for 60 min at room temperature and α-rabbit secondary antibody conjugated to Alexa Fluor 633 (Thermo Fisher) diluted 1:500 in 3% BSA in PBS + 0.01% Triton X-100 for 60 min at room temperature. Coverslips were mounted on microscopy slides in Vectashield mounting medium (Vector Laboratories). Images were acquired on a Zeiss LSM 880. Z-stacks (1-µm slices) spanning the entire volume of the cells were recorded with oil-immersion 40× and 63× Plan-Apochromat lenses, 1.3 and 1.4 NA, respectively. Images were processed using Fiji (Schindelin et al., 2012).
Electron microscopy
Cultured cells were fixed in 2.5% glutaraldehyde in 0.1 M sodium cacodylate buffer (pH 7.4) at room temperature for 1 h, and then they were scraped off and pelleted in 2% agar. Cells were further postfixed in 1% OsO4 at room temperature for 30 min, followed by another 30 min in 1% tannic acid solution. They were stained en bloc with 2% aqueous uranyl acetate for 15 min, dehydrated in a graded series of ethanol to 100%, propylene oxide, and embedded in EMbed 812 resin (Electron Microscopy Sciences). Blocks were polymerized at 60°C for 24 h. Thin sections (60 nm) were cut by a Leica ultramicrotome and poststained with 2% uranyl acetate and lead citrate. Sample sections were examined in a Tecnai Biotwin transmission electron microscope (FEI) at 80 kV of the accelerating voltage; digital images were acquired by an Olympus Morada CCD camera and iTEM imaging software. EM experiments were performed by the Center for Cellular and Molecular Imaging at Yale University.
Preparation of cell lysates and Western blotting
Cultured cells were washed with PBS (Thermo Fisher Scientific) and resuspended in RIPA lysis buffer (50 mM Tris, pH 7.5, 150 mM NaCl, 1% NP-40, 0.1% SDS, 0.5% sodium deoxycholate, 1 mM EDTA, 1× Roche EDTA-free Complete Protease Inhibitor Cocktail). Protein concentrations were determined by bicinchoninic acid (BCA) assay (Thermo Fisher Scientific), and 20–60 μg total protein per sample was loaded on an SDS–PAGE gel. Western blotting followed using standard protocols.
Limited proteolysis of cell lysates
Cultured cells, treated with DMSO, HyT36, or HyT36(-Cl) for 12 h, were washed with PBS and lysed in 50 mM Tris (pH 7.5), 150 mM NaCl, 1 mM EDTA, 0.1% NP-40. The soluble fraction of the cell lysate was diluted to 2 mg/ml as determined by a BCA assay (Thermo Fisher Scientific). Upon addition of the indicated amount of trypsin (Sigma), reactions were incubated for 5 min on ice. Reactions were stopped by adding SDS–PAGE sample buffer and boiling. Samples were resolved on SDS–PAGE gels and analyzed by Western blotting.
Flow cytometry
Cultured cells were trypsinized and resuspended in DMEM to ∼1 × 10⁶ cells/ml. Cellular GFP fluorescence was measured on a BD FACSCalibur (BD Biosciences). Data were analyzed using BD CellQuest Pro software.
RNA extraction and qPCR
Cultured cells were resuspended in Trizol (Thermo Fisher Scientific) for RNA extraction (0.5 ml Trizol for 12-well plate or 1 ml Trizol for six-well plate). One part chloroform was added to five parts Trizol and samples were vortexed and spun at 12,000 × g for 15 min at 4°C. The top phase was recovered, and one part was mixed with 1–1.5 parts isopropanol. After a 10-min incubation, samples were spun at 12,000 × g for 10 min at 4°C. The supernatant was decanted, and the pellet was washed twice with 75% ethanol. RNA pellets were dried and resuspended in nuclease-free water. cDNA was synthesized using the High Capacity cDNA Reverse Transcription Kit (Thermo Fisher Scientific). Real-time qPCR was performed using FastStart Universal SYBR Green Master (ROX) (Roche) on a LightCycler 480 II (Roche), with 40 cycles of 15 s at 95°C and 45 s at 60°C. Transcripts were normalized to the housekeeping gene ACTB, and all measurements were performed in duplicate. For primer sequences, see Table 3. Data were analyzed with LightCycler 480 software and statistics were calculated with Prism (GraphPad).
TABLE 3:
Primers used for qPCR.
| Gene | Forward primer | Reverse primer |
|---|---|---|
| ACTB | GAGAAGAGCTACGAGCTGCCTGAC | ACTGTGTTGGCGTACAGGTCTTTG |
| PCSK1 | GGACCTCTGAGTATGACCCG | AGCTTTGGCATTTAGCAAGCC |
| STX3A | TCGGCAGACCTTCGGATTC | TCCTCATCGGTTGTCTTTTTGC |
| GM130 | ACGCCCTCAGGCTGGAGTTA | GAAGCAGGAGTTCCGTCATCTCTA |
| GOLGB1 | CACTCAGGAGCAGGCACTGTTA | CAGGACTCGCTTCCATCCAA |
| WIPI49 | AGTCAGTCACACAAAACCACG | AGAGCACATAGACCTGTTGGG |
| FUT1 | TGGACTGTCTACCCCAATGG | CAGGGTGATGCGGAATACCG |
| GCP60 | AGCGTGCATGTCAGTGAGTCC | GGCACAATCTCATCCAGCAAAG |
| UAP1L1 | CCAACGTGGTCATGTTTGAGC | GGATGTTGTCCACACAGTACAC |
| SIAT4A | GGAGGACGACACCTACCGAT | CCACCGACCTCTTCTCCAG |
| LYSMD3 | ATGAGGTAGTATCGGCCTTAACA | GTCTGCTCCATAATAGGGGTCT |
| FAM174B | CCTTGGTGACCCGCATTTC | GTAAAGGCGAACGCCACGA |
| ZNF501 | AACTTTCCGCAAACAAGCACA | TCCCACATCCAACACACTCATA |
| ZNF643 | GCAGCATGTATTCCACCTTGG | CCCCTTACCCATTCTTTGGTTC |
| CHOP | GAACGGCTCAAGCAGGAAATC | TTCACCATTCGGTCAATCAGAG |
| ERDJ4 | TGGTGGTTCCAGTAGACAAAGG | CTTCGTTGAGTGACAGTCCTGC |
RNA sequencing and data analysis
Cells were treated for 12 h in biological duplicate with DMSO and 10 µM HyT36 in the presence of 100 ng/ml doxycycline, and with DMSO, 10 µM HyT36, 1 µM nigericin, or 4 mM xyloside in the absence of doxycycline at 37°C. Cells were harvested, and RNA was extracted using the RNeasy Mini Kit (Qiagen) according to the manufacturer’s instructions. Total RNA was quantified using a NanoDrop (ND-1000).
Twelve strand-specific sequencing libraries, two replicates per condition, were produced from the total RNA. Total mRNA was purified from ∼500 ng of total RNA with Ribo-Zero and sheared by incubation at 94°C. cDNA libraries underwent 76–base pair single-end sequencing on an Illumina HiSeq 2500, according to Illumina protocols, generating between 22M and 31M reads per library. RNA sequencing was performed by the Yale Center for Genome Analysis.
The first six nucleotides and the last nucleotides with a quality score below 20 for each read were trimmed using in-house scripts. If, after trimming, the read was shorter than 45 base pairs, the whole read was discarded. Trimmed reads were mapped to the human reference genome (hg19) with a known transcriptome index (UCSC Known Gene annotation) using Tophat version 2.0.13 (Trapnell et al., 2009). Only the reads that mapped to a single unique location within the genome, with a maximum of two mismatches in the anchor region of the spliced alignment, were reported in these results. Tophat alignments were then processed by Cufflinks version 2.2.1 (Trapnell et al., 2010) to obtain differential gene expression. The HyT36 data set was further processed to control for off-target effects of HyT36. The fold changes of genes affected between DMSO and HyT36 in the presence of doxycycline were normalized to their fold changes in the absence of doxycycline, provided the changes in both comparisons had a false discovery rate–adjusted p value of less than 0.05. The adjusted list was subsequently processed in Ingenuity Pathway Analysis (Qiagen) in parallel to the comparisons between DMSO and nigericin or xyloside to generate the final data sets (Supplemental Table S1). Gene Ontology analysis was performed with HOMER version 4.7 (Heinz et al., 2010).
Statistical analysis and data reproducibility
Statistical tests and p values are described in the figure legends. Sample sizes were determined empirically to give reproducible conclusions between multiple independent experiments. Limited proteolysis was performed in technical duplicates. Flow cytometry was performed in biological duplicates. Cell counting was performed in biological triplicates, and statistics were calculated from the average of technical duplicates. qPCR experiments were performed in biological duplicates, and statistics were calculated from the average of technical duplicates.
Golgi compactness was quantified as previously described (Bard et al., 2003). Briefly, maximum projections of z-stacks were generated and background pixels were removed by setting the minimum threshold to 90 on a black-and-white image scale (0–250). A region of interest was drawn around the Golgi, and the area and perimeter of the Golgi particles contained was determined (minimum area of 3 pixels2). Compactness was calculated with the formula 4π{sum (areas)/[sum (perimeters)]2}. Statistics were calculated with Prism (GraphPad). Golgi compactness was calculated from at least 13 individual cells in a single experiment.
Experiments were reproduced multiple independent times. Specifically, colocalization between GA-HT2 and giantin was performed more than 10 times. Limited proteolysis was performed twice. Western blotting for GA-HT2 in response to HyT36 treatment was performed more than five times. qPCR analysis of Golgi stress genes was performed more than 10 times in HEK293 cells and twice in HeLa cells. Golgi- and ER-stress kinetic analysis by qPCR was performed twice. RNA sequencing was performed once. Giantin immunofluorescence in Golgi stress gene-knockdown cell lines was performed three times. ssHRP secretion in HeLa and HEK293 cell lines was performed once. The nigericin dose–response assay in HeLa cells was performed twice. In vitro luciferase assays were performed three times. Flow-cytometry experiments were performed more than 5 times in HEK293 cells and twice in HeLa cells. The HEK293 toxicity assay was performed twice. EM analysis of GA-HT2–expressing HeLa cells was performed twice. qPCR of HEK293 cells subjected to varying concentrations of doxycycline was performed twice. Analysis of LYSMD3 protein levels by Western blotting was performed twice. EM analysis of Golgi stress gene-knockdown cell lines was performed once. Imaging of RFP-fused Golgi stress genes was performed twice.
Data availability
RNA-sequencing data were deposited in the NCBI GEO database (GSE99490).
Synthesis of HyT36(-Cl)
Unless otherwise indicated, common reagents or materials were obtained from commercial sources and used without further purification. Tetrahydrofuran (THF) and dichloromethane (CH2Cl2) were dried by a PureSolv solvent-drying system. Flash column chromatography was performed using silica gel 60 (230–400 mesh). Analytical thin-layer chromatography was carried out on Merck silica gel plates with QF-254 indicator and visualized by UV or KMnO4. 1H and 13C NMR spectra (Figure 5) were recorded on an Agilent DD2 500 (500 MHz 1H; 125 MHz 13C) or Agilent DD2 600 (600 MHz 1H; 150 MHz 13C) or Agilent DD2 400 (400 MHz 1H; 100 MHz 13C) spectrometer at room temperature. Chemical shifts were reported in parts per million relative to the residual CDCl3 (δ 7.26 ppm 1H; δ 77.00 ppm 13C), CD3OD (δ 3.31 ppm 1H; δ 49.00 ppm 13C), or d6-DMSO (δ 2.50 ppm 1H; δ 39.52 ppm 13C). NMR chemical shifts were expressed in parts per million relative to internal solvent peaks, and coupling constants were measured in hertz (bs = broad signal). Mass spectra were obtained using electrospray ionization (ESI) on a time-of-flight mass spectrometer.
FIGURE 5:

NMR spectra.
Synthesis scheme of HyT36(-Cl)

tert-Butyl (2-(2-hydroxyethoxy)ethyl)carbamate (1).

To a solution of 2-(2-aminoethoxy)ethanol (4.74 ml, 47.56 mmol) in anhydrous THF (100 ml) was added BOC anhydride (10.38 g, 0.05 mol) at 0°C. After being stirred at room temperature for 2 h, the solvent was removed under reduced pressure. The product was dissolved in CH2Cl2 (100 ml), then water (100 ml) was added. The layers were separated and the aqueous phase was extracted with CH2Cl2 (2 × 100 ml). The combined organic layers were dried over Na2SO4, filtered, and evaporated under vacuum to obtain the product, 9.6 g (99%) of 1, which was used in the next step without further purification. NMR data are in accordance with the literature.
1H NMR (500 MHz, Chloroform-d) δ 5.07 (bs, 1H), 3.72 (d, J = 4.1 Hz, 2H), 3.55 (d, J = 16.3 Hz, 4H), 3.32 (s, 2H), 2.59 (s, 1H), 1.43 (s, 9H).
tert-Butyl (2-(2-(hexyloxy)ethoxy)ethyl)carbamate (2).
A solution of 1 (1.01 g, 4.9 mmol) and KOH (277.2 mg, 5.0 mmol) in DMSO (50 ml) and distilled water (5 ml) was stirred 15 min at room temperature. Then the mixture was cooled to 0°C, and 1-bromohexane (0.69 ml, 4.94 mmol) was added dropwise over 1 h. The resulting solution was stirred for 1 h at 0°C and then for 8 h at room temperature. After being diluted with ethyl acetate (250 ml) and water (250 ml), the aqueous phase was extracted with ethyl acetate (3 × 100 ml). The combined organic phases were washed with brine and dried over MgSO4 and filtered. After concentration, the crude material was subjected to column chromatography on silica gel (ethyl acetate:hexane [1:4]) to give 517 mg (36%) of 2 as a colorless oil. NMR data are in accordance with the literature.
1H NMR (500 MHz, Chloroform-d) δ 5.03 (s, 1H), 3.59 (dd, J = 6.4, 3.5 Hz, 2H), 3.56 – 3.49 (m, 4H), 3.44 (t, J = 6.8 Hz, 2H), 3.33 – 3.23 (m, 2H), 1.56 (dq, J = 13.2, 6.6 Hz, 2H), 1.42 (s, 9H), 1.37 – 1.22 (m, 6H), 0.87 (t, J = 6.8 Hz, 3H).
2-(2-(Hexyloxy)ethoxy)ethan-1-aminium 2,2,2-trifluoroacetate (3).
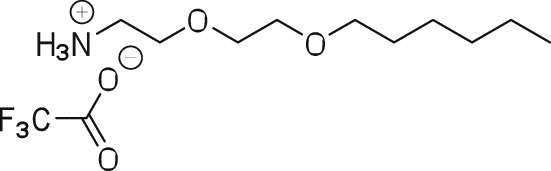
A solution of 2 (500 mg, 1.73 mmol) in TFA:CH2Cl2 (1:1) mixture was stirred at room temperature for 4 h. The solvent was evaporated to give 495 mg (100%) of 3 as a yellow oil that was carried to the next step without further purification or characterization.
(R)-4-((3R,5R,7R)-Adamantan-1-yl)-N-(2-(2-(hexyloxy)ethoxy)ethyl)-2-methylbutanamide (HyT36(-Cl)).
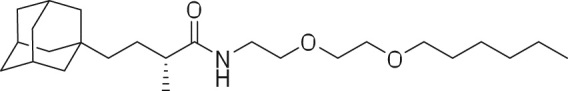
To a solution of 3 (15 mg, 0.06 mmol) in DMF (1 ml) was added HATU (1-[Bis(dimethylamino)methylene]-1H-1,2,3-triazolo[4,5-b]pyridinium 3-oxid hexafluorophosphate) (48.26 mg, 0.13 mmol), and the resulting solution was stirred for 10 min at room temperature, after which (2-(2-hexoxyethoxy)ethanamine (18.17 mg, 0.06 mmol) and DIPEA (0.05 ml, 0.32 mmol) were added, respectively. The resulting mixture was stirred at room temperature for 16 h. The product was extracted twice with ethyl acetate and water. Then the combined organic phases were concentrated and the residue purified by silica gel chromatography (ethyl acetate:hexane [1:4]) to give 21 mg (82%) of HyT36(-Cl).
1H NMR (500 MHz, Chloroform-d) δ 5.96 (bs, 1H), 3.64 – 3.58 (m, 2H), 3.55 (dd, J = 11.2, 5.5 Hz, 4H), 3.49 – 3.40 (m, 4H), 2.04 (q, J = 6.9 Hz, 1H), 1.91 (s, 3H), 1.67 (d, J = 12.0 Hz, 3H), 1.57 (dd, J = 15.7, 9.2 Hz, 6H), 1.43 (s, 6H), 1.36 – 1.23 (m, 7H), 1.11 (d, J = 6.8 Hz, 3H), 1.00 (dt, J = 10.6, 4.2 Hz, 2H), 0.87 (t, J = 6.7 Hz, 3H).
13C NMR (151 MHz, CDCl3) δ 176.64, 71.55, 70.27, 69.98, 69.93, 42.34, 42.25, 42.12, 38.91, 37.20, 32.06, 31.67, 29.60, 28.68, 27.25, 25.76, 22.60, 17.90, 14.03.
LC/MS (ESI); m/z [M+H]+ for C25H46NO3, Calculated. 408.6. Found. 408.2.
Supplementary Material
Acknowledgments
We thank Stephen Taylor for providing Flp-In T-REx HeLa cells and James Rothman and his lab members for helpful discussion. This work was supported by National Institutes of Health R35CA197589 and an EMBO Long-Term Fellowship to D.H. 1102-2014. Y.V.S. was supported in part by National Institutes of Health 5T32GM06754 3-12.
Abbreviations used:
- ANOVA
analysis of variance
- DAPI
4′,6-diamidino-2-phenylindole
- EM
electron microscopy
- ER
endoplasmic reticulum
- ESI
electrospray ionization
- FBS
fetal bovine serum
- HRP
horseradish peroxidase
- HT2
HaloTag2
- PBS
phosphate-buffered saline
- qPCR
quantitative PCR
- RFP
red fluorescent protein
- shRNA
short hairpin RNA
- ssHRP
secretory signal HRP
- THF
tetrahydrofuran.
Footnotes
This article was published online ahead of print in MBoC in Press (http://www.molbiolcell.org/cgi/doi/10.1091/mbc.E17-11-0693) on April 5, 2018.
REFERENCES
- Bard F, Mazelin L, Péchoux-Longin C, Malhotra V, Jurdic P. (2003). Src regulates Golgi structure and KDEL receptor-dependent retrograde transport to the endoplasmic reticulum. J Biol Chem , 46601–46606. [DOI] [PubMed] [Google Scholar]
- Barinaga-Rementeria Ramirez I, Lowe M. (2009). Golgins and GRASPs: holding the Golgi together. Semin Cell Dev Biol , 770–779. [DOI] [PubMed] [Google Scholar]
- Baschieri F, Confalonieri S, Bertalot G, Di Fiore PP, Dietmaier W, Leist M, Crespo P, Macara IG, Farhan H. (2014). Spatial control of Cdc42 signalling by a GM130-RasGRF complex regulates polarity and tumorigenesis. Nat Commun , 4839. [DOI] [PMC free article] [PubMed] [Google Scholar]
- Baschieri F, Uetz-von Allmen E, Legler DF, Farhan H. (2015). Loss of GM130 in breast cancer cells and its effects on cell migration, invasion and polarity. Cell Cycle , 1139–1147. [DOI] [PMC free article] [PubMed] [Google Scholar]
- Baumann J, Ignashkova TI, Chirasani SR, Ramírez-Peinado S, Alborzinia H, Gendarme M, Kuhnigk K, Kramer V, Lindemann RK, Reiling JH. (2017). Golgi stress-induced transcriptional changes mediated by MAPK signaling and three ETS transcription factors regulate MCL1 splicing. Mol Biol Cell , 42–52. [DOI] [PMC free article] [PubMed] [Google Scholar]
- Bejarano E, Cabrera M, Vega L, Hidalgo J, Velasco A. (2006). Golgi structural stability and biogenesis depend on associated PKA activity. J Cell Sci , 3764–3775. [DOI] [PubMed] [Google Scholar]
- Bexiga MG, Simpson JC. (2013). Human diseases associated with form and function of the Golgi complex. Int J Mol Sci , 18670–18681. [DOI] [PMC free article] [PubMed] [Google Scholar]
- Bierring F. (1962). Electron microscopic observations on the mucus production in human and rat intestinal goblet cells. Acta Pathol Microbiol Scand , 241–252. [DOI] [PubMed] [Google Scholar]
- Brandizzi F, Barlowe C. (2013). Organization of the ER-Golgi interface for membrane traffic control. Nat Rev Mol Cell Biol , 382–392. [DOI] [PMC free article] [PubMed] [Google Scholar]
- Cabrera M, Muñiz M, Hidalgo J, Vega L, Martín ME, Velasco A. (2003). The retrieval function of the KDEL receptor requires PKA phosphorylation of its C-terminus. Mol Biol Cell , 4114–4125. [DOI] [PMC free article] [PubMed] [Google Scholar]
- Connolly CN, Futter CE, Gibson A, Hopkins CR, Cutler DF. (1994). Transport into and out of the Golgi complex studied by transfecting cells with cDNAs encoding horseradish peroxidase. J Cell Biol , 641–652. [DOI] [PMC free article] [PubMed] [Google Scholar]
- Corda D, Barretta ML, Cervigni RI, Colanzi A. (2012). Golgi complex fragmentation in G2/M transition: an organelle-based cell-cycle checkpoint. IUBMB Life , 661–670. [DOI] [PubMed] [Google Scholar]
- De Matteis MA, Luini A. (2008). Exiting the Golgi complex. Nat Rev Mol Cell Biol , 273–284. [DOI] [PubMed] [Google Scholar]
- Diao A, Rahman D, Pappin DJC, Lucocq J, Lowe M. (2003). The coiled-coil membrane protein golgin-84 is a novel rab effector required for Golgi ribbon formation. J Cell Biol , 201–212. [DOI] [PMC free article] [PubMed] [Google Scholar]
- Dinter A, Berger EG. (1998). Golgi-disturbing agents. Histochem Cell Biol , 571–590. [DOI] [PubMed] [Google Scholar]
- Encell LP, Friedman Ohana RZimmerman KOtto PVidugiris GWood MGLos GVMcDougall MGZimprich CKarassina N, et al. (2012). Development of a dehalogenase-based protein fusion tag capable of rapid, selective and covalent attachment to customizable ligands. Curr Chem Genomics , 55–71. [DOI] [PMC free article] [PubMed] [Google Scholar]
- Farhan H, Rabouille C. (2011). Signalling to and from the secretory pathway. J Cell Sci , 171–180. [DOI] [PubMed] [Google Scholar]
- Freeze HH, Sampath D, Varki A. (1993). Alpha- and beta-xylosides alter glycolipid synthesis in human melanoma and Chinese hamster ovary cells. J Biol Chem , 1618–1627. [PubMed] [Google Scholar]
- Giannotta M, Ruggiero CGrossi MCancino JCapitani MPulvirenti TConsoli GMGeraci CFanelli FLuini A, et al. (2012). The KDEL receptor couples to Gαq/11 to activate Src kinases and regulate transport through the Golgi. EMBO J , 2869–2881. [DOI] [PMC free article] [PubMed] [Google Scholar]
- Hamati HF, Britton EL, Carey DJ. (1989). Inhibition of proteoglycan synthesis alters extracellular matrix deposition, proliferation, and cytoskeletal organization of rat aortic smooth muscle cells in culture. J Cell Biol , 2495–2505. [DOI] [PMC free article] [PubMed] [Google Scholar]
- Heinz S, Benner C, Spann N, Bertolino E, Lin YC, Laslo P, Cheng JX, Murre C, Singh H, Glass CK. (2010). Simple combinations of lineage-determining transcription factors prime cis-regulatory elements required for macrophage and B cell identities. Mol Cell , 576–589. [DOI] [PMC free article] [PubMed] [Google Scholar]
- Hetz C. (2012). The unfolded protein response: controlling cell fate decisions under ER stress and beyond. Nat Rev Mol Cell Biol , 89–102. [DOI] [PubMed] [Google Scholar]
- Hetz C, Chevet E, Harding HP. (2013). Targeting the unfolded protein response in disease. Nat Rev Drug Discov , 703–719. [DOI] [PubMed] [Google Scholar]
- Jiang Q, Wang LGuan YXu HNiu YHan LWei YPLin LChu JWang Q, et al. (2014). Golgin-84-associated Golgi fragmentation triggers tau hyperphosphorylation by activation of cyclin-dependent kinase-5 and extracellular signal-regulated kinase. Neurobiol Aging , 1352–1363. [DOI] [PubMed] [Google Scholar]
- Joshi G, Chi Y, Huang Z, Wang Y. (2014). Aβ-induced Golgi fragmentation in Alzheimer’s disease enhances Aβ production. Proc Natl Acad Sci USA , E1230–E1239. [DOI] [PMC free article] [PubMed] [Google Scholar]
- Kellokumpu S, Sormunen R, Kellokumpu I. (2002). Abnormal glycosylation and altered Golgi structure in colorectal cancer: dependence on intra-Golgi pH. FEBS Lett , 217–224. [DOI] [PubMed] [Google Scholar]
- Lippincott-Schwartz J, Phair RD. (2010). Lipids and cholesterol as regulators of traffic in the endomembrane system. Annu Rev Biophys , 559–578. [DOI] [PMC free article] [PubMed] [Google Scholar]
- Los GV, Encell LPMcDougall MGHartzell DDKarassina NZimprich CWood MGLearish ROhana RFUrh M, et al. (2008). HaloTag: a novel protein labeling technology for cell imaging and protein analysis. ACS Chem Biol , 373–382. [DOI] [PubMed] [Google Scholar]
- Makowski SL, Tran TT, Field SJ. (2017). Emerging themes of regulation at the Golgi. Curr Opin Cell Biol , 17–23. [DOI] [PMC free article] [PubMed] [Google Scholar]
- Martin ME, Hidalgo J, Rosa JL, Crottet P, Velasco A. (2000). Effect of protein kinase A activity on the association of ADP-ribosylation factor 1 to Golgi membranes. J Biol Chem , 19050–19059. [DOI] [PubMed] [Google Scholar]
- Mavillard F, Hidalgo J, Megias D, Levitsky KL, Velasco A. (2010). PKA-mediated Golgi remodeling during cAMP signal transmission. Traffic , 90–109. [DOI] [PubMed] [Google Scholar]
- Mayinger P. (2011). Signaling at the Golgi. Cold Spring Harb Perspect Biol , 1–14. [DOI] [PMC free article] [PubMed] [Google Scholar]
- Miyata S, Mizuno T, Koyama Y, Katayama T, Tohyama M. (2013). The endoplasmic reticulum-resident chaperone heat shock protein 47 protects the Golgi apparatus from the effects of O-glycosylation inhibition. PLoS One , e69732. [DOI] [PMC free article] [PubMed] [Google Scholar]
- Mollenhauer HH, Morré DJ, Rowe LD. (1990). Alteration of intracellular traffic by monensin; mechanism, specificity and relationship to toxicity. Biochim Biophys Acta , 225–246. [DOI] [PMC free article] [PubMed] [Google Scholar]
- Moremen KW, Tiemeyer M, Nairn AV. (2012). Vertebrate protein glycosylation: diversity, synthesis and function. Nat Rev Mol Cell Biol , 448–462. [DOI] [PMC free article] [PubMed] [Google Scholar]
- Morre JD, Mollenhauer HH. (2009). The Golgi Apparatus, New York: Springer. [Google Scholar]
- Muñiz M, Martín ME, Hidalgo J, Velasco A. (1997). Protein kinase A activity is required for the budding of constitutive transport vesicles from the trans-Golgi network. Proc Natl Acad Sci USA , 14461–14466. [DOI] [PMC free article] [PubMed] [Google Scholar]
- Nakamura N, Lowe M, Levine TP, Rabouille C, Warren G. (1997). The vesicle docking protein p115 binds GM130, a cis-Golgi matrix protein, in a mitotically regulated manner. Cell , 445–455. [DOI] [PubMed] [Google Scholar]
- Neklesa TK, Noblin DJKuzin ALew SSeetharaman JActon TBKornhaber GXiao RMontelione GTTong L, et al. (2013). A bidirectional system for the dynamic small molecule control of intracellular fusion proteins. ACS Chem Biol , 2293–2300. [DOI] [PMC free article] [PubMed] [Google Scholar]
- Neklesa TK, Tae HS, Schneekloth AR, Stulberg MJ, Corson TW, Sundberg TB, Raina K, Holley SA, Crews CM. (2011). Small-molecule hydrophobic tagging-induced degradation of HaloTag fusion proteins. Nat Chem Biol , 538–543. [DOI] [PMC free article] [PubMed] [Google Scholar]
- Nour-Eldin HH, Geu-Flores F, Halkier BA. (2010). USER cloning and USER fusion: the ideal cloning techniques for small and big laboratories. Methods Mol Biol , 185–200. [DOI] [PubMed] [Google Scholar]
- Okayama M, Kimata K, Suzuki S. (1973). The influence of p-nitrophenyl beta-d-xyloside on the synthesis of proteochondroitin sulfate by slices of embryonic chick cartilage. J Biochem , 1069–1073. [PubMed] [Google Scholar]
- Oku M, Tanakura S, Uemura A, Sohda M, Misumi Y, Taniguchi M, Wakabayashi S, Yoshida H. (2011). Novel cis-acting element GASE regulates transcriptional induction by the Golgi stress response. Cell Struct Funct , 1–12. [DOI] [PubMed] [Google Scholar]
- Petrosyan A, Holzapfel MS, Muirhead DE, Cheng P-W. (2014). Restoration of compact Golgi morphology in advanced prostate cancer enhances susceptibility to galectin-1-induced apoptosis by modifying mucin O-glycan synthesis. Mol Cancer Res , 1704–1716. [DOI] [PMC free article] [PubMed] [Google Scholar]
- Progida C, Bakke O. (2016). Bidirectional traffic between the Golgi and the endosomes—machineries and regulation. J Cell Sci , 3971–3982. [DOI] [PubMed] [Google Scholar]
- Pulvirenti T, Giannotta MCapestrano MCapitani MPisanu APolishchuk RSSan Pietro EBeznoussenko GVMironov AATuracchio G, et al. (2008). A traffic-activated Golgi-based signalling circuit coordinates the secretory pathway. Nat Cell Biol , 912–922. [DOI] [PubMed] [Google Scholar]
- Raina K, Noblin DJ, Serebrenik YV, Adams A, Zhao C, Crews CM. (2014). Targeted protein destabilization reveals an estrogen-mediated ER stress response. Nat Chem Biol , 957–962. [DOI] [PMC free article] [PubMed] [Google Scholar]
- Rambourg A, Clermont Y, Hermo L, Segretain D. (1987). Tridimensional architecture of the Golgi apparatus and its components in mucous cells of Brunner’s glands of the mouse. Am J Anat , 95–107. [DOI] [PubMed] [Google Scholar]
- Reiling JH, Olive AJ, Sanyal S, Carette JE, Brummelkamp TR, Ploegh HL, Starnbach MN, Sabatini DM. (2013). A CREB3-ARF4 signalling pathway mediates the response to Golgi stress and susceptibility to pathogens. Nat Cell Biol , 1473–1485. [DOI] [PMC free article] [PubMed] [Google Scholar]
- Satoh A, Wang Y, Malsam J, Beard MB, Warren G. (2003). Golgin-84 is a rab1 binding partner involved in Golgi structure. Traffic , 153–161. [DOI] [PMC free article] [PubMed] [Google Scholar]
- Schindelin J, Arganda-Carreras IFrise EKaynig VLongair MPietzsch TPreibisch SRueden CSaalfeld SSchmid B, et al. (2012). Fiji: an open-source platform for biological-image analysis. Nat Methods , 676–682. [DOI] [PMC free article] [PubMed] [Google Scholar]
- Shorter J, Warren G. (2002). Golgi architecture and inheritance. Annu Rev Cell Dev Biol , 379–420. [DOI] [PubMed] [Google Scholar]
- Stanley P. (2011). Golgi glycosylation. Cold Spring Harb Perspect Biol , 1–14. [DOI] [PMC free article] [PubMed] [Google Scholar]
- Stieber A, Mourelatos Z, Gonatas NK. (1996). In Alzheimer’s disease the Golgi apparatus of a population of neurons without neurofibrillary tangles is fragmented and atrophic. Am J Pathol , 415–426. [PMC free article] [PubMed] [Google Scholar]
- Sütterlin C, Hsu P, Mallabiabarrena A, Malhotra V. (2002). Fragmentation and dispersal of the pericentriolar Golgi complex is required for entry into mitosis in mammalian cells. Cell , 359–369. [DOI] [PubMed] [Google Scholar]
- Tae HS, Sundberg TB, Neklesa TK, Noblin DJ, Gustafson JL, Roth AG, Raina K, Crews CM. (2012). Identification of hydrophobic tags for the degradation of stabilized proteins. Chembiochem , 538–541. [DOI] [PMC free article] [PubMed] [Google Scholar]
- Taniguchi M, Nadanaka STanakura SSawaguchi SMidori SKawai YYamaguchi SShimada YNakamura YMatsumura Y, et al. (2015). TFE3 is a bHLH-ZIP-type transcription factor that regulates the mammalian Golgi stress response. Cell Struct Funct , 13–30. [DOI] [PubMed] [Google Scholar]
- Tewari R, Bachert C, Linstedt AD. (2015). Induced-oligomerization targets Golgi proteins for degradation in lysosomes. Mol Biol Cell , 4427–4437. [DOI] [PMC free article] [PubMed] [Google Scholar]
- Trapnell C, Pachter L, Salzberg SL. (2009). TopHat: discovering splice junctions with RNA-Seq. Bioinformatics , 1105–1111. [DOI] [PMC free article] [PubMed] [Google Scholar]
- Trapnell C, Williams BA, Pertea G, Mortazavi A, Kwan G, van Baren MJ, Salzberg SL, Wold BJ, Pachter L. (2010). Transcript assembly and quantification by RNA-Seq reveals unannotated transcripts and isoform switching during cell differentiation. Nat Biotechnol , 511–515. [DOI] [PMC free article] [PubMed] [Google Scholar]
- Varki A. (1998). Factors controlling the glycosylation potential of the Golgi apparatus. Trends Cell Biol , 34–40. [DOI] [PubMed] [Google Scholar]
- Wang Y, Satoh A, Warren G. (2005). Mapping the functional domains of the Golgi stacking factor GRASP65. J Biol Chem , 4921–4928. [DOI] [PMC free article] [PubMed] [Google Scholar]
- Yoshida H, Matsui T, Yamamoto A, Okada T, Mori K. (2001). XBP1 mRNA is induced by ATF6 and spliced by IRE1 in response to ER stress to produce a highly active transcription factor. Cell , 881–891. [DOI] [PubMed] [Google Scholar]
Associated Data
This section collects any data citations, data availability statements, or supplementary materials included in this article.
Supplementary Materials
Data Availability Statement
RNA-sequencing data were deposited in the NCBI GEO database (GSE99490).